| Param | Original file | Final file |
|---|---|---|
| Filename | modeM0/AS1A13_090T01_9000006458_51479cztM0_level2.fits | modeM0/AS1A13_090T01_9000006458_51479cztM0_level2_quad_clean.evt |
| Size (bytes) | 757,834,560 | 89,688,960 |
| Size | 722.7 MB | 85.5 MB |
| Events in quadrant A | 5,854,592 | 643,325 |
| Events in quadrant B | 3,650,668 | 714,991 |
| Events in quadrant C | 4,109,822 | 626,523 |
| Events in quadrant D | 13,905,059 | 252,538 |
| Mode M0 | |||
|---|---|---|---|
| Quadrant | BADHDUFLAG | Total packets | Discarded packets |
| A | 0 | 21975 | 2 |
| B | 0 | 15584 | 2 |
| C | 0 | 17156 | 2 |
| D | 0 | 46041 | 2 |
| Mode M9 | |||
|---|---|---|---|
| Quadrant | BADHDUFLAG | Total packets | Discarded packets |
| A | 0 | 12 | 0 |
| B | 0 | 13 | 0 |
| C | 0 | 13 | 0 |
| D | 0 | 13 | 0 |
| Mode SS | |||
|---|---|---|---|
| Quadrant | BADHDUFLAG | Total packets | Discarded packets |
| A | 0 | 138 | 0 |
| B | 0 | 138 | 0 |
| C | 0 | 138 | 0 |
| D | 0 | 138 | 0 |
| Quadrant | Total seconds | Saturated seconds | Saturation percentage |
|---|---|---|---|
| A | 6869 | 382 | 5.561217% |
| B | 6869 | 185 | 2.693260% |
| C | 6869 | 322 | 4.687727% |
| D | 6869 | 4184 | 60.911341% |
Noise dominated data is calculated using 1-second bins in cleaned event files. If a bin has >2000 counts, and if more than 50% of those come from <1% of pixels, then it is considered to be noise-dominated and hence unusable.
| Quadrant | # 1 sec bins | Bins with >0 counts | Bins with >2000 counts | High rate bins dominated by noise | Noise dominated (total time) | Noise dominated (detector-on time) | Marked lightcurve |
|---|---|---|---|---|---|---|---|
| A | 7909 | 6869 | 197 | 197 | 2.49% | 2.87% | 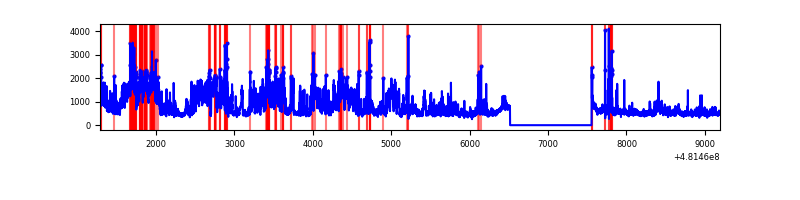 |
| B | 7909 | 6869 | 25 | 25 | 0.32% | 0.36% | 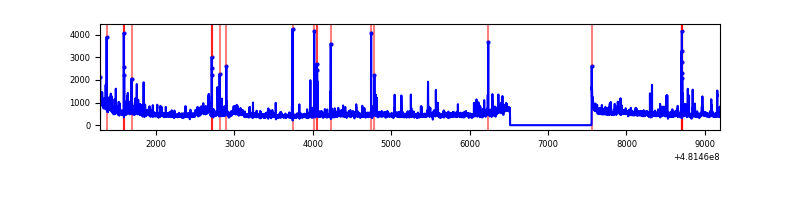 |
| C | 7909 | 6869 | 185 | 185 | 2.34% | 2.69% | 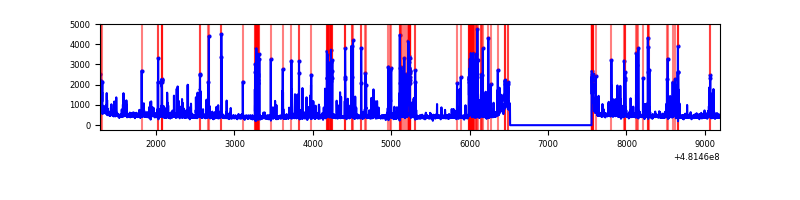 |
| D | 7909 | 6869 | 3938 | 3938 | 49.79% | 57.33% | 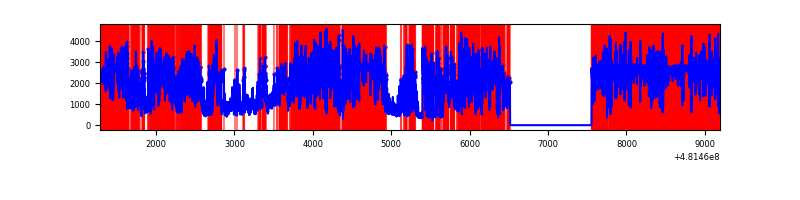 |
Top three noisy pixels from each quadrant. If the there are fewer than three noisy pixels in the level2.evt file, extra rows are filled as -1
| Pixel properties | Quadrant properties | ||||||
|---|---|---|---|---|---|---|---|
| Quadrant | DetID | PixID | Counts | Sigma | Mean | Median | Sigma |
| A | 12 | 3 | 1644777 | 8945.45 | 761 | 741 | 183.8 |
| A | 12 | 194 | 195633 | 1060.44 | 761 | 741 | 183.8 |
| A | 5 | 240 | 152504 | 825.77 | 761 | 741 | 183.8 |
| B | 5 | 172 | 117652 | 717.97 | 757 | 729 | 162.9 |
| B | 8 | 234 | 113738 | 693.93 | 757 | 729 | 162.9 |
| B | 0 | 213 | 63793 | 387.25 | 757 | 729 | 162.9 |
| C | 13 | 3 | 526494 | 2615.34 | 735 | 728 | 201.0 |
| C | 0 | 177 | 205953 | 1020.86 | 735 | 728 | 201.0 |
| C | 15 | 215 | 129452 | 640.32 | 735 | 728 | 201.0 |
| D | 8 | 176 | 10539182 | 76391.42 | 487 | 471 | 138.0 |
| D | 3 | 12 | 854767 | 6192.49 | 487 | 471 | 138.0 |
| D | 11 | 176 | 252931 | 1829.99 | 487 | 471 | 138.0 |
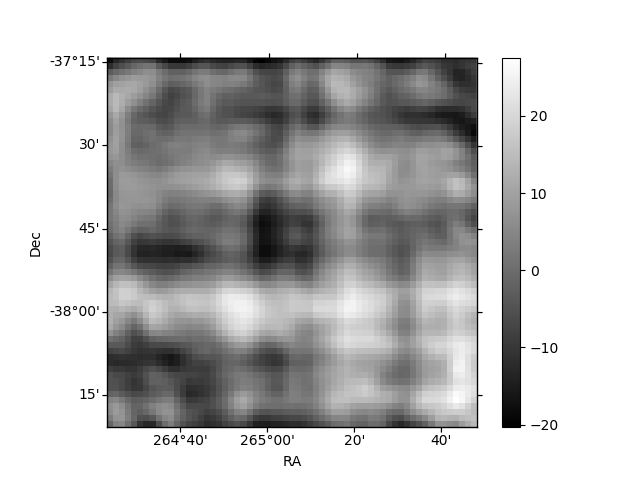
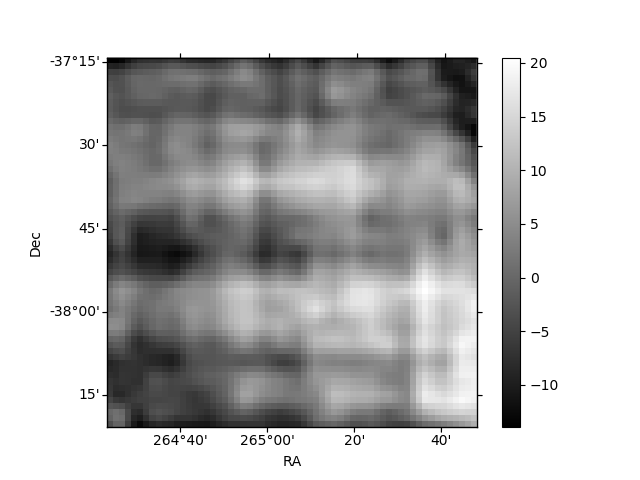
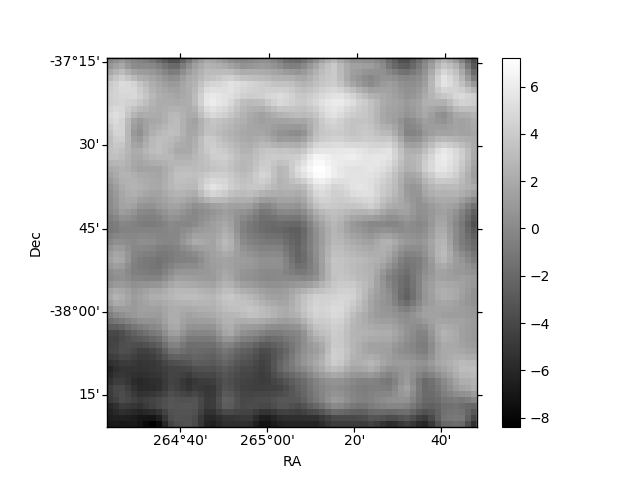
Histogram calculated using DETX and DETY for each event in the final _common_clean file
| Quadrant A | 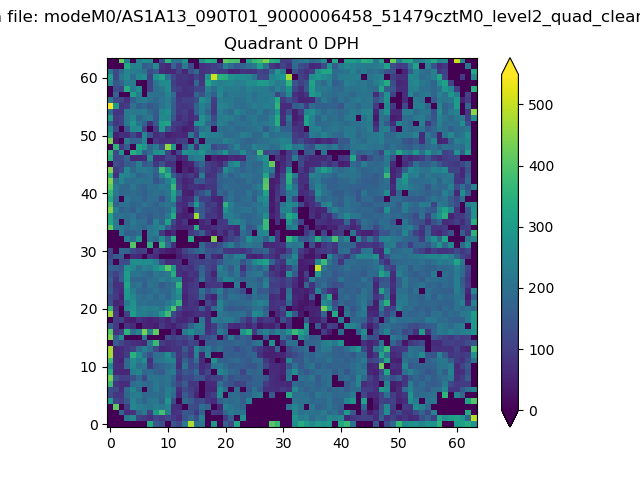 |
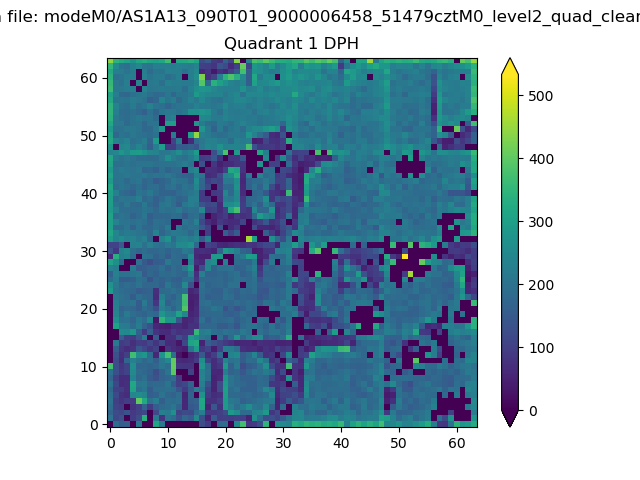 |
Quadrant B |
|---|---|---|---|
| Quadrant D | 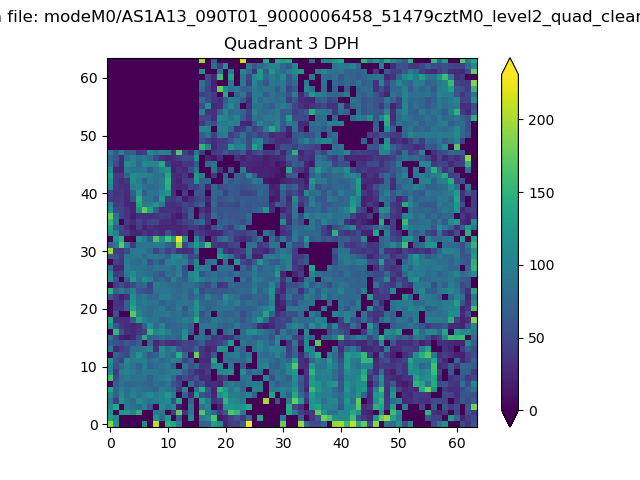 |
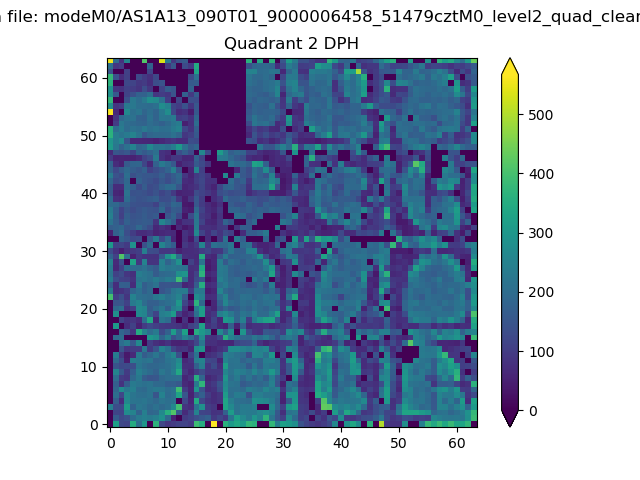 |
Quadrant C |
| Plot type | Count rate plots | Images |
|---|---|---|
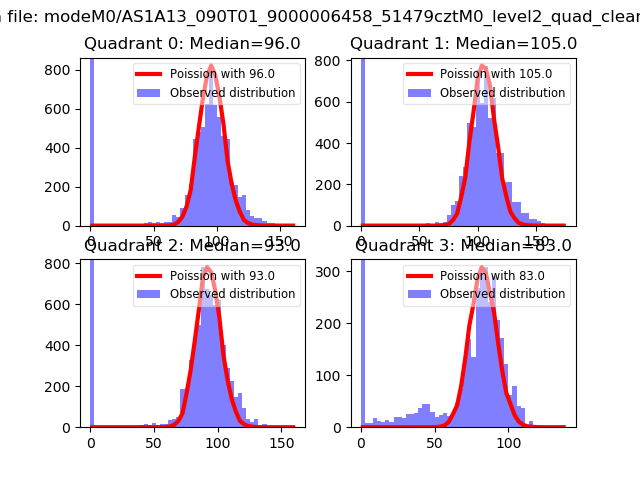
| Comparison with Poisson distribution Blue bars denote a histogram of data divided into 1 sec bins. Red curve is a Poisson curve with rate = median count rate of data. |
 |
 |
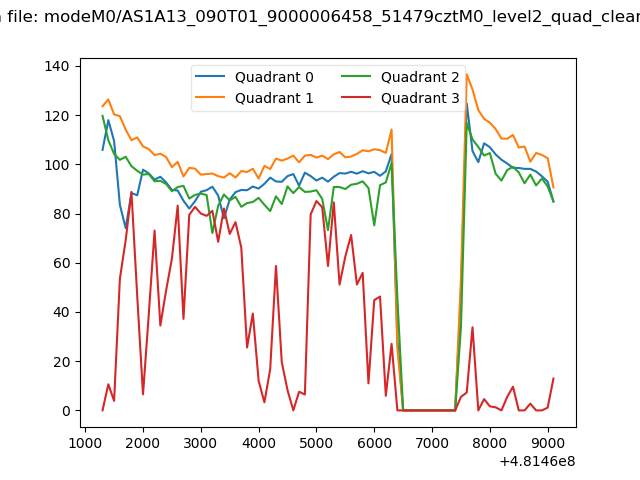
| Quadrant-wise count rates Data is divided into 100 sec bins |
 |
|
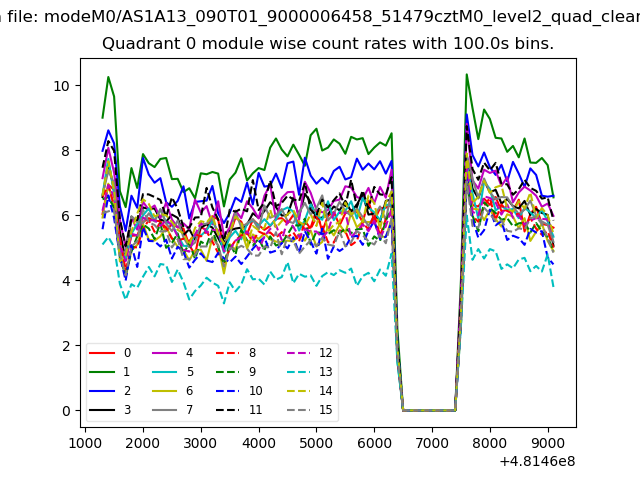
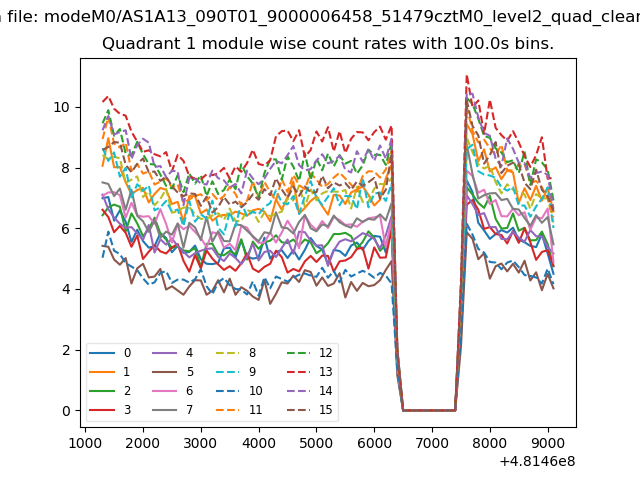
| Module-wise count rates for Quadrant A Data is divided into 100 sec bins |
 |
 |
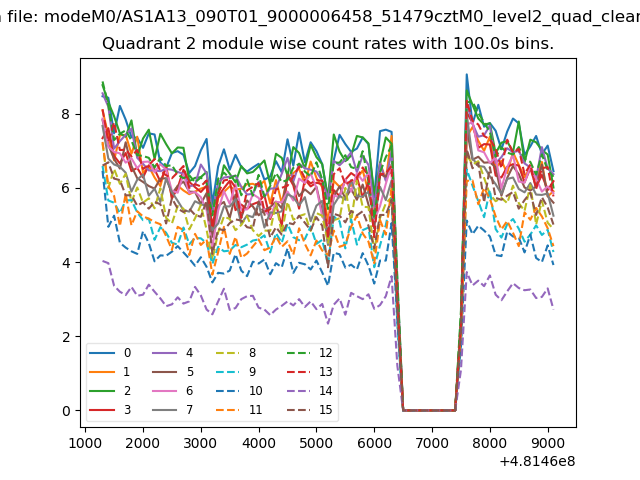
| Module-wise count rates for Quadrant B Data is divided into 100 sec bins |
 |
 |
| Module-wise count rates for Quadrant C Data is divided into 100 sec bins |
 |
 |
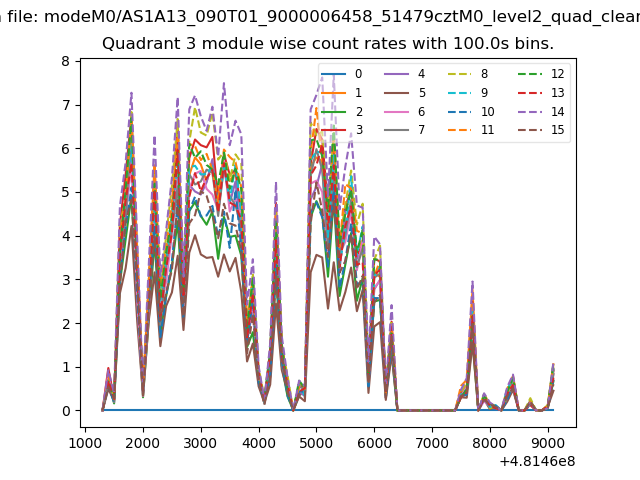
| Module-wise count rates for Quadrant D Data is divided into 100 sec bins |
 |
 |
| Parameter | Plot |
|---|---|
| CZT HV Monitor | 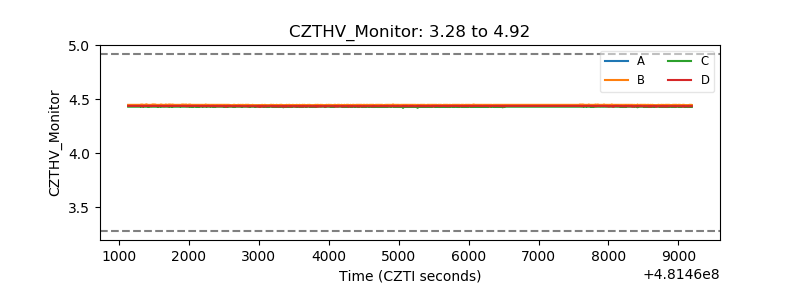 |
| D_VDD | 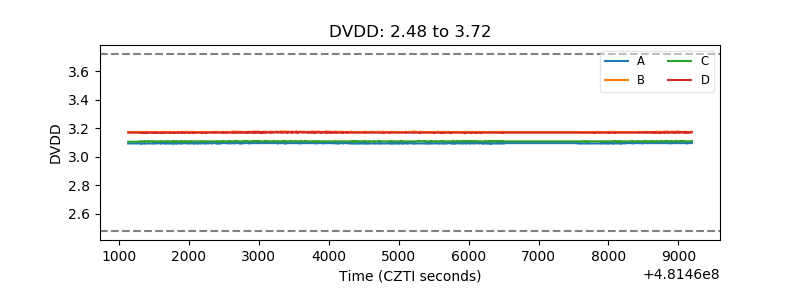 |
| Temperature 1 | 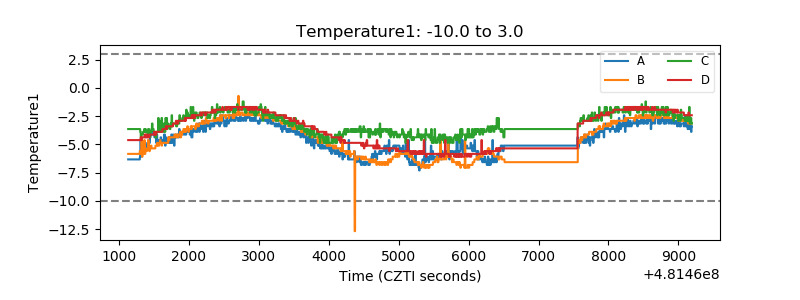 |
| Veto HV Monitor | 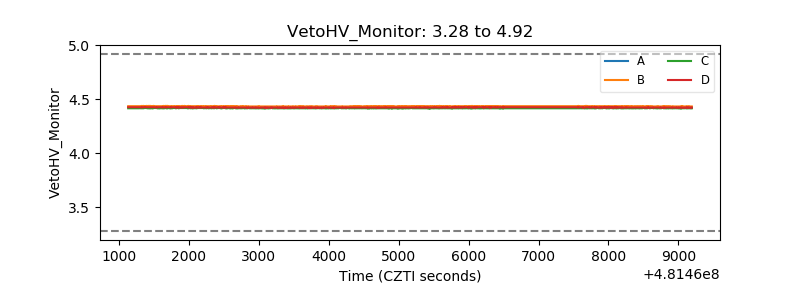 |
| Veto LLD | 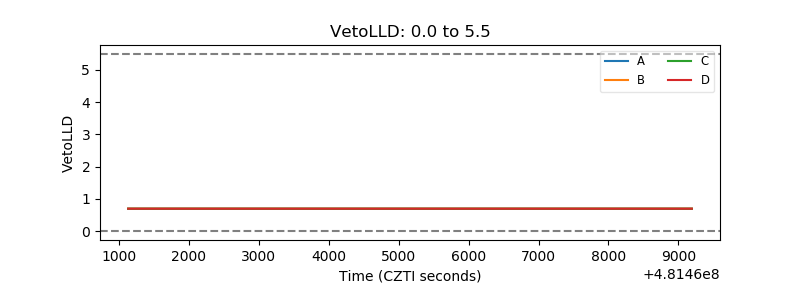 |
| Alpha Counter | 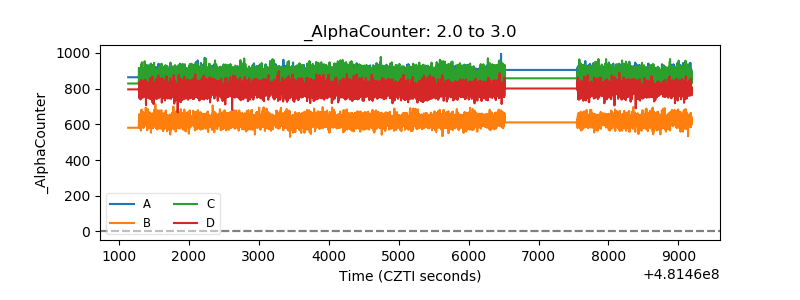 |
| _CPM_Rate | 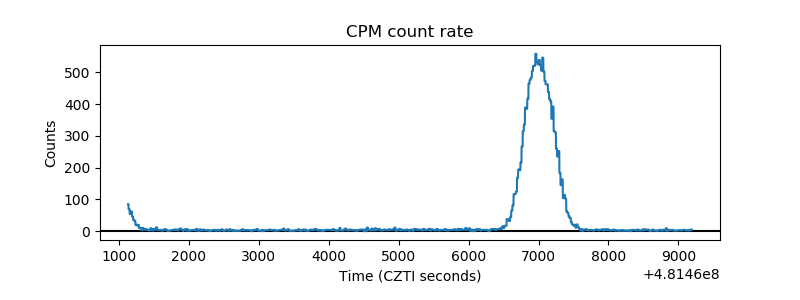 |
| CZT Counter | 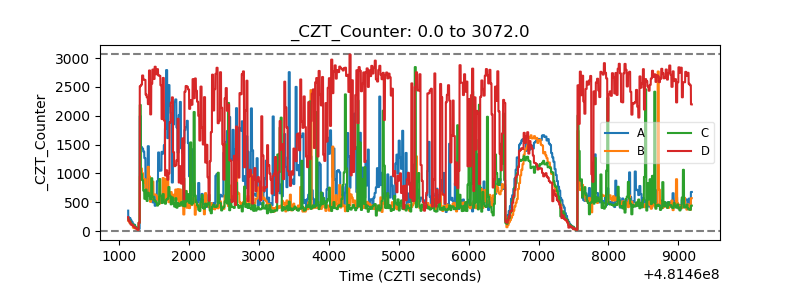 |
| +2.5 Volts monitor |  |
| +5 Volts monitor | 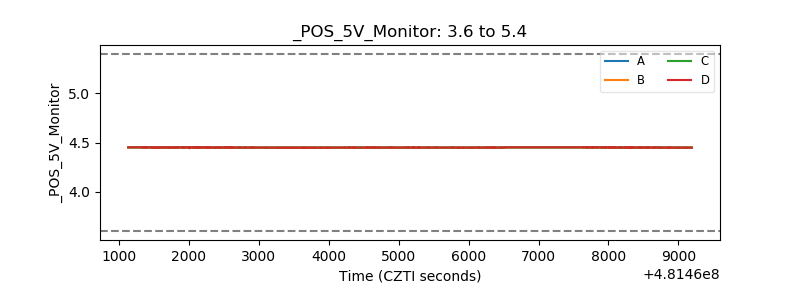 |
| _ROLL_ROT | 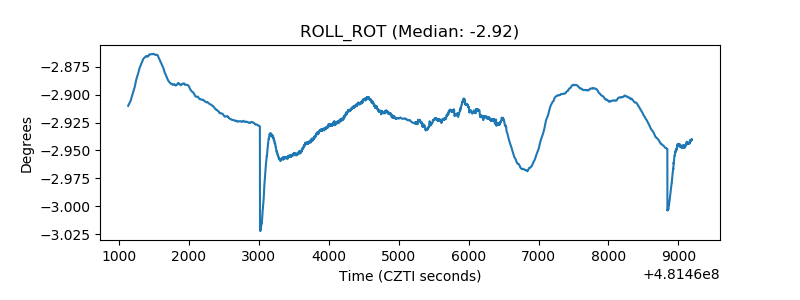 |
| _Roll_DEC | 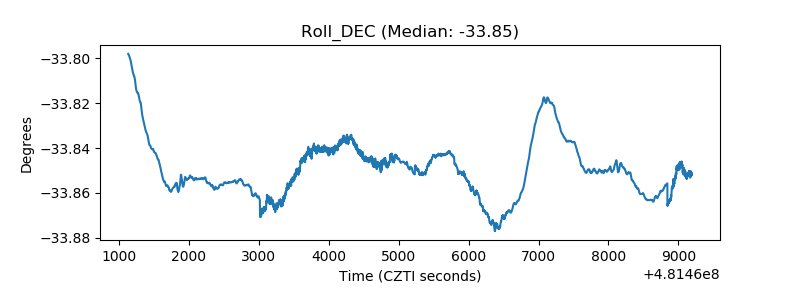 |
| _Roll_RA | 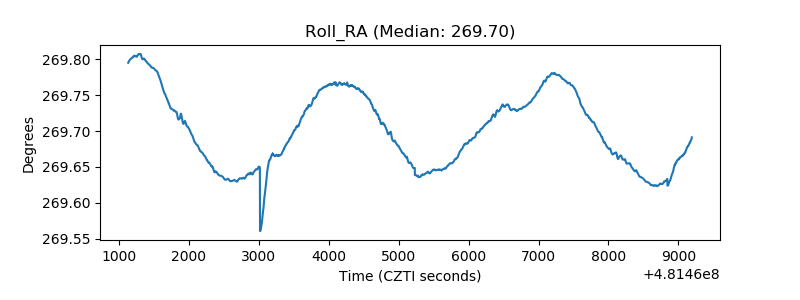 |
| Veto Counter | 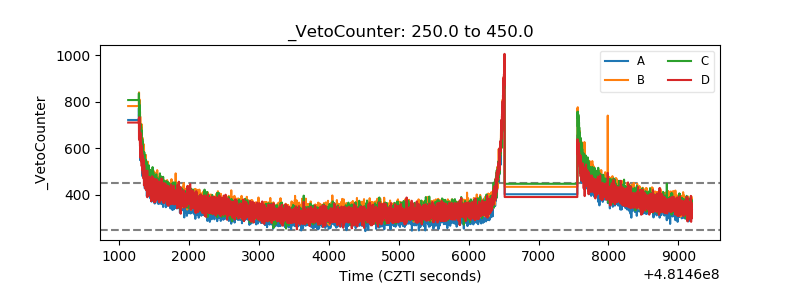 |