| Param | Original file | Final file |
|---|---|---|
| Filename | modeM0/AS1A13_090T01_9000006458_51480cztM0_level2.fits | modeM0/AS1A13_090T01_9000006458_51480cztM0_level2_quad_clean.evt |
| Size (bytes) | 755,841,600 | 83,980,800 |
| Size | 720.8 MB | 80.1 MB |
| Events in quadrant A | 4,962,797 | 614,803 |
| Events in quadrant B | 3,718,728 | 695,249 |
| Events in quadrant C | 4,016,109 | 604,827 |
| Events in quadrant D | 14,769,388 | 168,633 |
| Mode M0 | |||
|---|---|---|---|
| Quadrant | BADHDUFLAG | Total packets | Discarded packets |
| A | 0 | 19100 | 1 |
| B | 0 | 15388 | 1 |
| C | 0 | 16600 | 1 |
| D | 0 | 48428 | 1 |
| Mode M9 | |||
|---|---|---|---|
| Quadrant | BADHDUFLAG | Total packets | Discarded packets |
| A | 0 | 11 | 0 |
| B | 0 | 11 | 0 |
| C | 0 | 11 | 0 |
| D | 0 | 11 | 0 |
| Mode SS | |||
|---|---|---|---|
| Quadrant | BADHDUFLAG | Total packets | Discarded packets |
| A | 0 | 132 | 0 |
| B | 0 | 132 | 0 |
| C | 0 | 132 | 0 |
| D | 0 | 132 | 0 |
| Quadrant | Total seconds | Saturated seconds | Saturation percentage |
|---|---|---|---|
| A | 6589 | 485 | 7.360753% |
| B | 6589 | 187 | 2.838063% |
| C | 6589 | 345 | 5.235999% |
| D | 6589 | 4911 | 74.533313% |
Noise dominated data is calculated using 1-second bins in cleaned event files. If a bin has >2000 counts, and if more than 50% of those come from <1% of pixels, then it is considered to be noise-dominated and hence unusable.
| Quadrant | # 1 sec bins | Bins with >0 counts | Bins with >2000 counts | High rate bins dominated by noise | Noise dominated (total time) | Noise dominated (detector-on time) | Marked lightcurve |
|---|---|---|---|---|---|---|---|
| A | 7668 | 6588 | 162 | 162 | 2.11% | 2.46% | 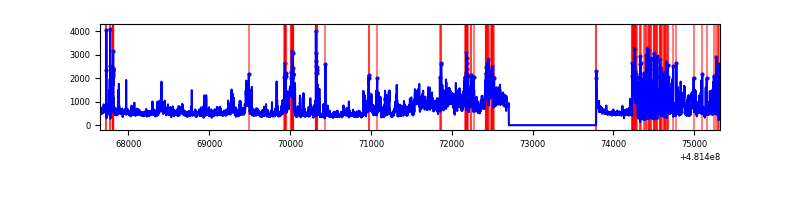 |
| B | 7669 | 6589 | 41 | 41 | 0.53% | 0.62% | 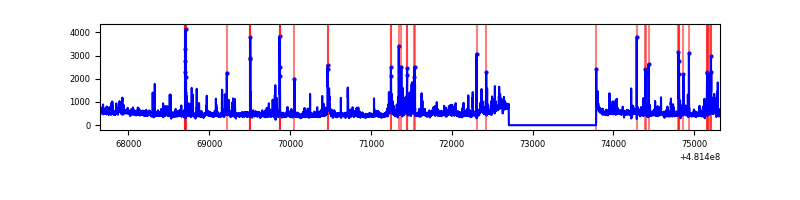 |
| C | 7669 | 6590 | 232 | 232 | 3.03% | 3.52% | 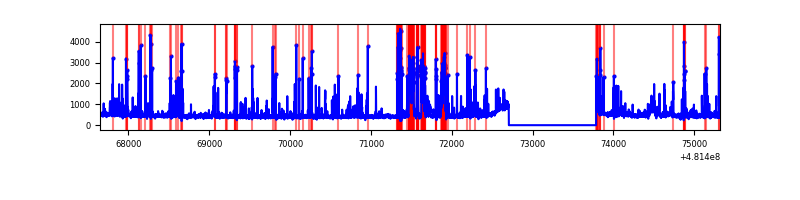 |
| D | 7669 | 6589 | 4583 | 4583 | 59.76% | 69.56% | 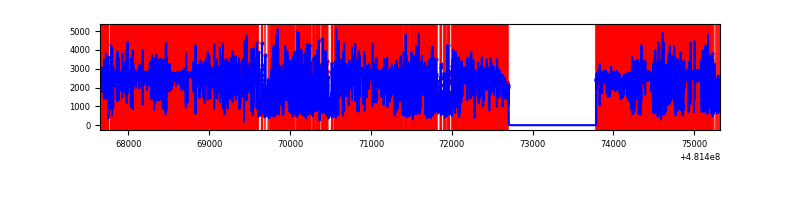 |
Top three noisy pixels from each quadrant. If the there are fewer than three noisy pixels in the level2.evt file, extra rows are filled as -1
| Pixel properties | Quadrant properties | ||||||
|---|---|---|---|---|---|---|---|
| Quadrant | DetID | PixID | Counts | Sigma | Mean | Median | Sigma |
| A | 12 | 3 | 834633 | 4735.52 | 721 | 701 | 176.1 |
| A | 12 | 250 | 233296 | 1320.8 | 721 | 701 | 176.1 |
| A | 8 | 63 | 194007 | 1097.69 | 721 | 701 | 176.1 |
| B | 8 | 234 | 164013 | 1044.3 | 732 | 705 | 156.4 |
| B | 10 | 14 | 111367 | 707.65 | 732 | 705 | 156.4 |
| B | 10 | 254 | 62947 | 398.02 | 732 | 705 | 156.4 |
| C | 13 | 3 | 443288 | 2293.67 | 709 | 702 | 193.0 |
| C | 1 | 60 | 383877 | 1985.78 | 709 | 702 | 193.0 |
| C | 10 | 171 | 159502 | 822.97 | 709 | 702 | 193.0 |
| D | 8 | 176 | 12640765 | 115611.29 | 387 | 374 | 109.3 |
| D | 11 | 176 | 306917 | 2803.7 | 387 | 374 | 109.3 |
| D | 3 | 12 | 98206 | 894.79 | 387 | 374 | 109.3 |
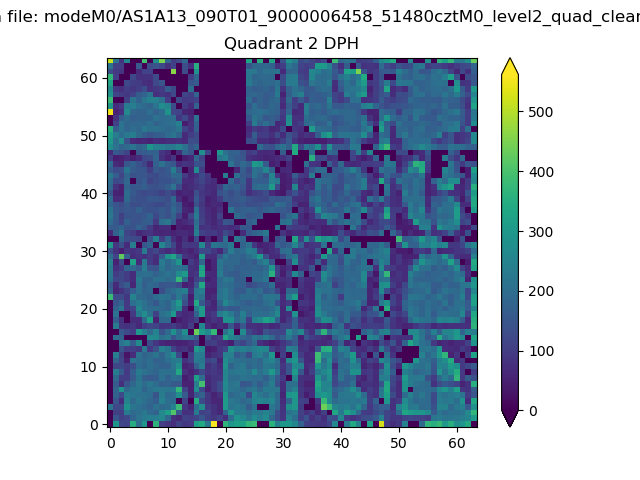
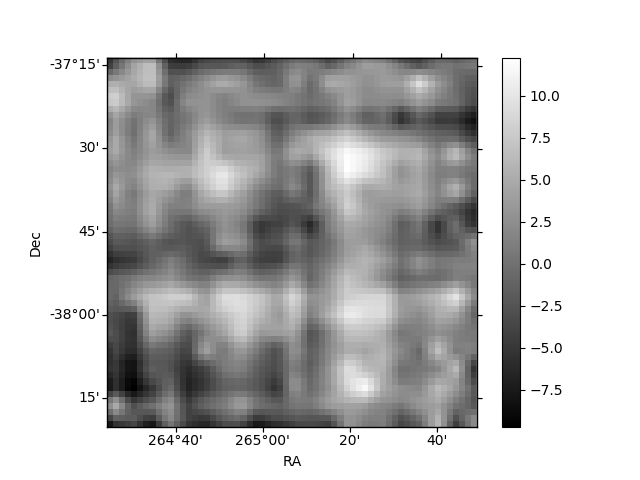
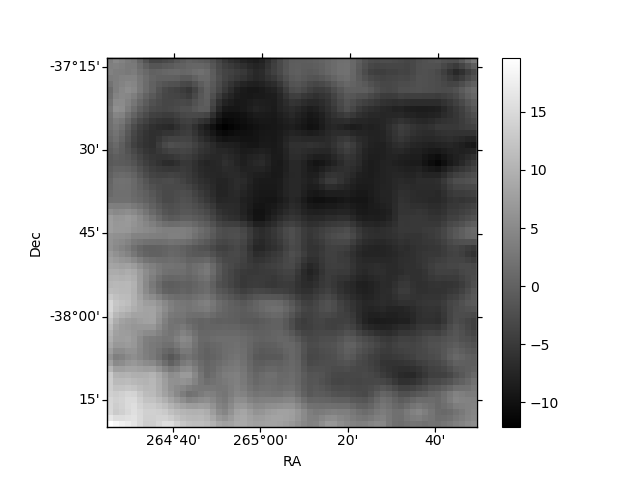
Histogram calculated using DETX and DETY for each event in the final _common_clean file
| Quadrant A | 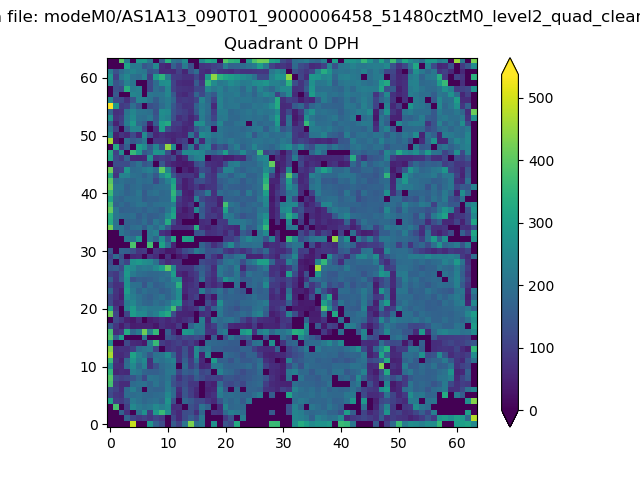 |
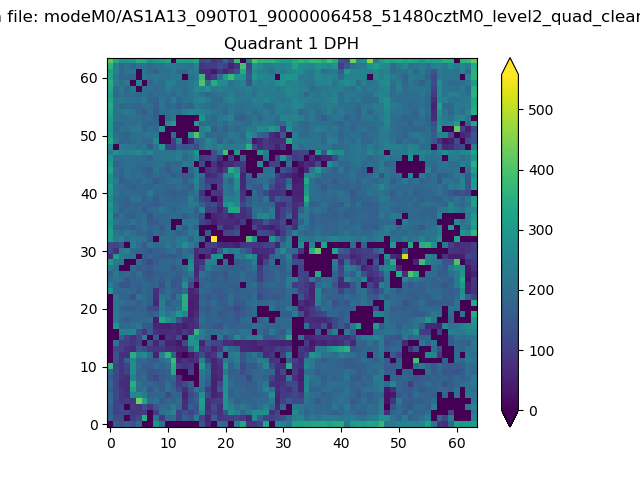 |
Quadrant B |
|---|---|---|---|
| Quadrant D | 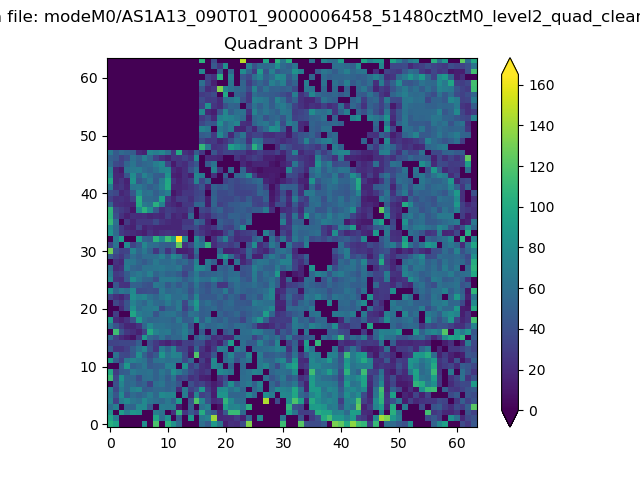 |
 |
Quadrant C |
| Plot type | Count rate plots | Images |
|---|---|---|
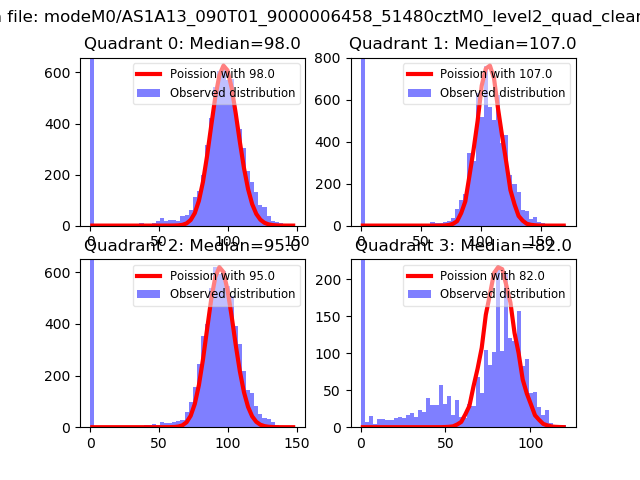
| Comparison with Poisson distribution Blue bars denote a histogram of data divided into 1 sec bins. Red curve is a Poisson curve with rate = median count rate of data. |
 |
 |
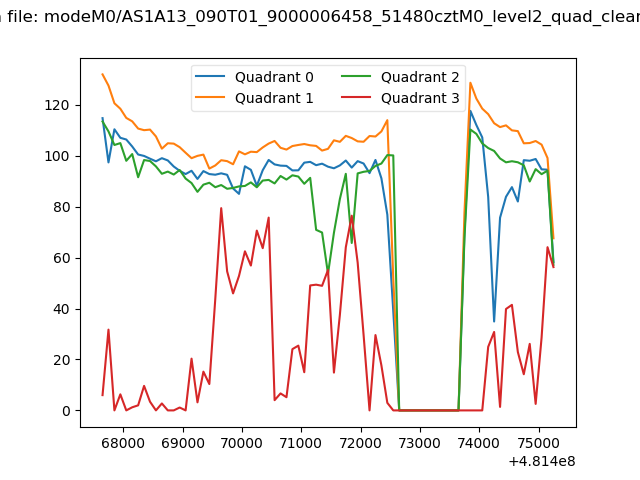
| Quadrant-wise count rates Data is divided into 100 sec bins |
 |
|
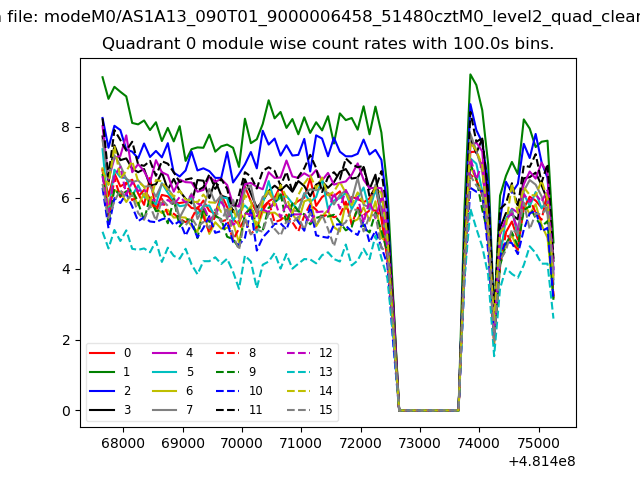
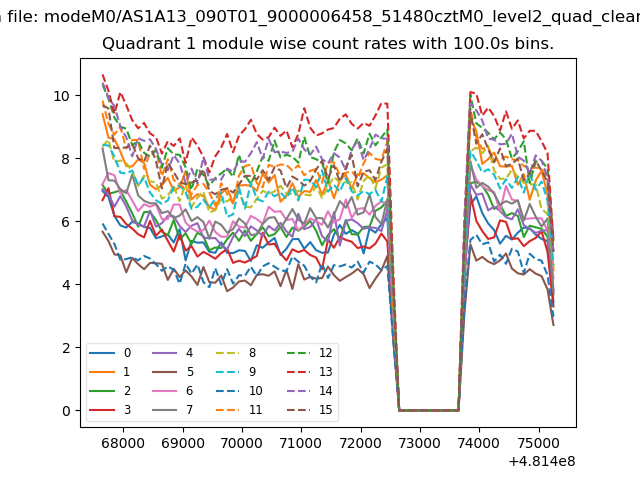
| Module-wise count rates for Quadrant A Data is divided into 100 sec bins |
 |
 |
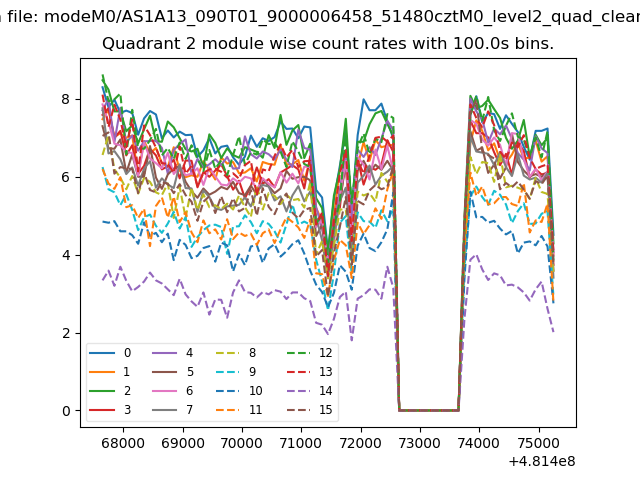
| Module-wise count rates for Quadrant B Data is divided into 100 sec bins |
 |
 |
| Module-wise count rates for Quadrant C Data is divided into 100 sec bins |
 |
 |
| Module-wise count rates for Quadrant D Data is divided into 100 sec bins |
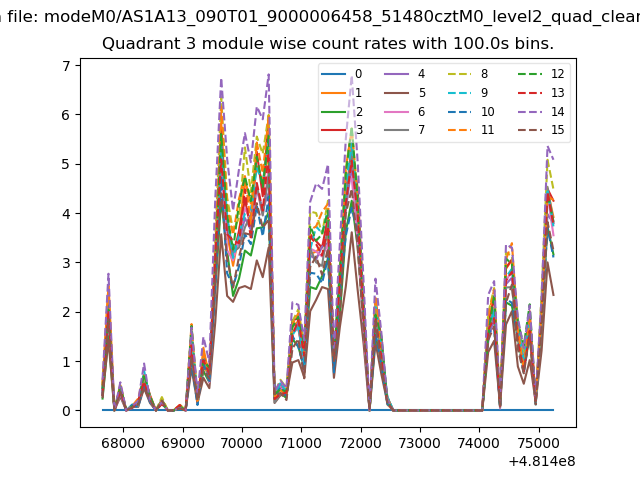 |
 |
| Parameter | Plot |
|---|---|
| CZT HV Monitor | 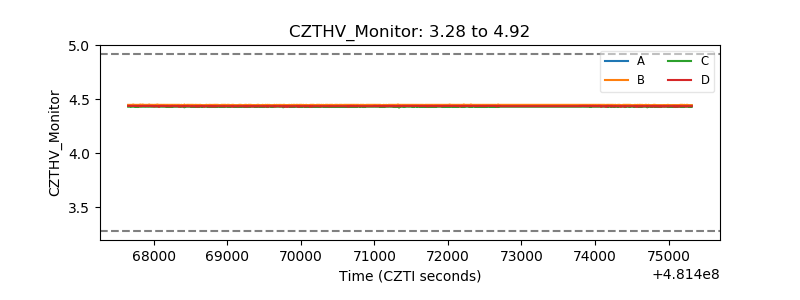 |
| D_VDD | 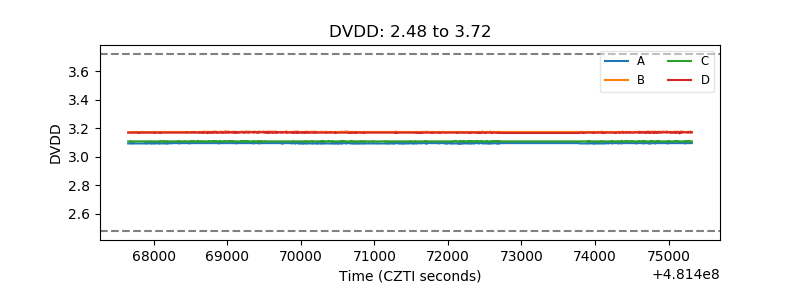 |
| Temperature 1 | 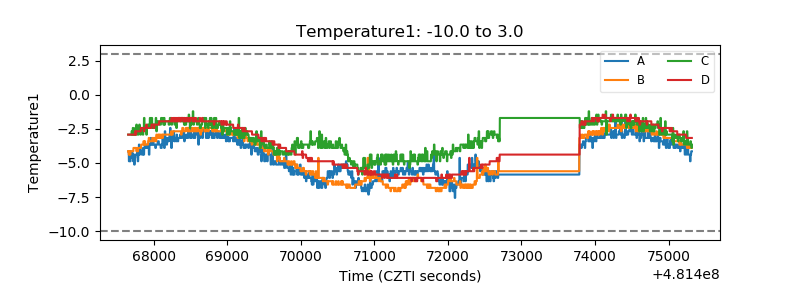 |
| Veto HV Monitor | 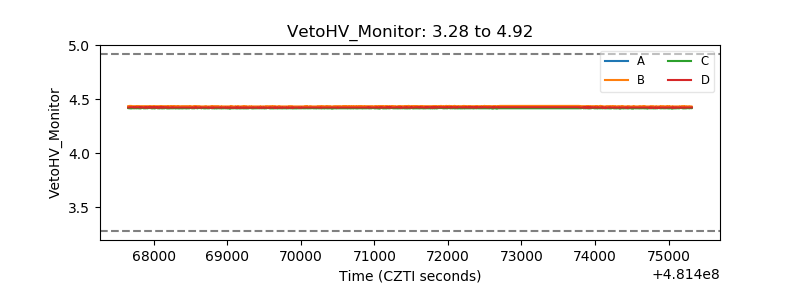 |
| Veto LLD | 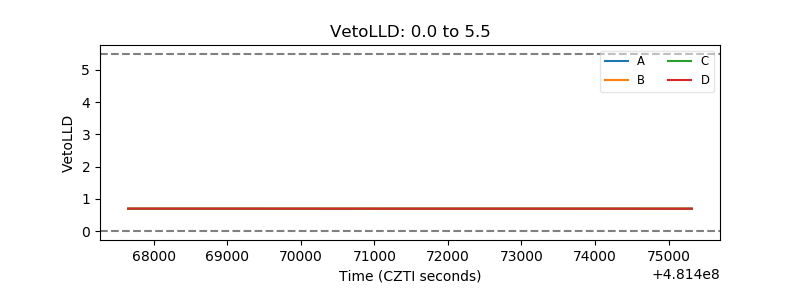 |
| Alpha Counter | 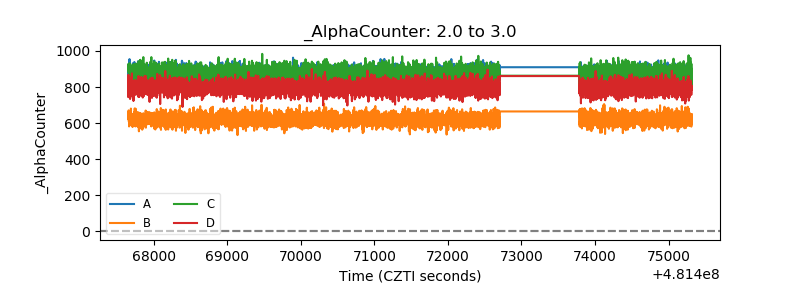 |
| _CPM_Rate | 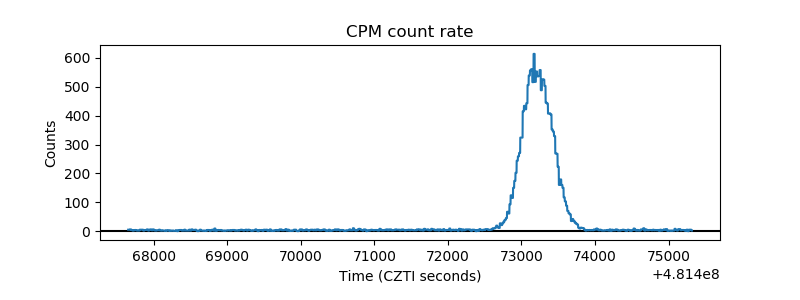 |
| CZT Counter | 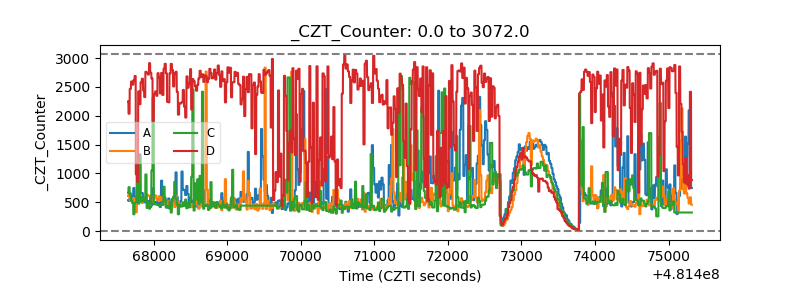 |
| +2.5 Volts monitor |  |
| +5 Volts monitor | 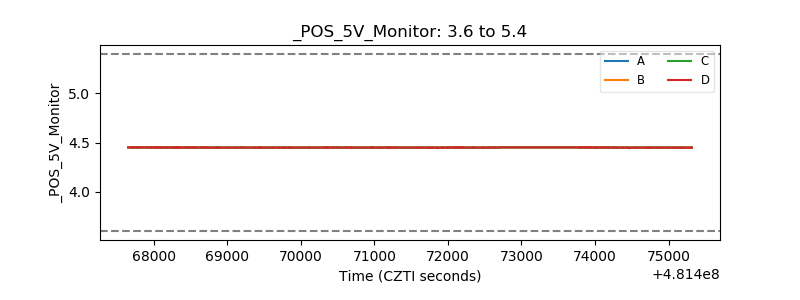 |
| _ROLL_ROT | 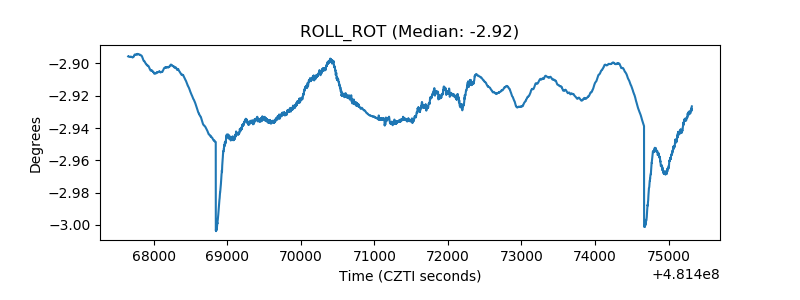 |
| _Roll_DEC | 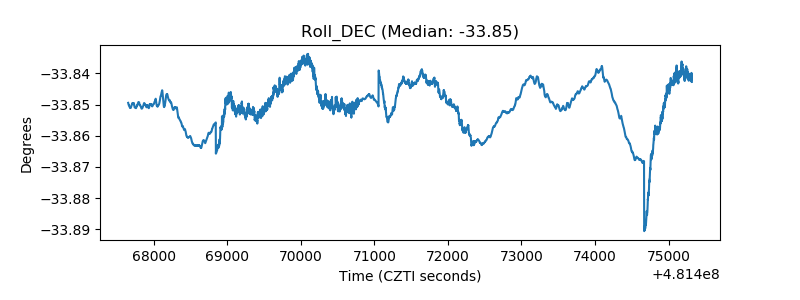 |
| _Roll_RA | 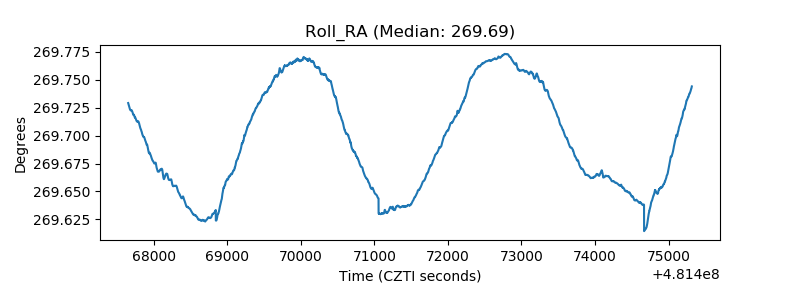 |
| Veto Counter | 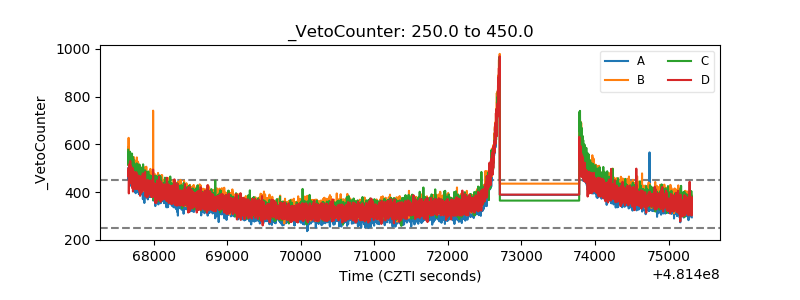 |