| Param | Original file | Final file |
|---|---|---|
| Filename | modeM0/AS1A13_090T01_9000006458_51482cztM0_level2.fits | modeM0/AS1A13_090T01_9000006458_51482cztM0_level2_quad_clean.evt |
| Size (bytes) | 713,710,080 | 85,302,720 |
| Size | 680.6 MB | 81.4 MB |
| Events in quadrant A | 8,936,708 | 514,538 |
| Events in quadrant B | 3,426,979 | 660,090 |
| Events in quadrant C | 4,084,706 | 584,880 |
| Events in quadrant D | 9,472,756 | 374,251 |
| Mode M0 | |||
|---|---|---|---|
| Quadrant | BADHDUFLAG | Total packets | Discarded packets |
| A | 0 | 30979 | 1 |
| B | 0 | 14558 | 1 |
| C | 0 | 16645 | 1 |
| D | 0 | 32717 | 3 |
| Mode M9 | |||
|---|---|---|---|
| Quadrant | BADHDUFLAG | Total packets | Discarded packets |
| A | 0 | 10 | 0 |
| B | 0 | 10 | 0 |
| C | 0 | 10 | 0 |
| D | 0 | 10 | 0 |
| Mode SS | |||
|---|---|---|---|
| Quadrant | BADHDUFLAG | Total packets | Discarded packets |
| A | 0 | 132 | 0 |
| B | 0 | 132 | 0 |
| C | 0 | 132 | 0 |
| D | 0 | 132 | 0 |
| Quadrant | Total seconds | Saturated seconds | Saturation percentage |
|---|---|---|---|
| A | 6431 | 1383 | 21.505209% |
| B | 6431 | 180 | 2.798943% |
| C | 6432 | 259 | 4.026741% |
| D | 6431 | 2360 | 36.697248% |
Noise dominated data is calculated using 1-second bins in cleaned event files. If a bin has >2000 counts, and if more than 50% of those come from <1% of pixels, then it is considered to be noise-dominated and hence unusable.
| Quadrant | # 1 sec bins | Bins with >0 counts | Bins with >2000 counts | High rate bins dominated by noise | Noise dominated (total time) | Noise dominated (detector-on time) | Marked lightcurve |
|---|---|---|---|---|---|---|---|
| A | 7436 | 6432 | 1074 | 1074 | 14.44% | 16.70% | 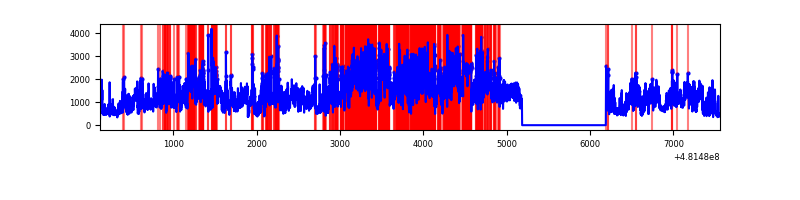 |
| B | 7436 | 6431 | 45 | 45 | 0.61% | 0.70% | 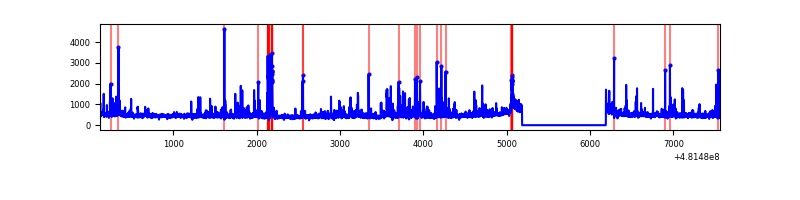 |
| C | 7437 | 6433 | 183 | 183 | 2.46% | 2.84% | 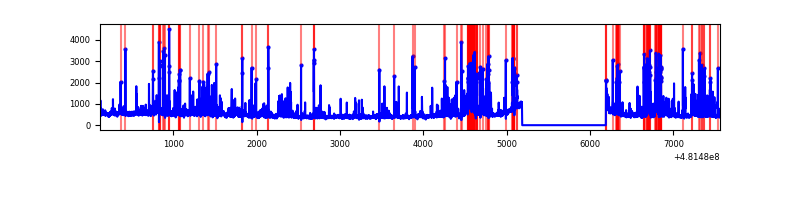 |
| D | 7435 | 6431 | 2286 | 2286 | 30.75% | 35.55% | 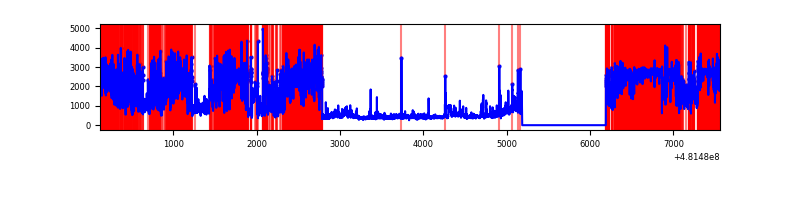 |
Top three noisy pixels from each quadrant. If the there are fewer than three noisy pixels in the level2.evt file, extra rows are filled as -1
| Pixel properties | Quadrant properties | ||||||
|---|---|---|---|---|---|---|---|
| Quadrant | DetID | PixID | Counts | Sigma | Mean | Median | Sigma |
| A | 12 | 3 | 3264622 | 20317.1 | 657 | 642 | 160.7 |
| A | 15 | 174 | 1770114 | 11014.33 | 657 | 642 | 160.7 |
| A | 12 | 194 | 378114 | 2349.63 | 657 | 642 | 160.7 |
| B | 7 | 252 | 102653 | 681.89 | 699 | 674 | 149.6 |
| B | 12 | 32 | 89270 | 592.41 | 699 | 674 | 149.6 |
| B | 0 | 245 | 58550 | 386.99 | 699 | 674 | 149.6 |
| C | 13 | 3 | 672332 | 3591.41 | 681 | 675 | 187.0 |
| C | 10 | 171 | 475225 | 2537.46 | 681 | 675 | 187.0 |
| C | 14 | 254 | 102783 | 545.98 | 681 | 675 | 187.0 |
| D | 8 | 176 | 3551125 | 22790.56 | 560 | 542 | 155.8 |
| D | 3 | 12 | 3223771 | 20689.33 | 560 | 542 | 155.8 |
| D | 11 | 176 | 174250 | 1115.0 | 560 | 542 | 155.8 |
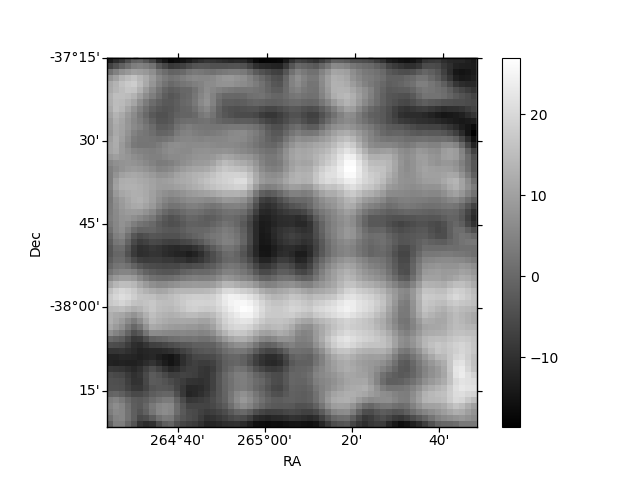
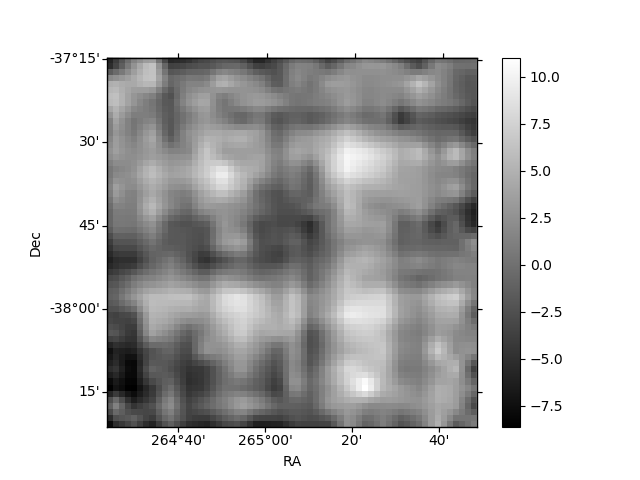
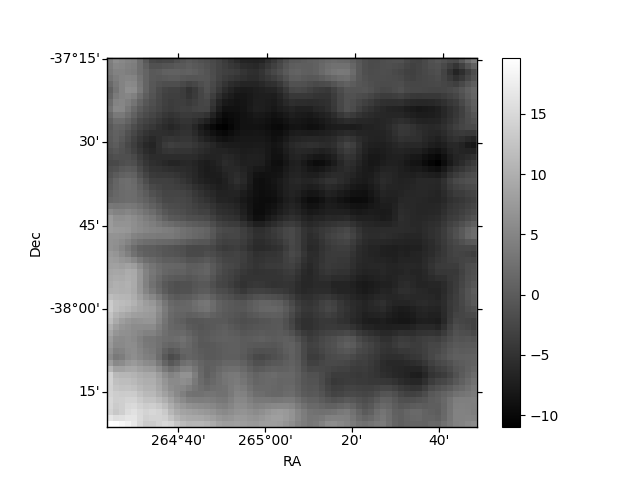
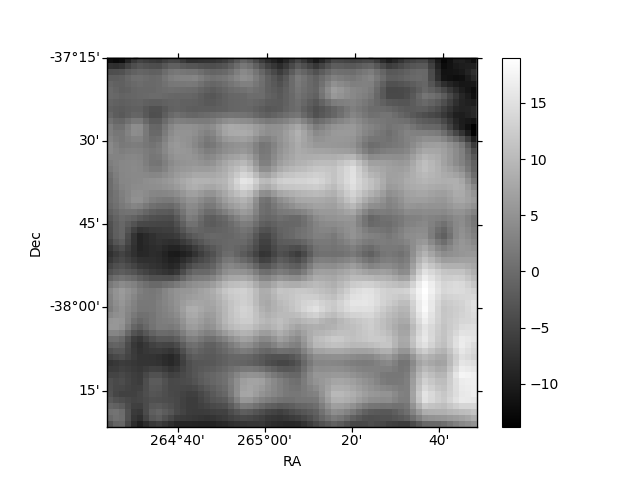
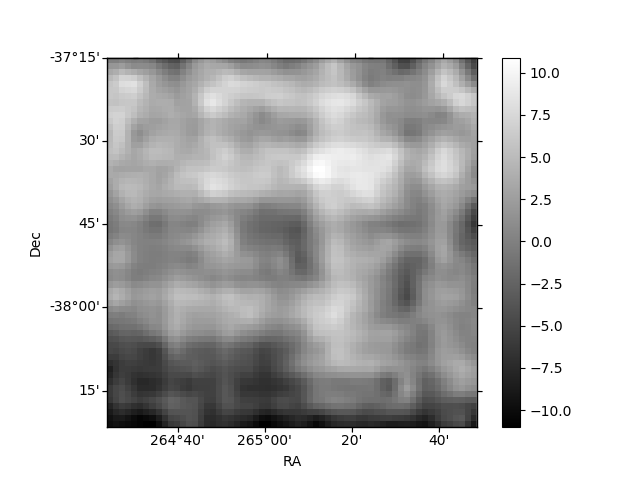
Histogram calculated using DETX and DETY for each event in the final _common_clean file
| Quadrant A | 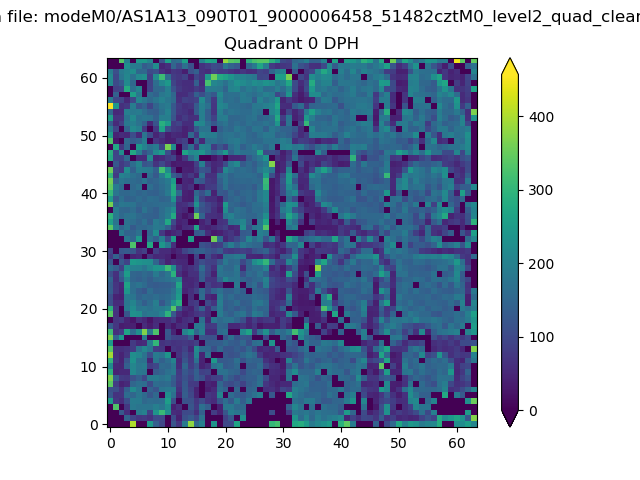 |
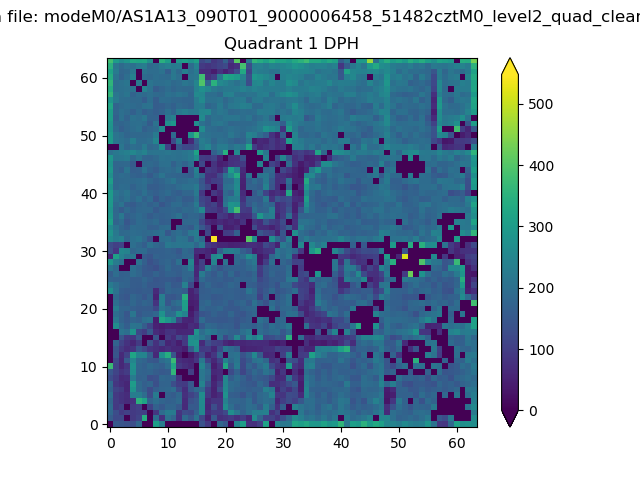 |
Quadrant B |
|---|---|---|---|
| Quadrant D | 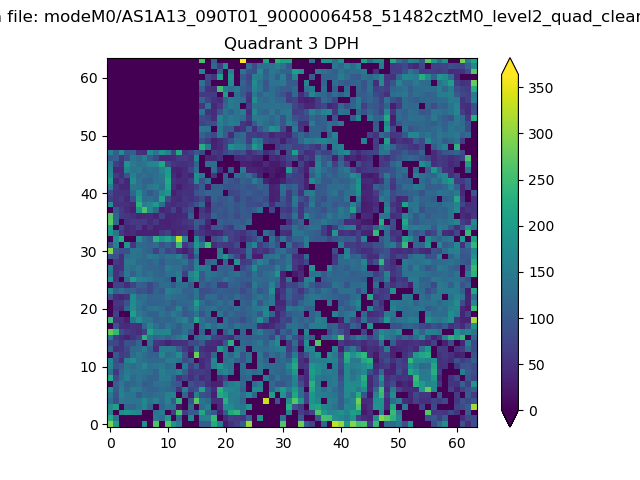 |
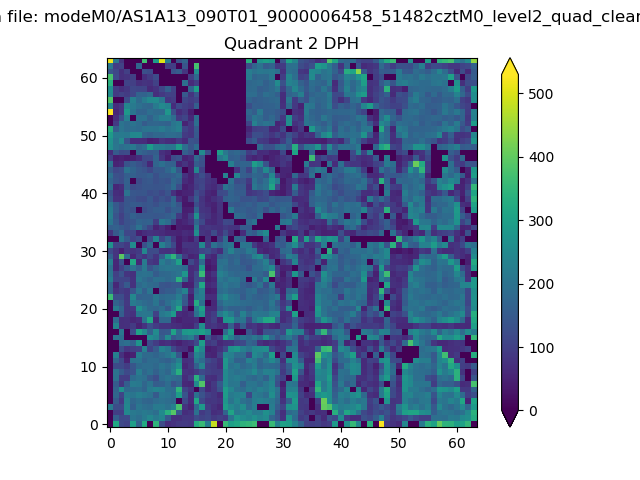 |
Quadrant C |
| Plot type | Count rate plots | Images |
|---|---|---|
| Comparison with Poisson distribution Blue bars denote a histogram of data divided into 1 sec bins. Red curve is a Poisson curve with rate = median count rate of data. |
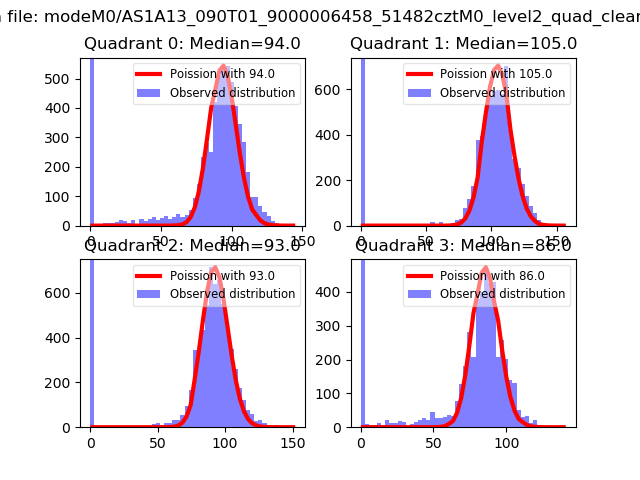 |
 |
| Quadrant-wise count rates Data is divided into 100 sec bins |
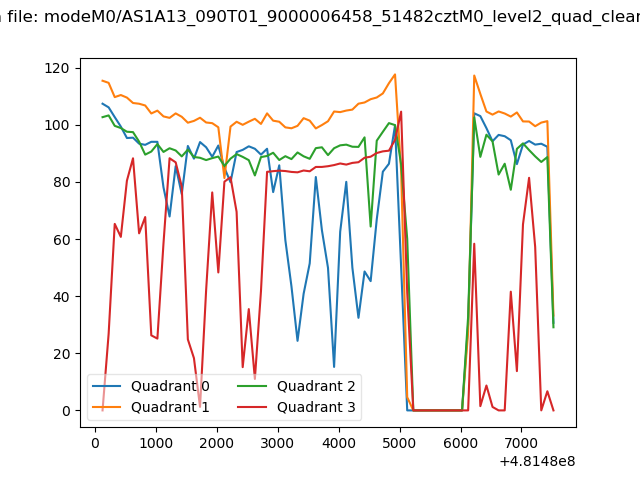 |
|
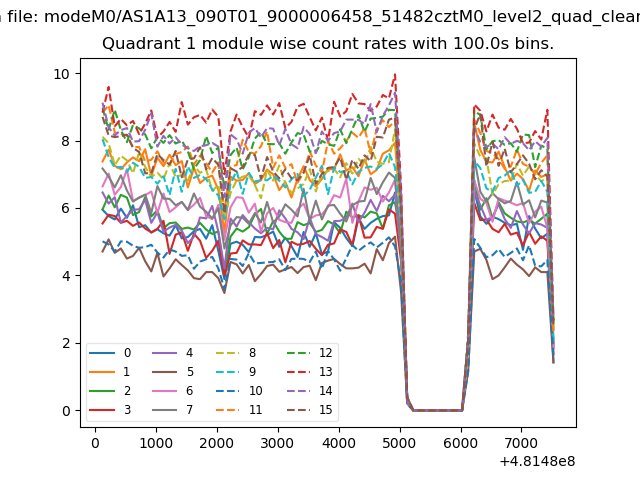
| Module-wise count rates for Quadrant A Data is divided into 100 sec bins |
 |
 |
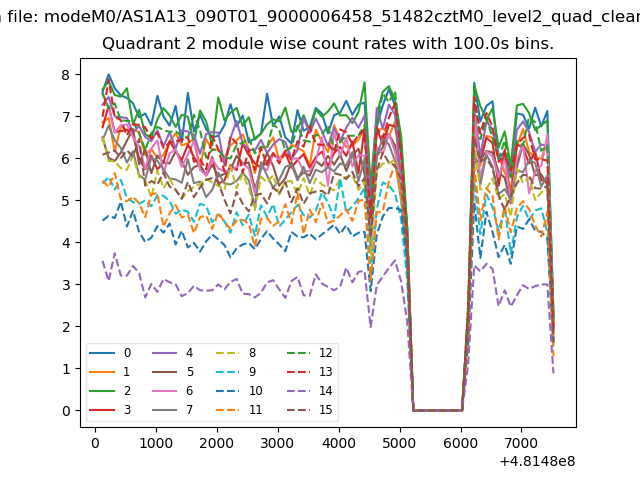
| Module-wise count rates for Quadrant B Data is divided into 100 sec bins |
 |
 |
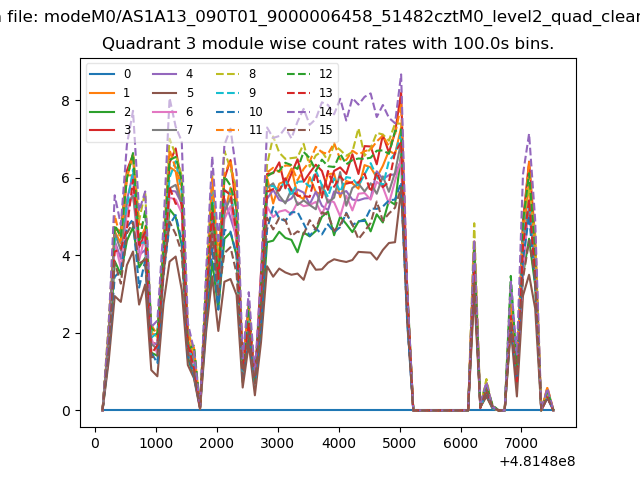
| Module-wise count rates for Quadrant C Data is divided into 100 sec bins |
 |
 |
| Module-wise count rates for Quadrant D Data is divided into 100 sec bins |
 |
 |
| Parameter | Plot |
|---|---|
| CZT HV Monitor | 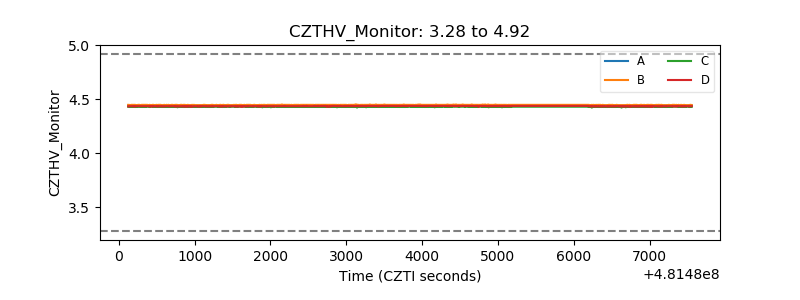 |
| D_VDD | 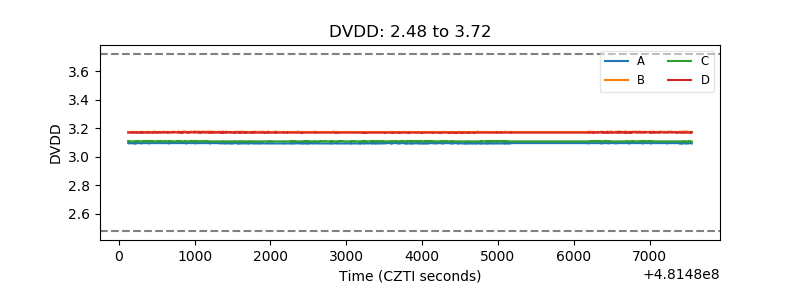 |
| Temperature 1 | 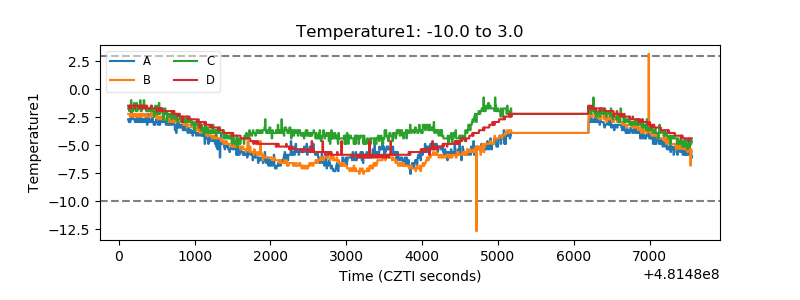 |
| Veto HV Monitor | 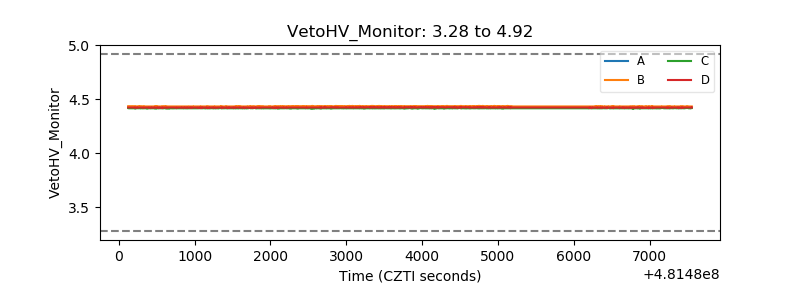 |
| Veto LLD | 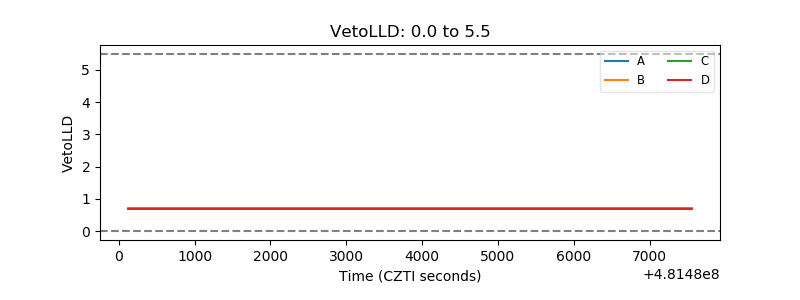 |
| Alpha Counter | 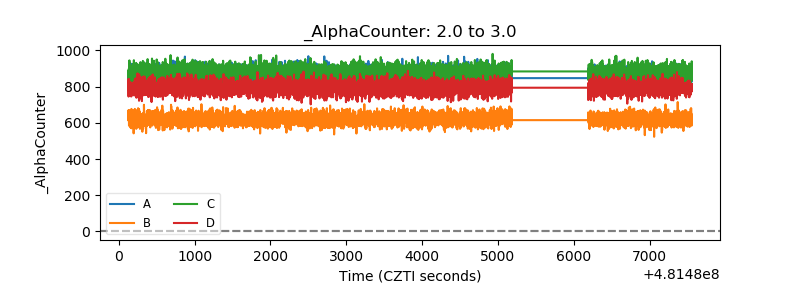 |
| _CPM_Rate | 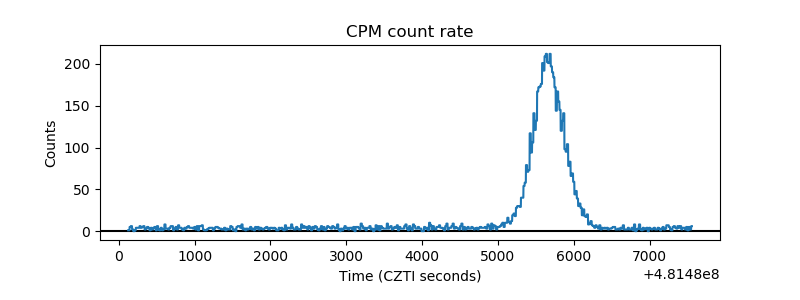 |
| CZT Counter | 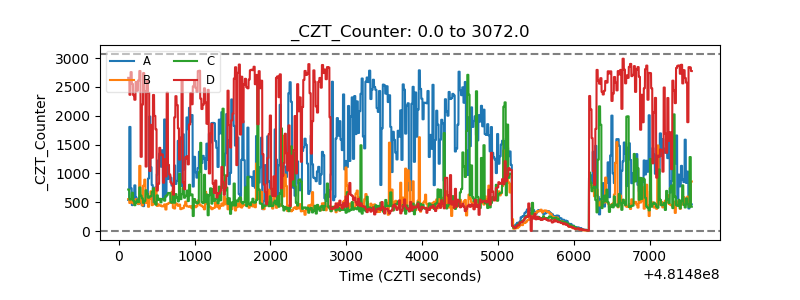 |
| +2.5 Volts monitor | 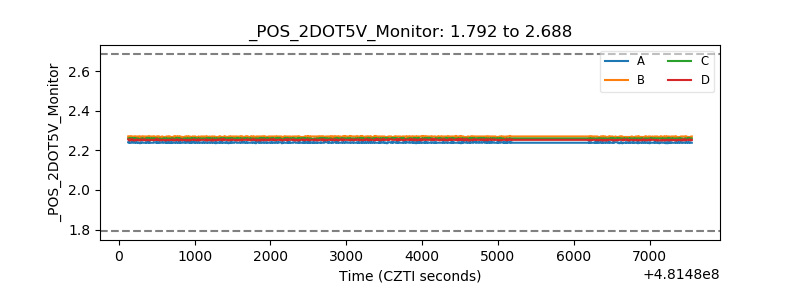 |
| +5 Volts monitor | 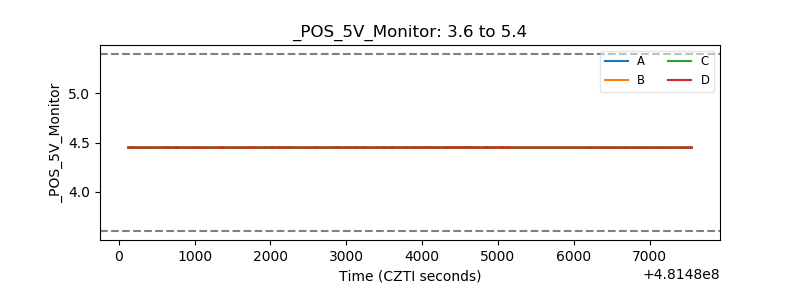 |
| _ROLL_ROT | 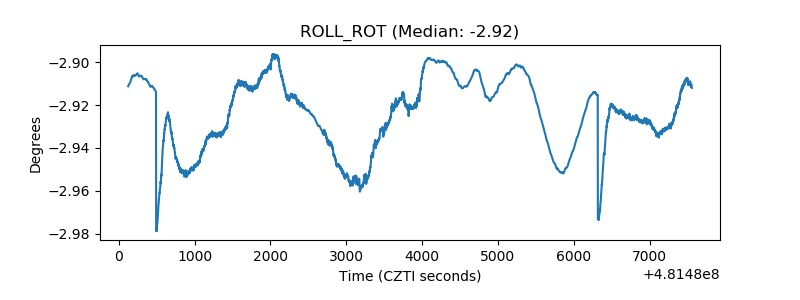 |
| _Roll_DEC | 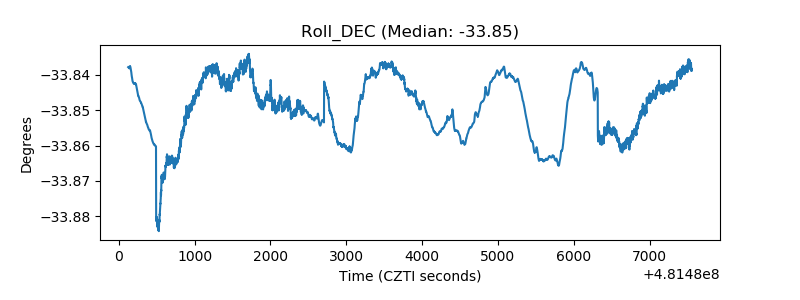 |
| _Roll_RA | 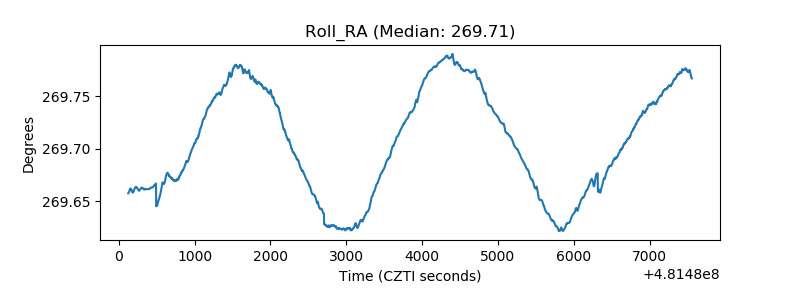 |
| Veto Counter | 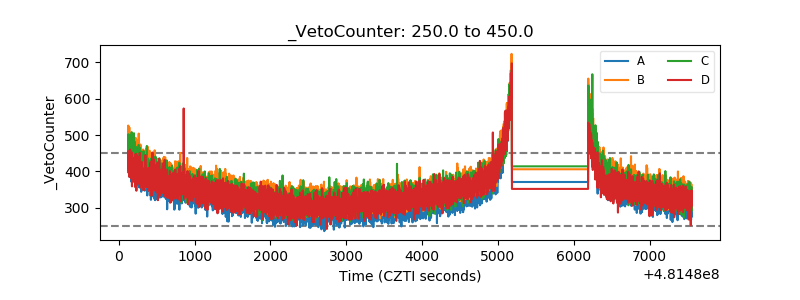 |