| Param | Original file | Final file |
|---|---|---|
| Filename | modeM0/AS1A13_090T01_9000006458_51484cztM0_level2.fits | modeM0/AS1A13_090T01_9000006458_51484cztM0_level2_quad_clean.evt |
| Size (bytes) | 742,138,560 | 98,478,720 |
| Size | 707.8 MB | 93.9 MB |
| Events in quadrant A | 6,395,320 | 657,429 |
| Events in quadrant B | 4,016,563 | 745,007 |
| Events in quadrant C | 3,968,523 | 670,961 |
| Events in quadrant D | 12,514,635 | 390,745 |
| Mode M0 | |||
|---|---|---|---|
| Quadrant | BADHDUFLAG | Total packets | Discarded packets |
| A | 0 | 24195 | 1 |
| B | 0 | 17178 | 1 |
| C | 0 | 17333 | 1 |
| D | 0 | 42311 | 9 |
| Mode M9 | |||
|---|---|---|---|
| Quadrant | BADHDUFLAG | Total packets | Discarded packets |
| A | 0 | 2 | 0 |
| B | 0 | 2 | 0 |
| C | 0 | 2 | 0 |
| D | 0 | 2 | 0 |
| Mode SS | |||
|---|---|---|---|
| Quadrant | BADHDUFLAG | Total packets | Discarded packets |
| A | 0 | 150 | 0 |
| B | 0 | 150 | 0 |
| C | 0 | 150 | 0 |
| D | 0 | 150 | 0 |
| Quadrant | Total seconds | Saturated seconds | Saturation percentage |
|---|---|---|---|
| A | 7442 | 612 | 8.223596% |
| B | 7443 | 264 | 3.546957% |
| C | 7443 | 161 | 2.163106% |
| D | 7442 | 3057 | 41.077667% |
Noise dominated data is calculated using 1-second bins in cleaned event files. If a bin has >2000 counts, and if more than 50% of those come from <1% of pixels, then it is considered to be noise-dominated and hence unusable.
| Quadrant | # 1 sec bins | Bins with >0 counts | Bins with >2000 counts | High rate bins dominated by noise | Noise dominated (total time) | Noise dominated (detector-on time) | Marked lightcurve |
|---|---|---|---|---|---|---|---|
| A | 7553 | 7445 | 256 | 256 | 3.39% | 3.44% | 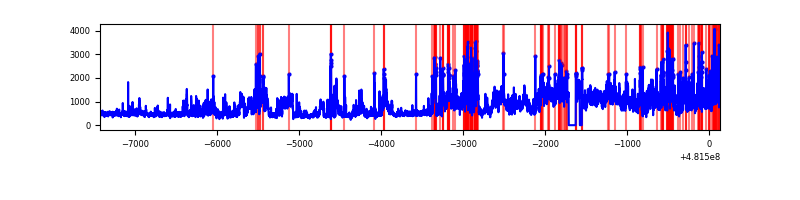 |
| B | 7554 | 7446 | 73 | 73 | 0.97% | 0.98% | 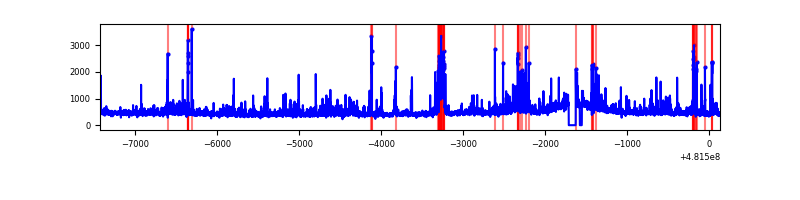 |
| C | 7554 | 7446 | 105 | 105 | 1.39% | 1.41% | 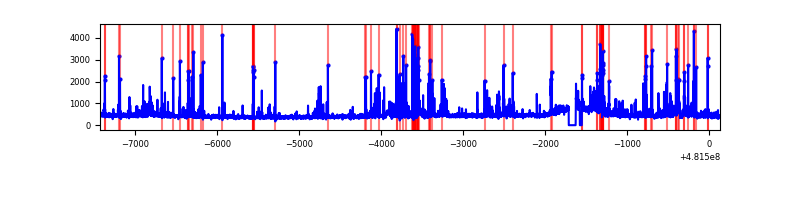 |
| D | 7552 | 7443 | 2937 | 2937 | 38.89% | 39.46% | 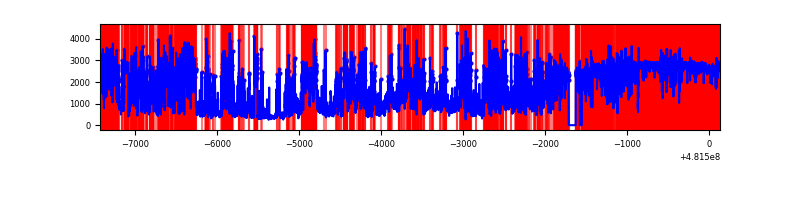 |
Top three noisy pixels from each quadrant. If the there are fewer than three noisy pixels in the level2.evt file, extra rows are filled as -1
| Pixel properties | Quadrant properties | ||||||
|---|---|---|---|---|---|---|---|
| Quadrant | DetID | PixID | Counts | Sigma | Mean | Median | Sigma |
| A | 12 | 3 | 1637455 | 8505.35 | 786 | 766 | 192.4 |
| A | 12 | 250 | 405958 | 2105.65 | 786 | 766 | 192.4 |
| A | 8 | 43 | 348883 | 1809.05 | 786 | 766 | 192.4 |
| B | 8 | 234 | 146101 | 839.1 | 803 | 773 | 173.2 |
| B | 7 | 252 | 133239 | 764.84 | 803 | 773 | 173.2 |
| B | 0 | 171 | 94959 | 543.82 | 803 | 773 | 173.2 |
| C | 13 | 3 | 533600 | 2486.38 | 788 | 778 | 214.3 |
| C | 14 | 254 | 76862 | 355.04 | 788 | 778 | 214.3 |
| C | 12 | 252 | 54310 | 249.8 | 788 | 778 | 214.3 |
| D | 8 | 176 | 7283511 | 43207.49 | 603 | 580 | 168.6 |
| D | 3 | 12 | 2087975 | 12383.9 | 603 | 580 | 168.6 |
| D | 11 | 176 | 341029 | 2019.78 | 603 | 580 | 168.6 |
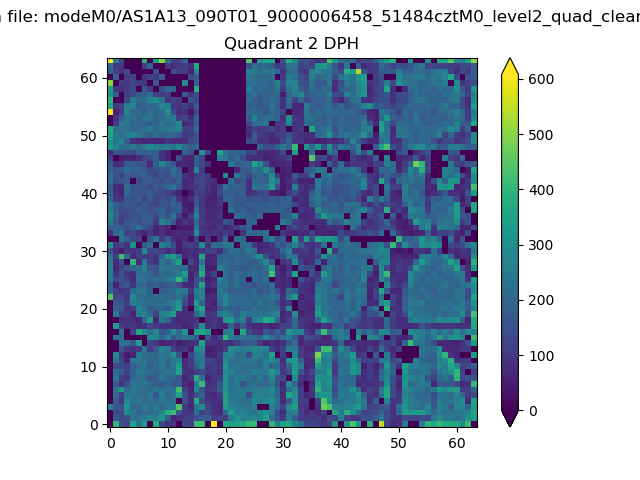
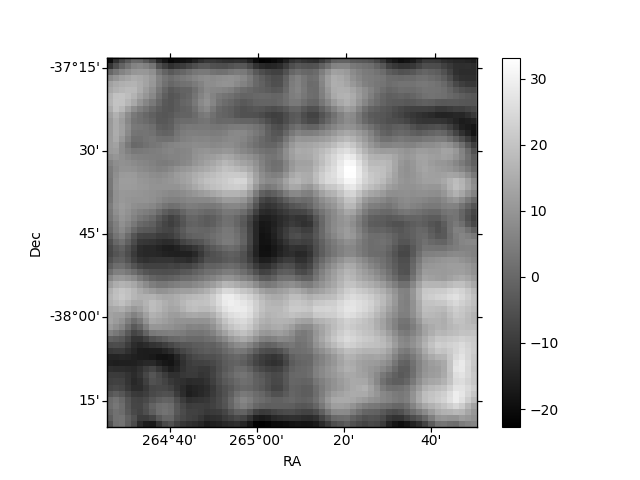
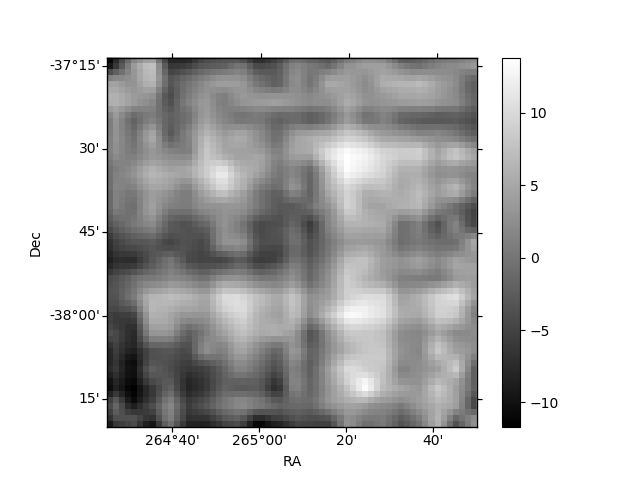
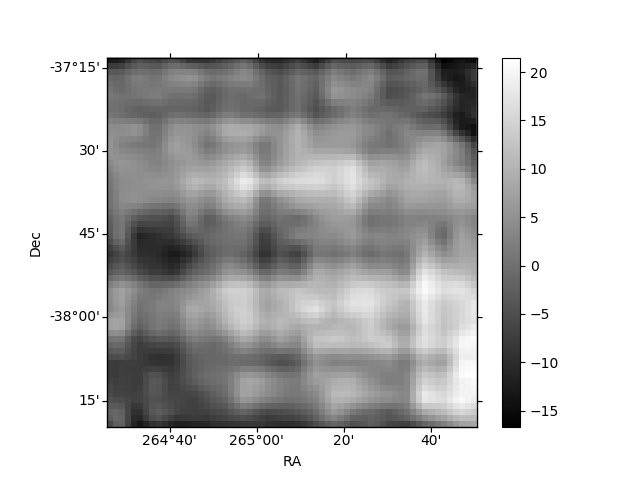
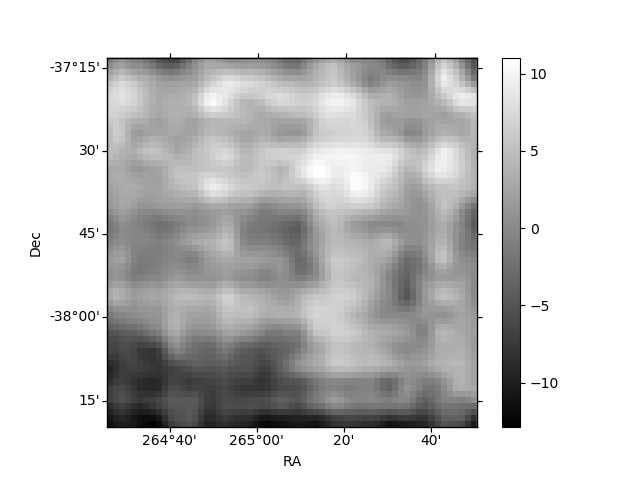
Histogram calculated using DETX and DETY for each event in the final _common_clean file
| Quadrant A | 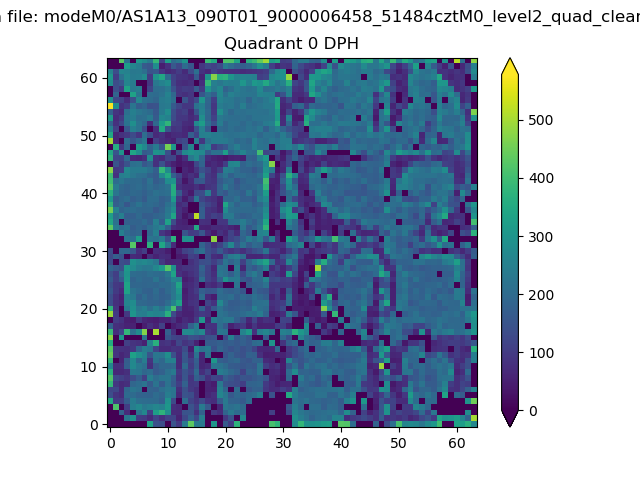 |
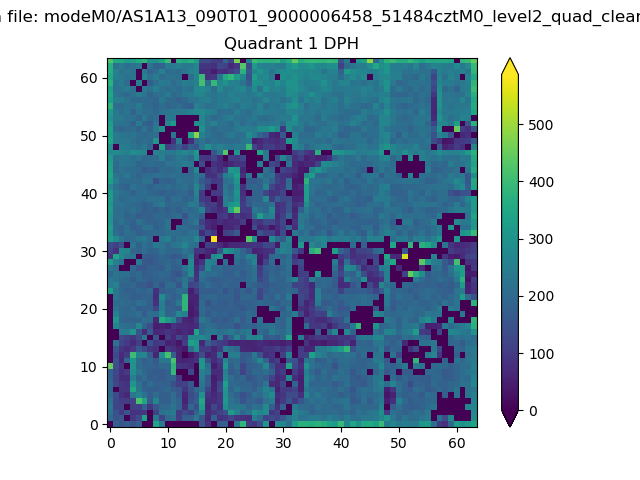 |
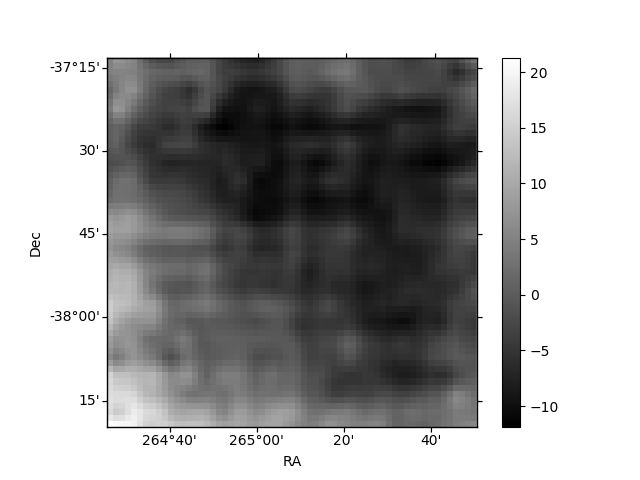
Quadrant B |
|---|---|---|---|
| Quadrant D | 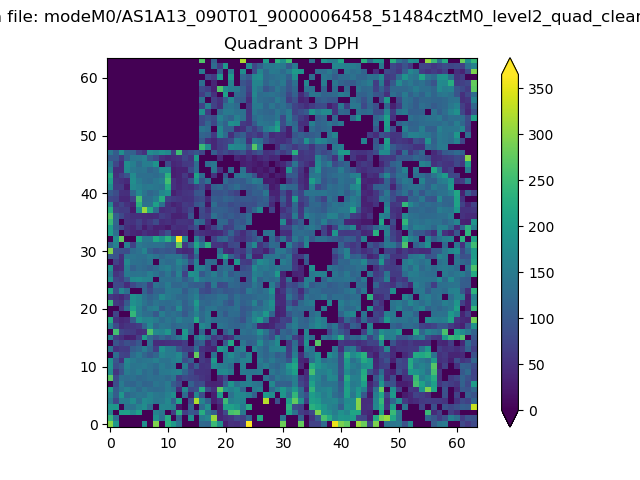 |
 |
Quadrant C |
| Plot type | Count rate plots | Images |
|---|---|---|
| Comparison with Poisson distribution Blue bars denote a histogram of data divided into 1 sec bins. Red curve is a Poisson curve with rate = median count rate of data. |
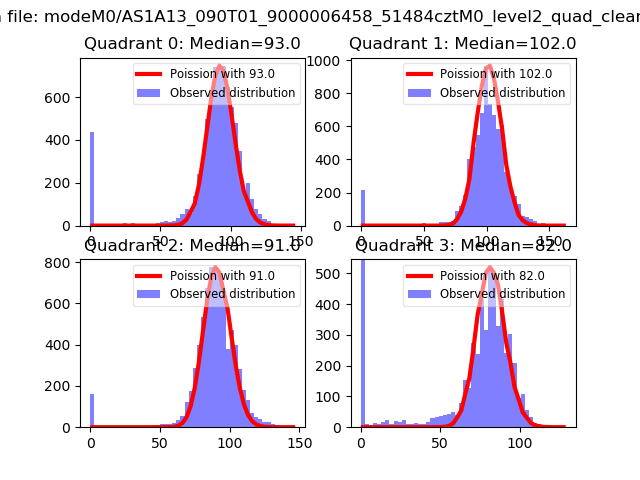 |
 |
| Quadrant-wise count rates Data is divided into 100 sec bins |
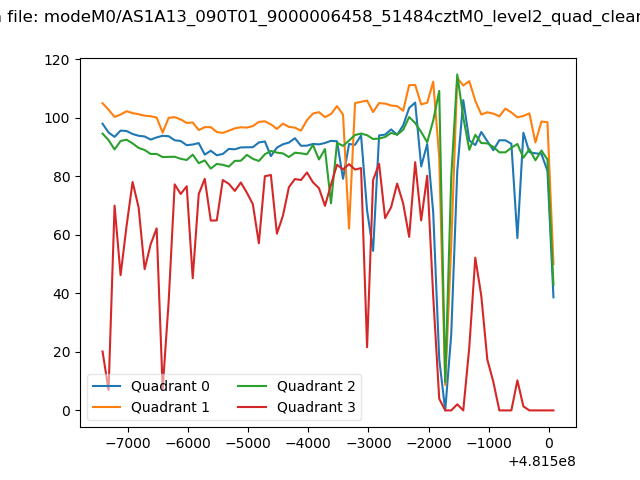 |
|
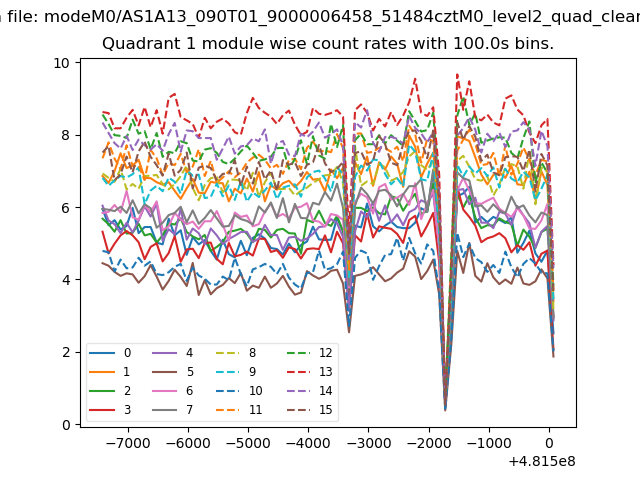
| Module-wise count rates for Quadrant A Data is divided into 100 sec bins |
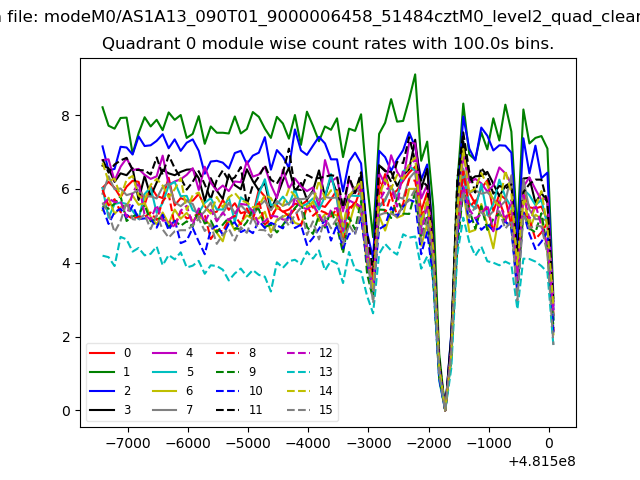 |
 |
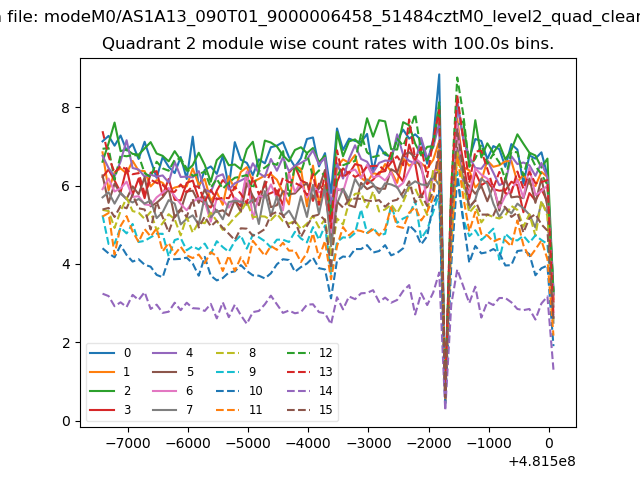
| Module-wise count rates for Quadrant B Data is divided into 100 sec bins |
 |
 |
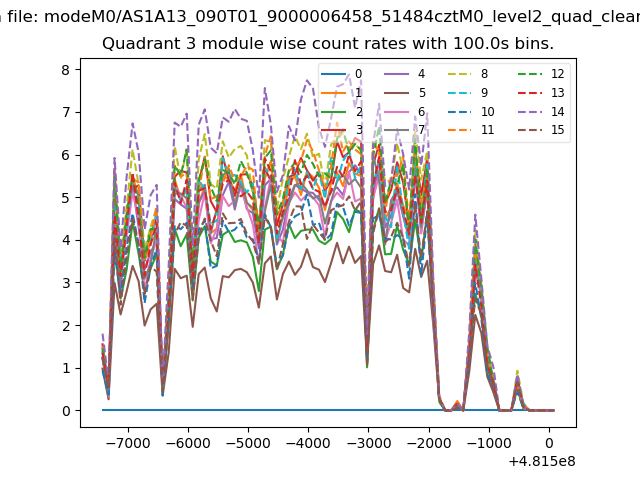
| Module-wise count rates for Quadrant C Data is divided into 100 sec bins |
 |
 |
| Module-wise count rates for Quadrant D Data is divided into 100 sec bins |
 |
 |
| Parameter | Plot |
|---|---|
| CZT HV Monitor |  |
| D_VDD | 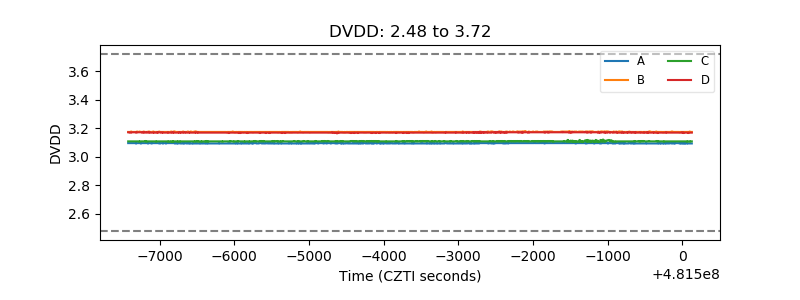 |
| Temperature 1 | 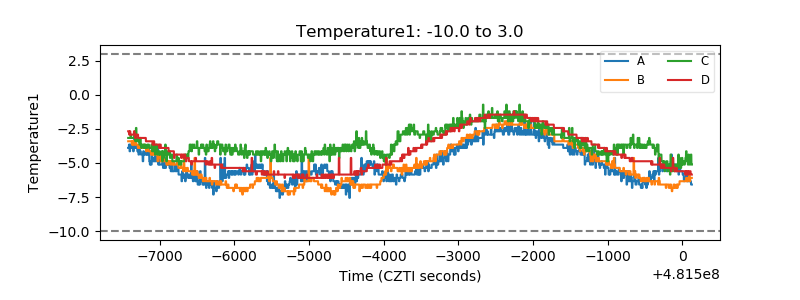 |
| Veto HV Monitor | 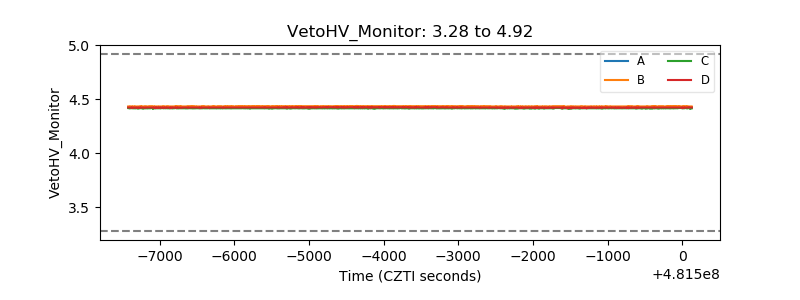 |
| Veto LLD | 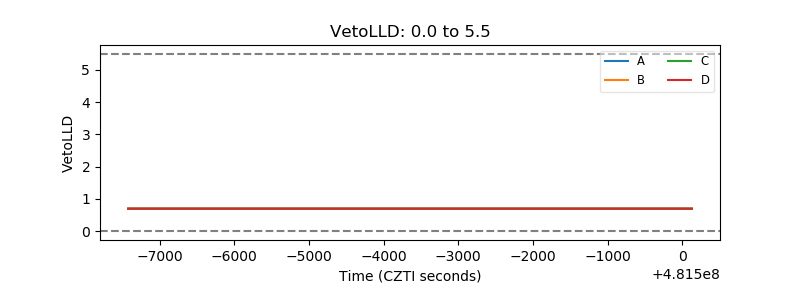 |
| Alpha Counter | 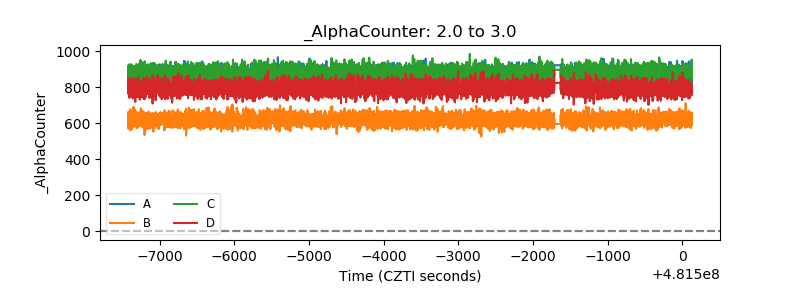 |
| _CPM_Rate | 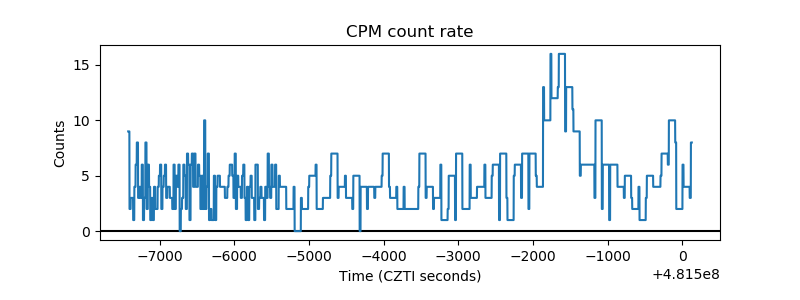 |
| CZT Counter | 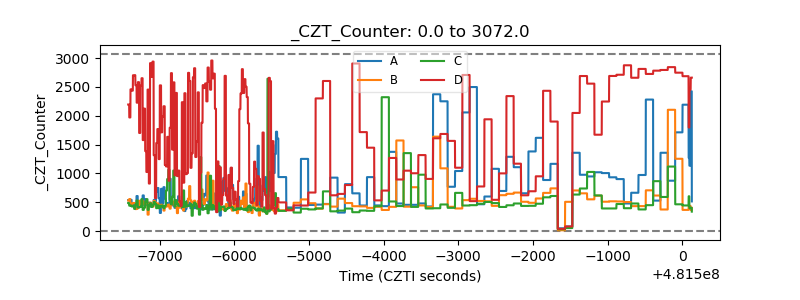 |
| +2.5 Volts monitor | 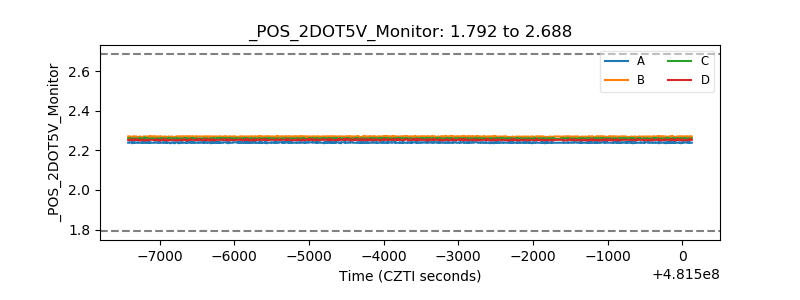 |
| +5 Volts monitor | 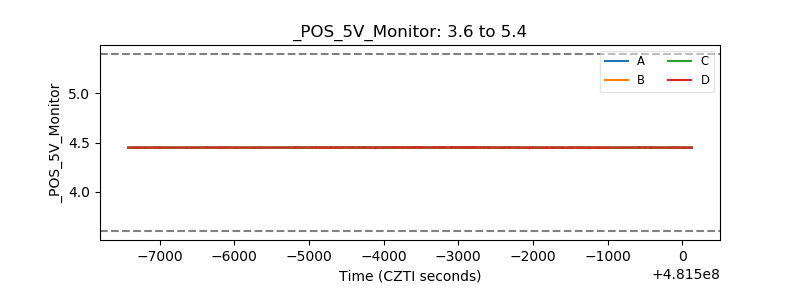 |
| _ROLL_ROT | 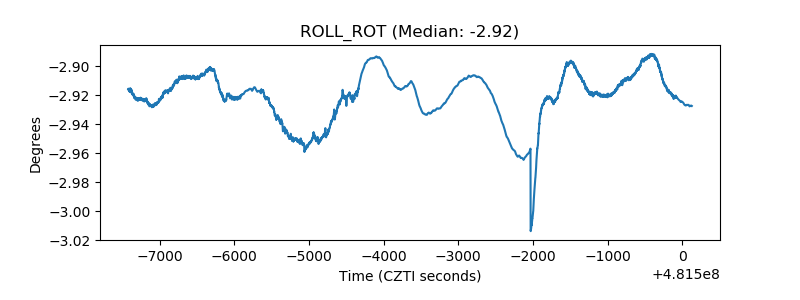 |
| _Roll_DEC | 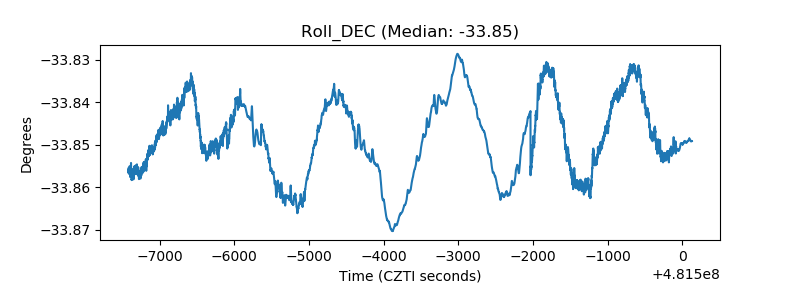 |
| _Roll_RA | 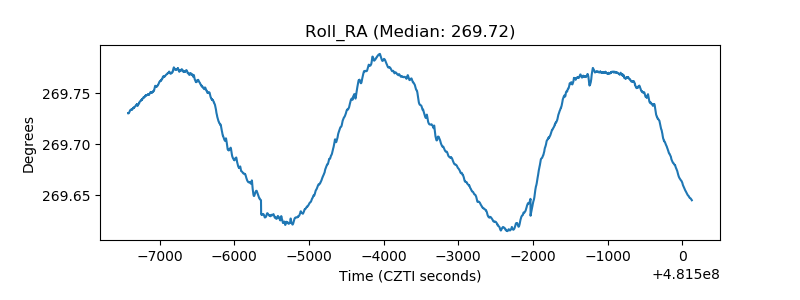 |
| Veto Counter | 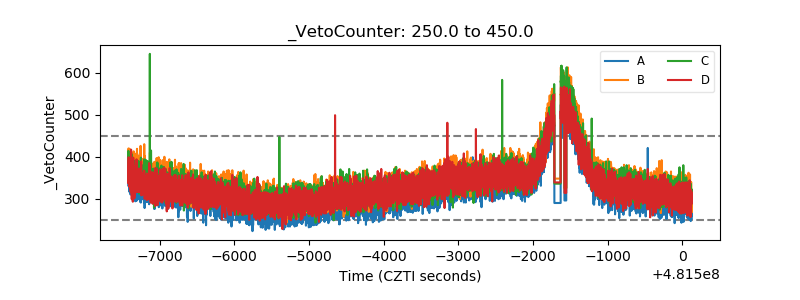 |