| Param | Original file | Final file |
|---|---|---|
| Filename | modeM0/AS1A13_090T01_9000006458_51485cztM0_level2.fits | modeM0/AS1A13_090T01_9000006458_51485cztM0_level2_quad_clean.evt |
| Size (bytes) | 936,434,880 | 101,113,920 |
| Size | 893.1 MB | 96.4 MB |
| Events in quadrant A | 10,944,101 | 647,845 |
| Events in quadrant B | 4,138,761 | 824,181 |
| Events in quadrant C | 4,670,761 | 716,389 |
| Events in quadrant D | 14,289,389 | 315,865 |
| Mode M0 | |||
|---|---|---|---|
| Quadrant | BADHDUFLAG | Total packets | Discarded packets |
| A | 0 | 38155 | 1 |
| B | 0 | 17933 | 1 |
| C | 0 | 19665 | 1 |
| D | 0 | 48111 | 1 |
| Mode M9 | |||
|---|---|---|---|
| Quadrant | BADHDUFLAG | Total packets | Discarded packets |
| A | 0 | 1 | 0 |
| B | 0 | 2 | 0 |
| C | 0 | 2 | 0 |
| D | 0 | 2 | 0 |
| Mode SS | |||
|---|---|---|---|
| Quadrant | BADHDUFLAG | Total packets | Discarded packets |
| A | 0 | 162 | 0 |
| B | 0 | 162 | 0 |
| C | 0 | 162 | 0 |
| D | 0 | 162 | 0 |
| Quadrant | Total seconds | Saturated seconds | Saturation percentage |
|---|---|---|---|
| A | 8021 | 1722 | 21.468645% |
| B | 8021 | 179 | 2.231642% |
| C | 8021 | 300 | 3.740182% |
| D | 8021 | 4483 | 55.890787% |
Noise dominated data is calculated using 1-second bins in cleaned event files. If a bin has >2000 counts, and if more than 50% of those come from <1% of pixels, then it is considered to be noise-dominated and hence unusable.
| Quadrant | # 1 sec bins | Bins with >0 counts | Bins with >2000 counts | High rate bins dominated by noise | Noise dominated (total time) | Noise dominated (detector-on time) | Marked lightcurve |
|---|---|---|---|---|---|---|---|
| A | 8046 | 8022 | 1248 | 1248 | 15.51% | 15.56% | 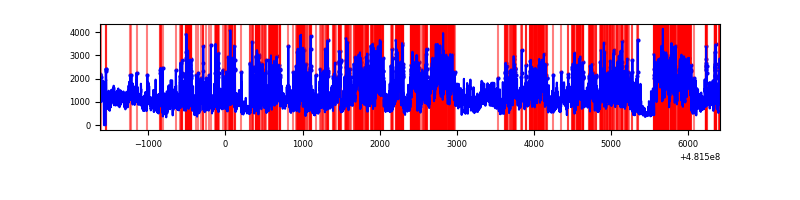 |
| B | 8046 | 8022 | 45 | 45 | 0.56% | 0.56% | 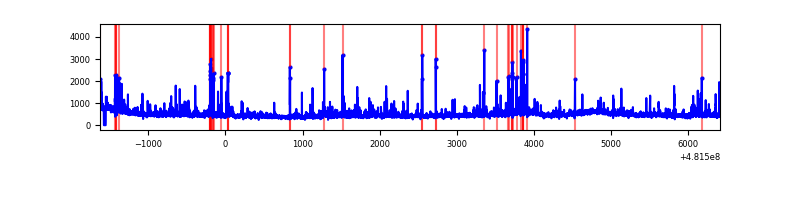 |
| C | 8046 | 8022 | 245 | 245 | 3.04% | 3.05% | 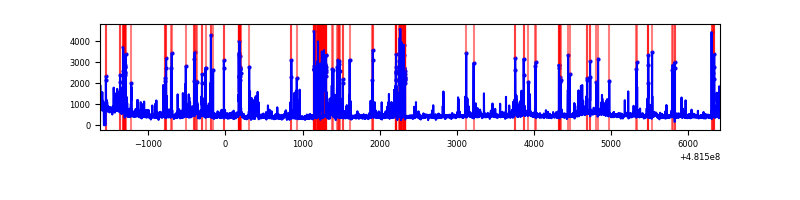 |
| D | 8045 | 8021 | 4203 | 4203 | 52.24% | 52.40% | 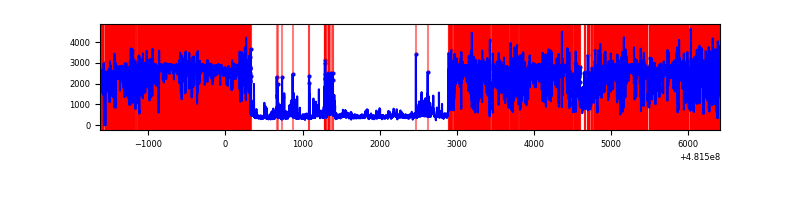 |
Top three noisy pixels from each quadrant. If the there are fewer than three noisy pixels in the level2.evt file, extra rows are filled as -1
| Pixel properties | Quadrant properties | ||||||
|---|---|---|---|---|---|---|---|
| Quadrant | DetID | PixID | Counts | Sigma | Mean | Median | Sigma |
| A | 12 | 3 | 3016182 | 14832.17 | 820 | 799 | 203.3 |
| A | 12 | 250 | 1432179 | 7040.72 | 820 | 799 | 203.3 |
| A | 7 | 64 | 1204520 | 5920.9 | 820 | 799 | 203.3 |
| B | 7 | 252 | 127937 | 676.66 | 873 | 841 | 187.8 |
| B | 8 | 128 | 91134 | 480.72 | 873 | 841 | 187.8 |
| B | 12 | 32 | 76536 | 403.0 | 873 | 841 | 187.8 |
| C | 13 | 3 | 633067 | 2717.55 | 845 | 835 | 232.6 |
| C | 1 | 60 | 288700 | 1237.34 | 845 | 835 | 232.6 |
| C | 12 | 249 | 162632 | 695.46 | 845 | 835 | 232.6 |
| D | 8 | 176 | 9884609 | 60182.84 | 581 | 561 | 164.2 |
| D | 3 | 12 | 1210294 | 7365.93 | 581 | 561 | 164.2 |
| D | 11 | 176 | 298761 | 1815.71 | 581 | 561 | 164.2 |
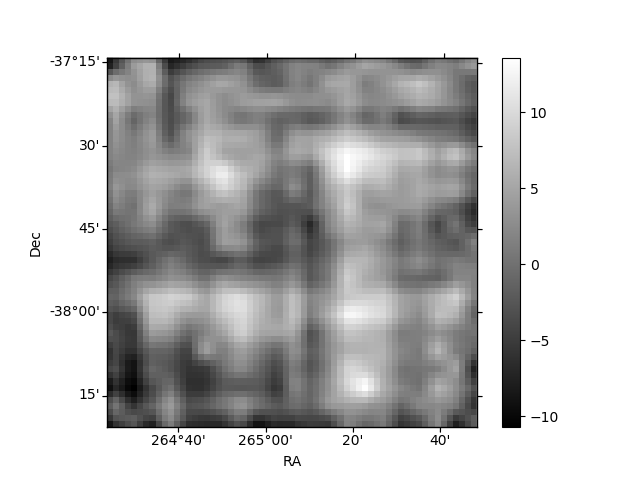
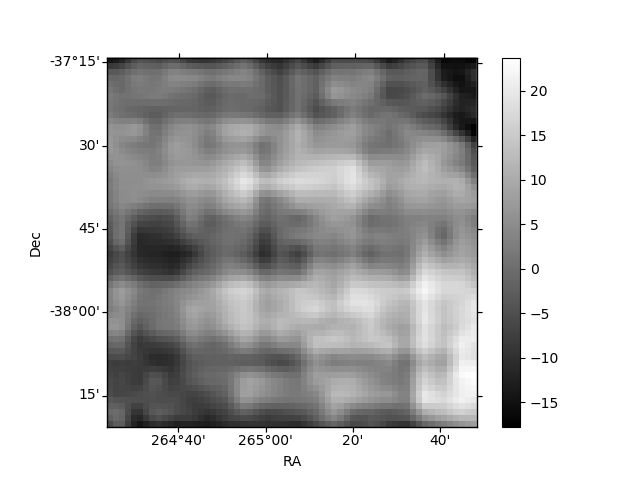
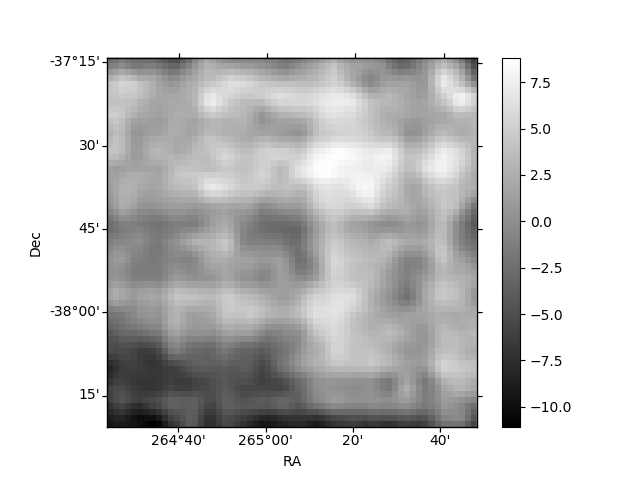
Histogram calculated using DETX and DETY for each event in the final _common_clean file
| Quadrant A | 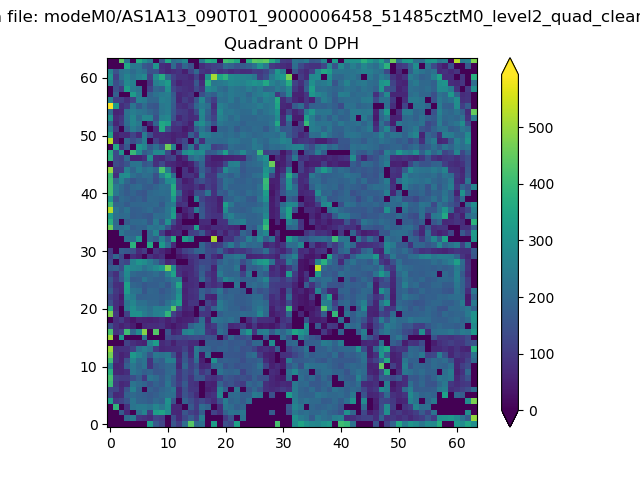 |
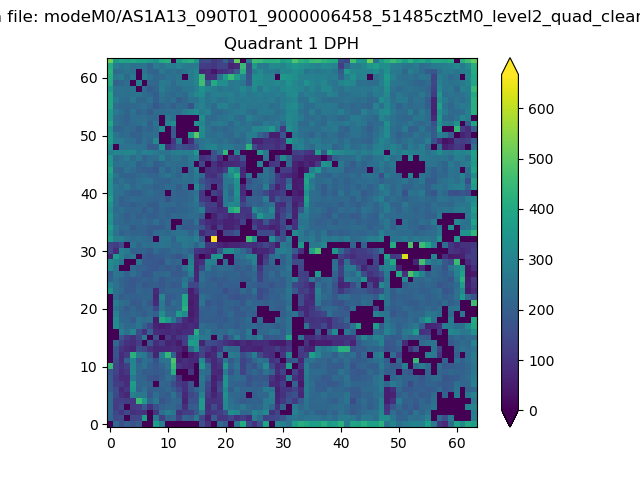 |
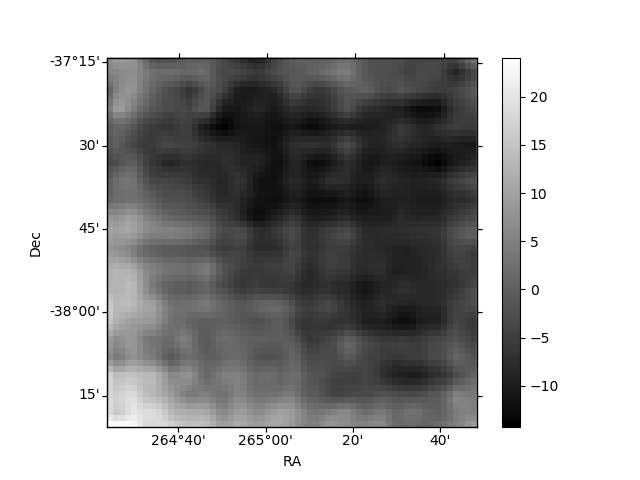
Quadrant B |
|---|---|---|---|
| Quadrant D | 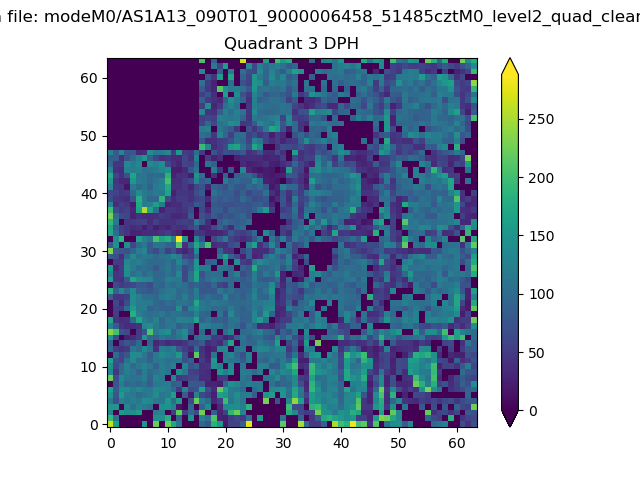 |
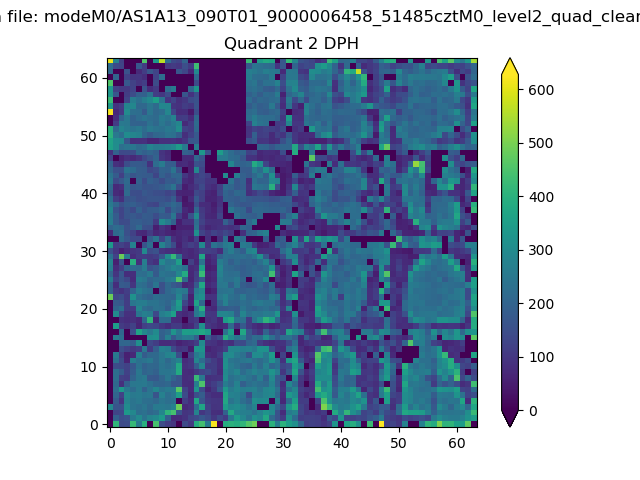 |
Quadrant C |
| Plot type | Count rate plots | Images |
|---|---|---|
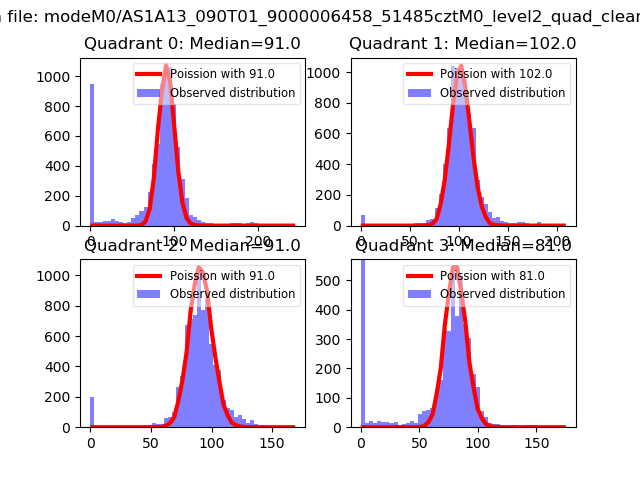
| Comparison with Poisson distribution Blue bars denote a histogram of data divided into 1 sec bins. Red curve is a Poisson curve with rate = median count rate of data. |
 |
 |
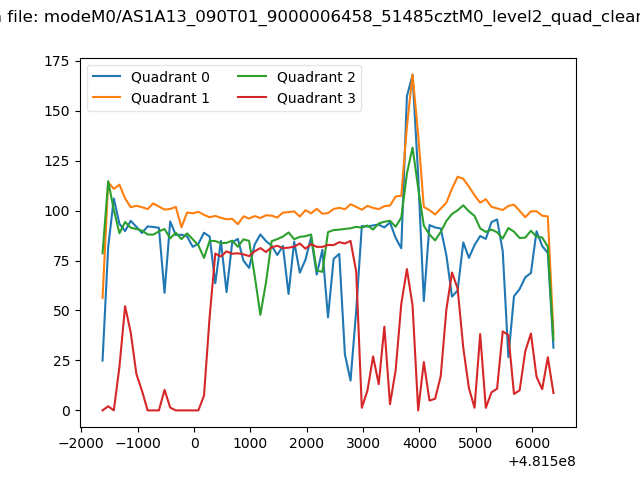
| Quadrant-wise count rates Data is divided into 100 sec bins |
 |
|
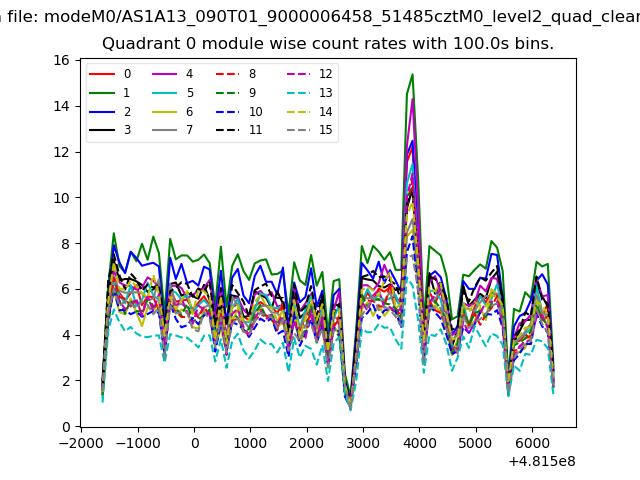
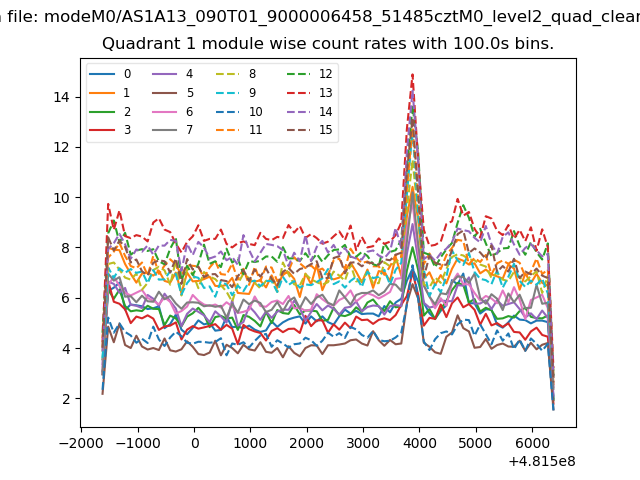
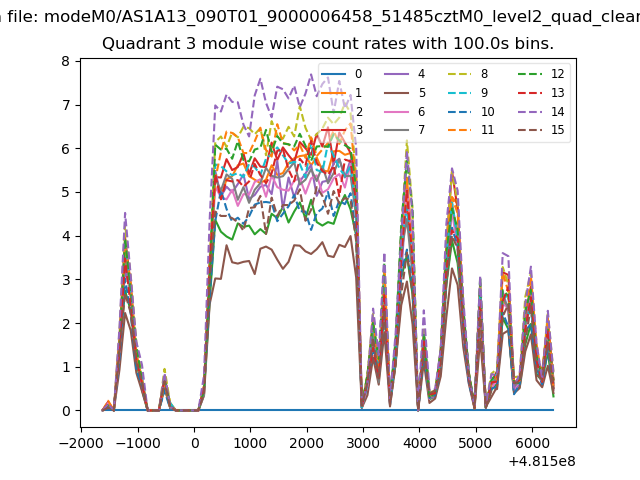
| Module-wise count rates for Quadrant A Data is divided into 100 sec bins |
 |
 |
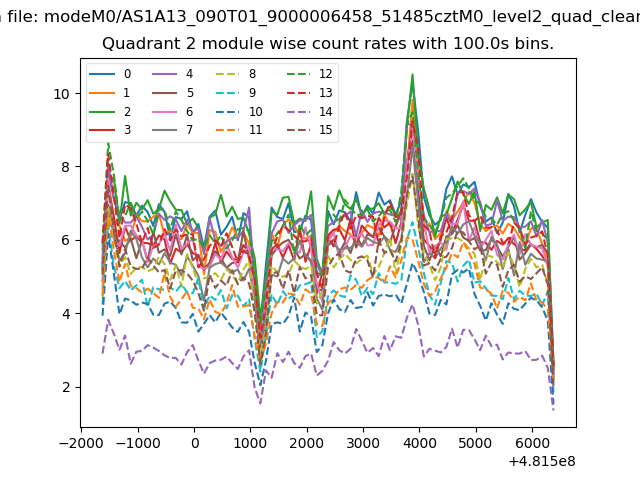
| Module-wise count rates for Quadrant B Data is divided into 100 sec bins |
 |
 |
| Module-wise count rates for Quadrant C Data is divided into 100 sec bins |
 |
 |
| Module-wise count rates for Quadrant D Data is divided into 100 sec bins |
 |
 |
| Parameter | Plot |
|---|---|
| CZT HV Monitor | 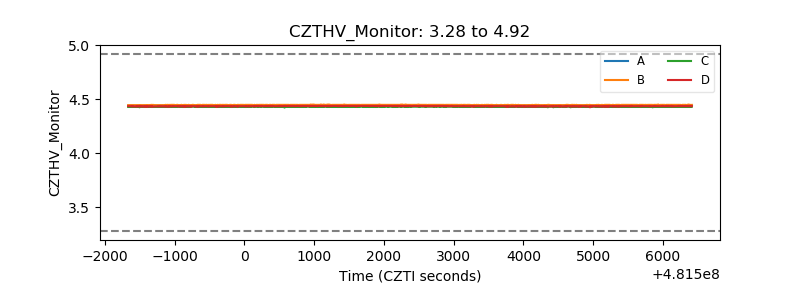 |
| D_VDD | 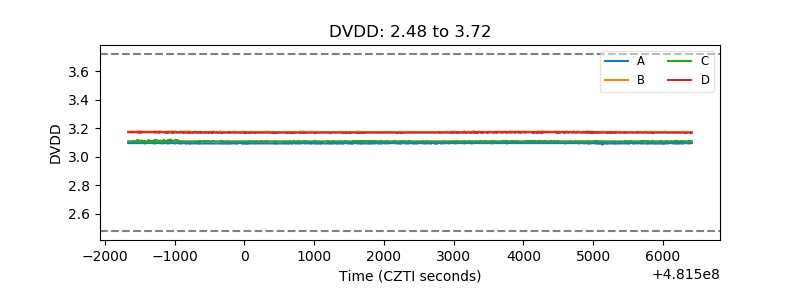 |
| Temperature 1 | 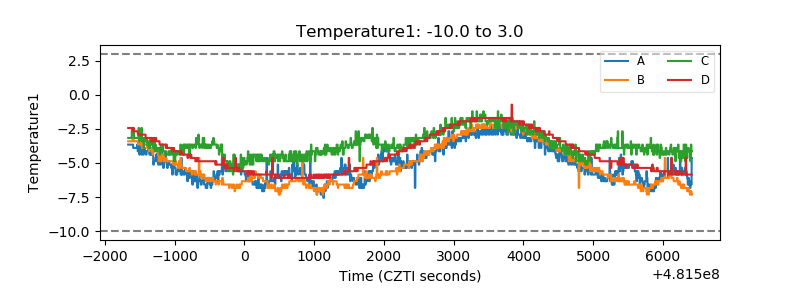 |
| Veto HV Monitor | 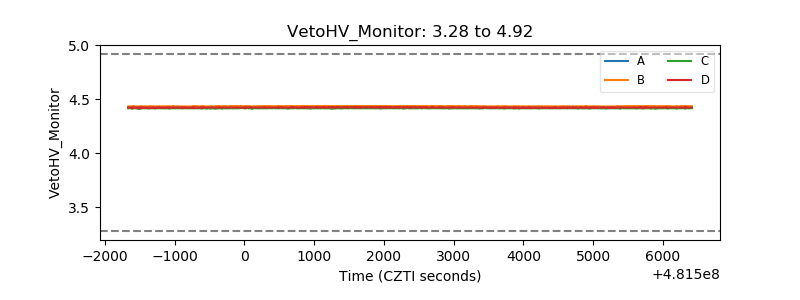 |
| Veto LLD | 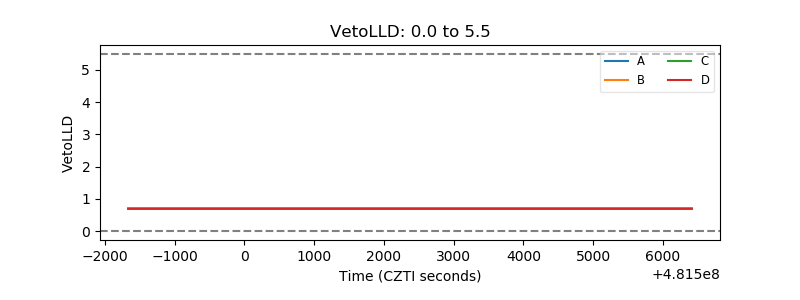 |
| Alpha Counter | 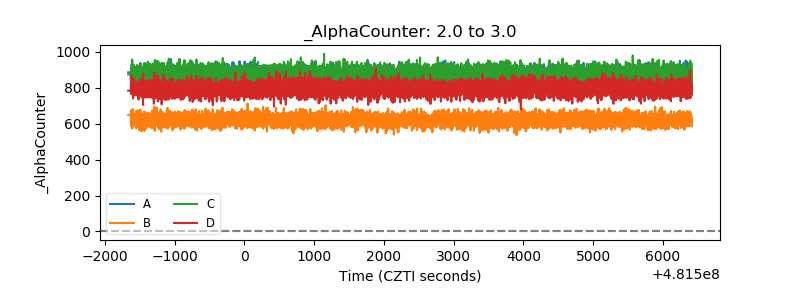 |
| _CPM_Rate | 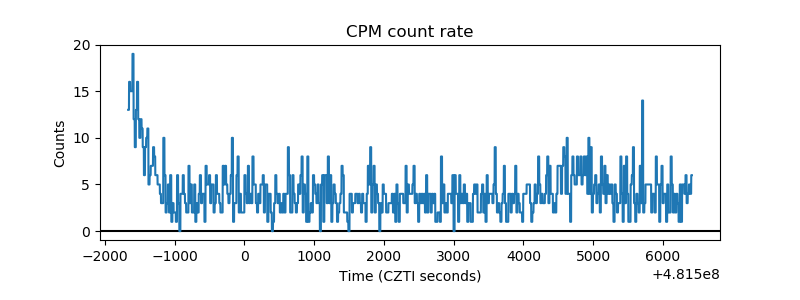 |
| CZT Counter | 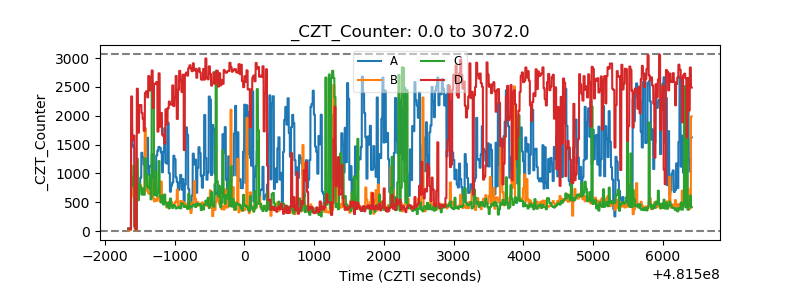 |
| +2.5 Volts monitor | 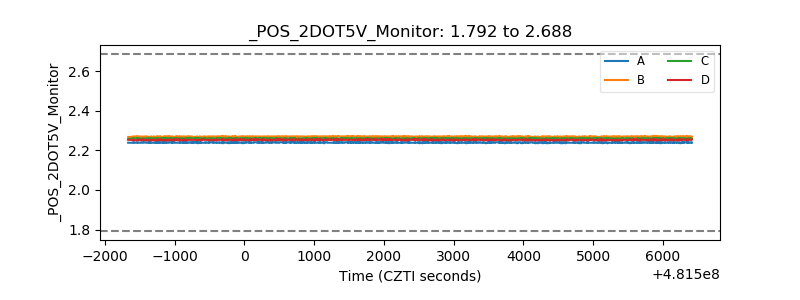 |
| +5 Volts monitor | 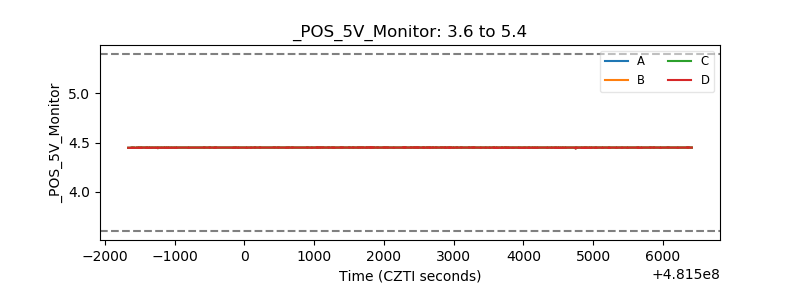 |
| _ROLL_ROT | 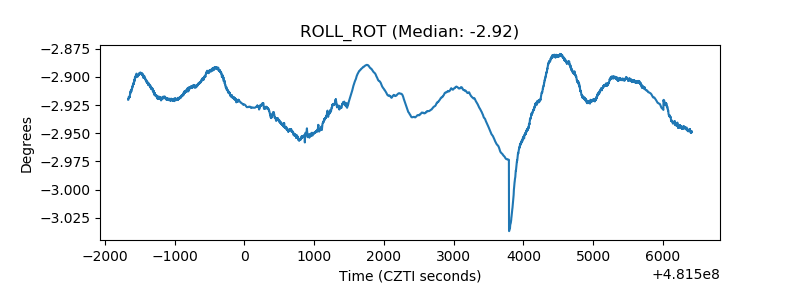 |
| _Roll_DEC | 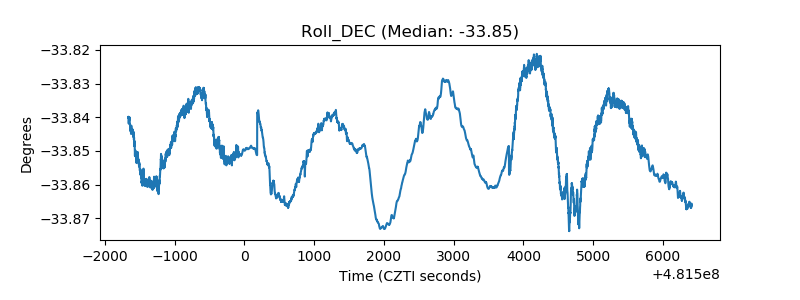 |
| _Roll_RA | 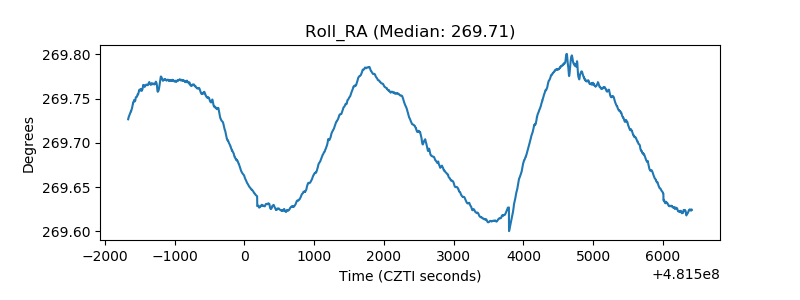 |
| Veto Counter | 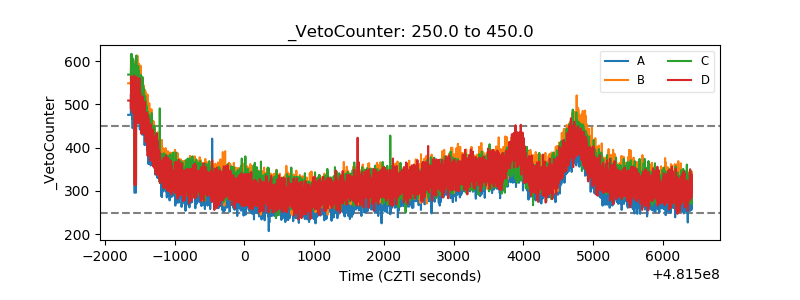 |