| Param | Original file | Final file |
|---|---|---|
| Filename | modeM0/AS1A13_090T01_9000006458_51490cztM0_level2.fits | modeM0/AS1A13_090T01_9000006458_51490cztM0_level2_quad_clean.evt |
| Size (bytes) | 1,134,573,120 | 115,200,000 |
| Size | 1.1 GB | 109.9 MB |
| Events in quadrant A | 12,347,711 | 698,511 |
| Events in quadrant B | 7,262,992 | 853,802 |
| Events in quadrant C | 8,356,394 | 744,818 |
| Events in quadrant D | 13,304,946 | 537,509 |
| Mode M0 | |||
|---|---|---|---|
| Quadrant | BADHDUFLAG | Total packets | Discarded packets |
| A | 0 | 43316 | 0 |
| B | 0 | 28364 | 0 |
| C | 0 | 31497 | 0 |
| D | 0 | 46155 | 0 |
| Mode SS | |||
|---|---|---|---|
| Quadrant | BADHDUFLAG | Total packets | Discarded packets |
| A | 0 | 188 | 0 |
| B | 0 | 188 | 0 |
| C | 0 | 188 | 0 |
| D | 0 | 188 | 0 |
| Quadrant | Total seconds | Saturated seconds | Saturation percentage |
|---|---|---|---|
| A | 9412 | 2064 | 21.929452% |
| B | 9412 | 1070 | 11.368466% |
| C | 9412 | 1282 | 13.620909% |
| D | 9412 | 3075 | 32.671058% |
Noise dominated data is calculated using 1-second bins in cleaned event files. If a bin has >2000 counts, and if more than 50% of those come from <1% of pixels, then it is considered to be noise-dominated and hence unusable.
| Quadrant | # 1 sec bins | Bins with >0 counts | Bins with >2000 counts | High rate bins dominated by noise | Noise dominated (total time) | Noise dominated (detector-on time) | Marked lightcurve |
|---|---|---|---|---|---|---|---|
| A | 9412 | 9412 | 1594 | 1594 | 16.94% | 16.94% | 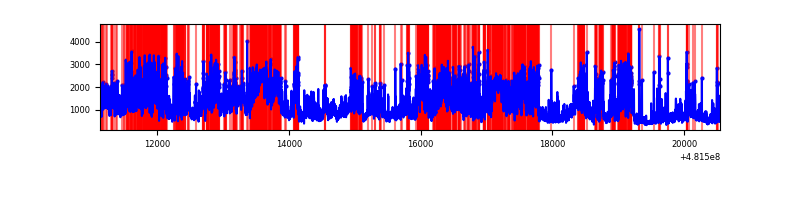 |
| B | 9412 | 9412 | 687 | 687 | 7.30% | 7.30% | 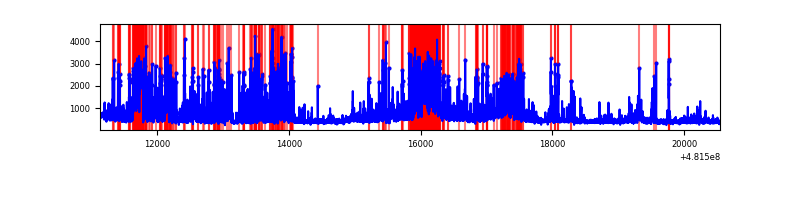 |
| C | 9412 | 9412 | 1169 | 1169 | 12.42% | 12.42% | 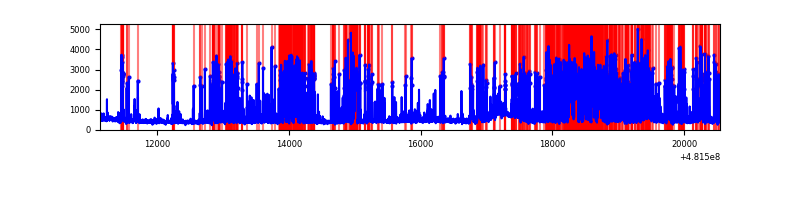 |
| D | 9412 | 9412 | 2905 | 2905 | 30.86% | 30.86% | 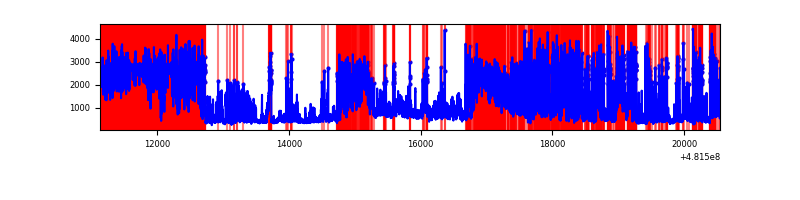 |
Top three noisy pixels from each quadrant. If the there are fewer than three noisy pixels in the level2.evt file, extra rows are filled as -1
| Pixel properties | Quadrant properties | ||||||
|---|---|---|---|---|---|---|---|
| Quadrant | DetID | PixID | Counts | Sigma | Mean | Median | Sigma |
| A | 12 | 250 | 3593320 | 16151.09 | 907 | 888 | 222.4 |
| A | 12 | 3 | 2625258 | 11798.81 | 907 | 888 | 222.4 |
| A | 15 | 174 | 934493 | 4197.36 | 907 | 888 | 222.4 |
| B | 2 | 208 | 1617392 | 7980.51 | 943 | 911 | 202.6 |
| B | 12 | 32 | 1275313 | 6291.68 | 943 | 911 | 202.6 |
| B | 5 | 185 | 104147 | 509.67 | 943 | 911 | 202.6 |
| C | 0 | 177 | 3426379 | 13505.46 | 926 | 920 | 253.6 |
| C | 13 | 3 | 641404 | 2525.22 | 926 | 920 | 253.6 |
| C | 15 | 205 | 321508 | 1263.97 | 926 | 920 | 253.6 |
| D | 8 | 176 | 7754223 | 33543.58 | 827 | 797 | 231.1 |
| D | 7 | 60 | 1004359 | 4341.7 | 827 | 797 | 231.1 |
| D | 2 | 249 | 202661 | 873.32 | 827 | 797 | 231.1 |
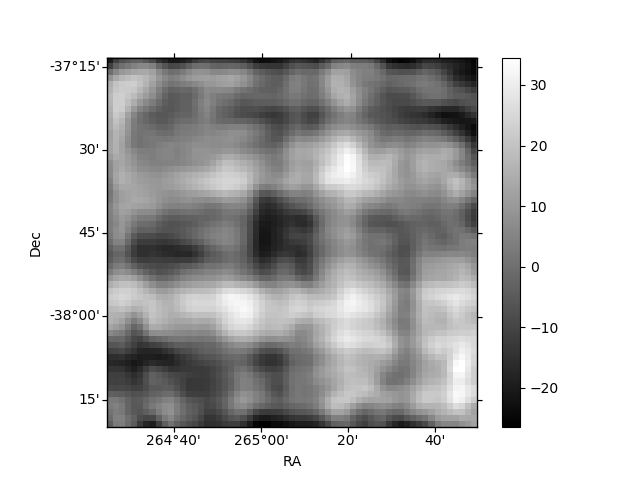
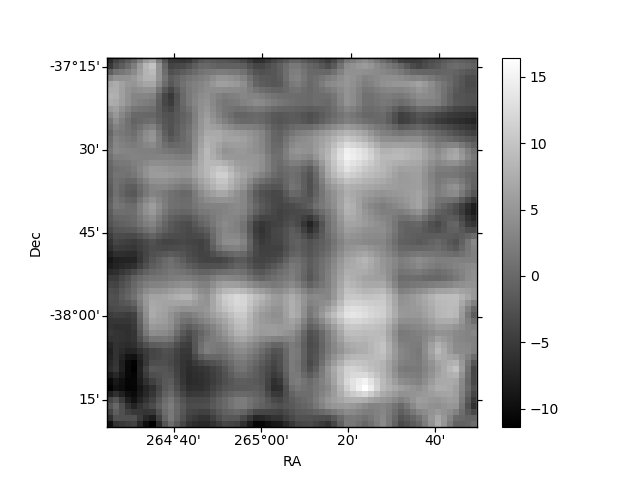
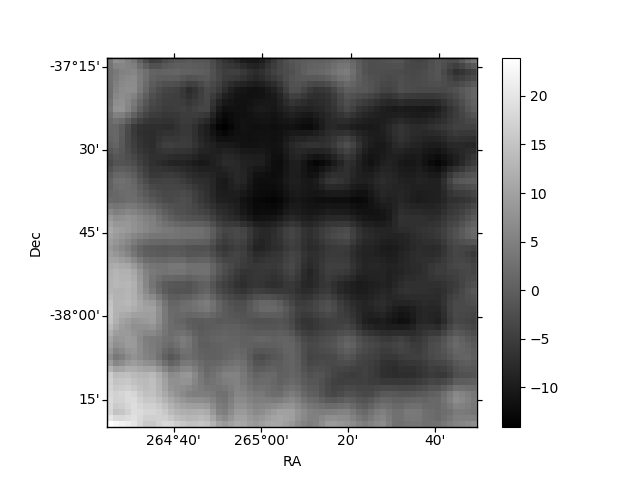
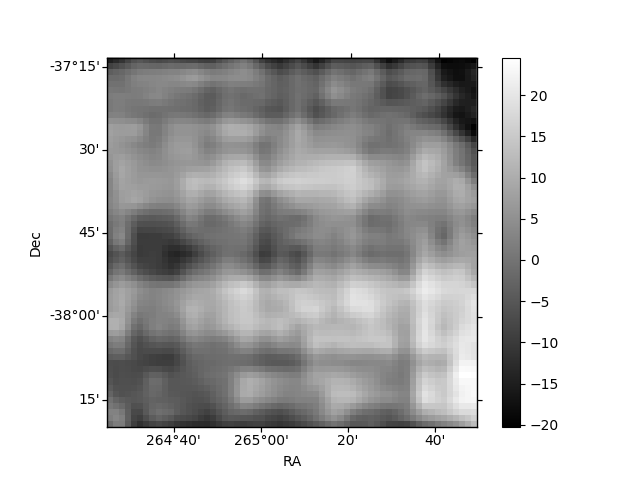
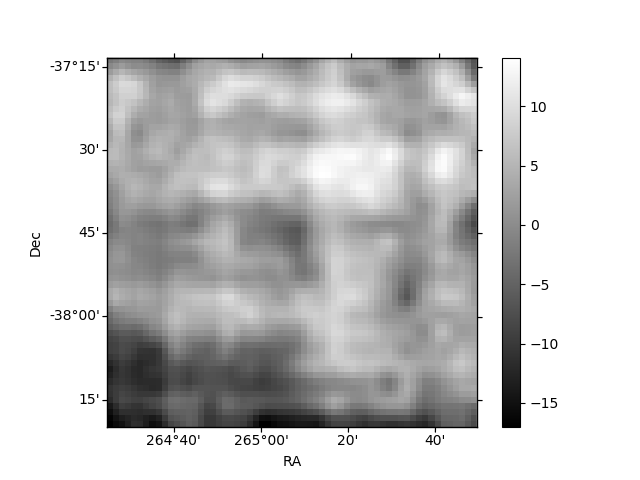
Histogram calculated using DETX and DETY for each event in the final _common_clean file
| Quadrant A | 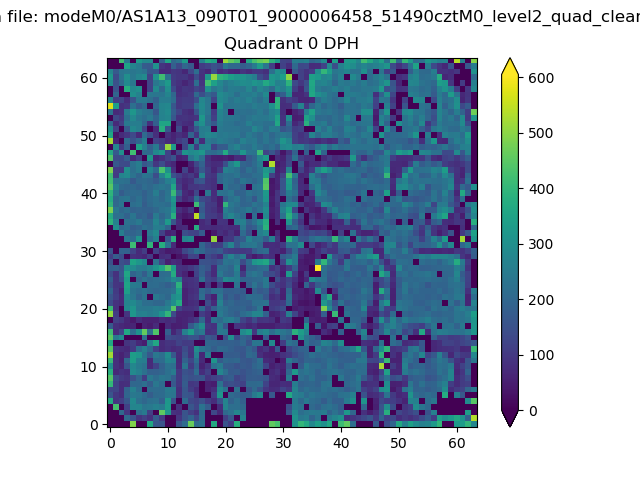 |
 |
Quadrant B |
|---|---|---|---|
| Quadrant D | 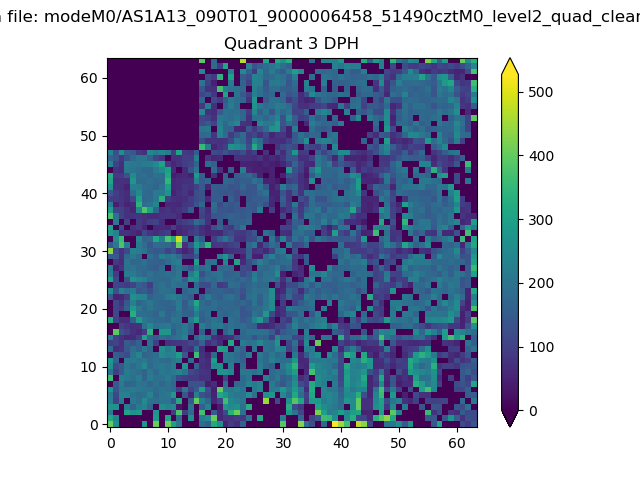 |
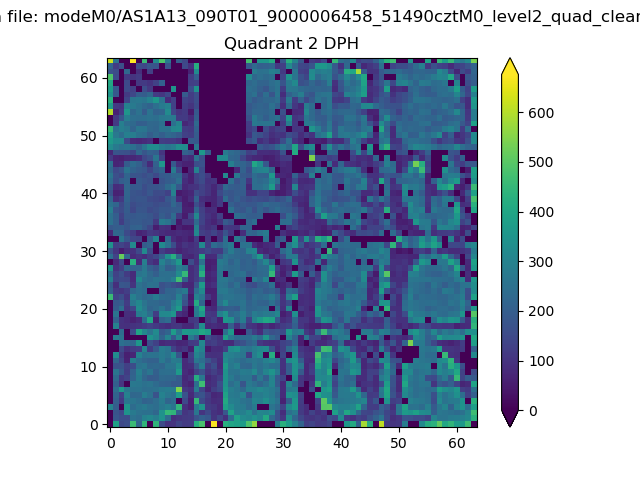 |
Quadrant C |
| Plot type | Count rate plots | Images |
|---|---|---|
| Comparison with Poisson distribution Blue bars denote a histogram of data divided into 1 sec bins. Red curve is a Poisson curve with rate = median count rate of data. |
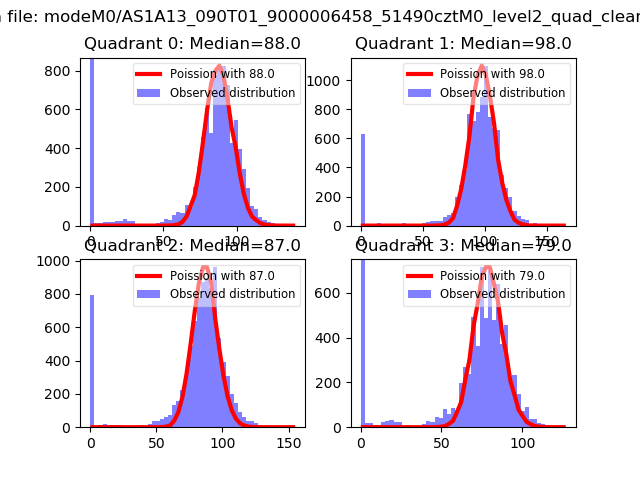 |
 |
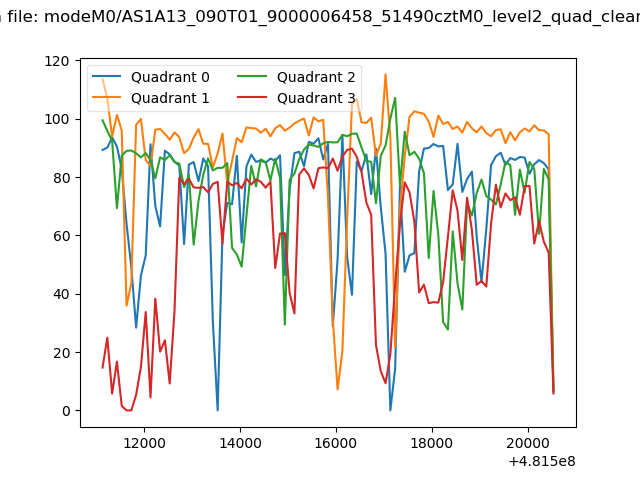
| Quadrant-wise count rates Data is divided into 100 sec bins |
 |
|
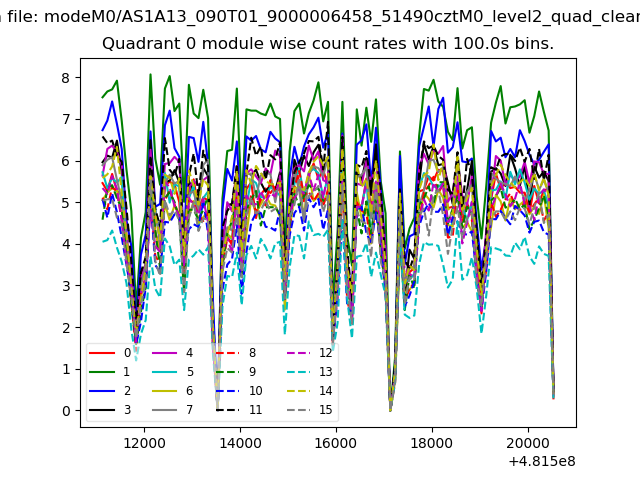
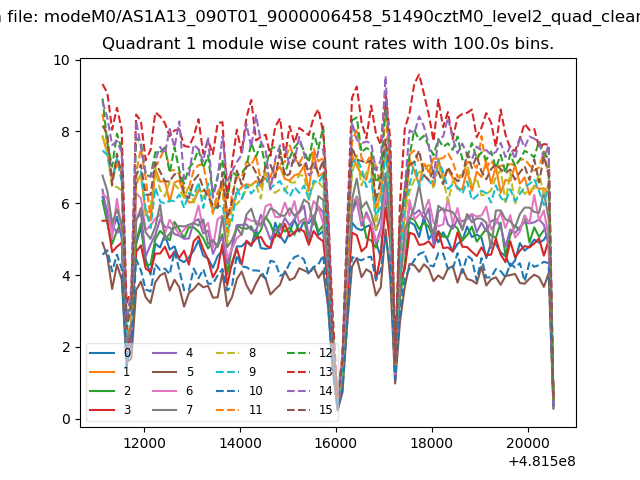
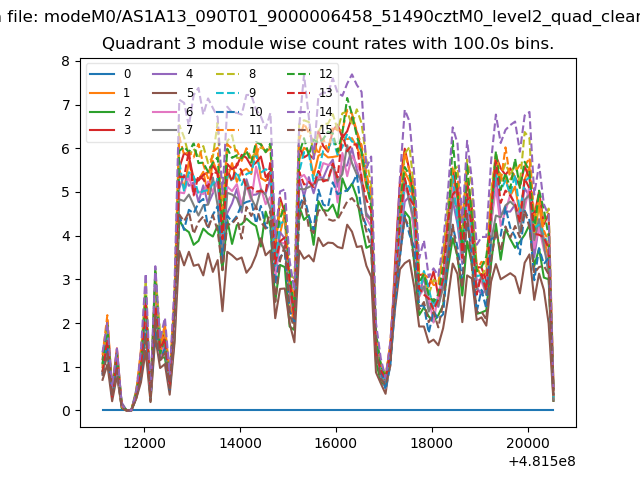
| Module-wise count rates for Quadrant A Data is divided into 100 sec bins |
 |
 |
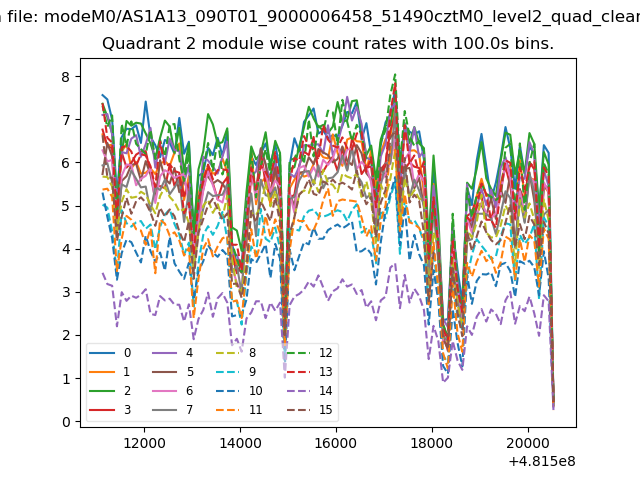
| Module-wise count rates for Quadrant B Data is divided into 100 sec bins |
 |
 |
| Module-wise count rates for Quadrant C Data is divided into 100 sec bins |
 |
 |
| Module-wise count rates for Quadrant D Data is divided into 100 sec bins |
 |
 |
| Parameter | Plot |
|---|---|
| CZT HV Monitor | 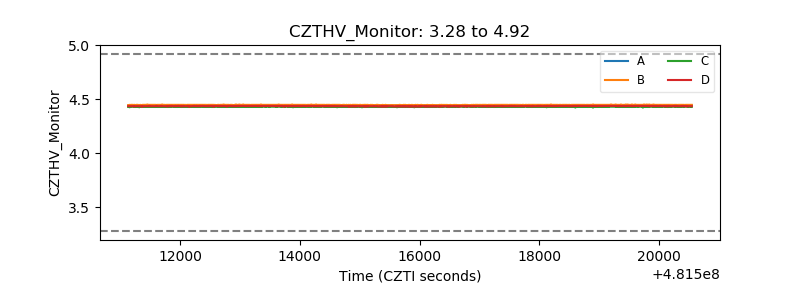 |
| D_VDD | 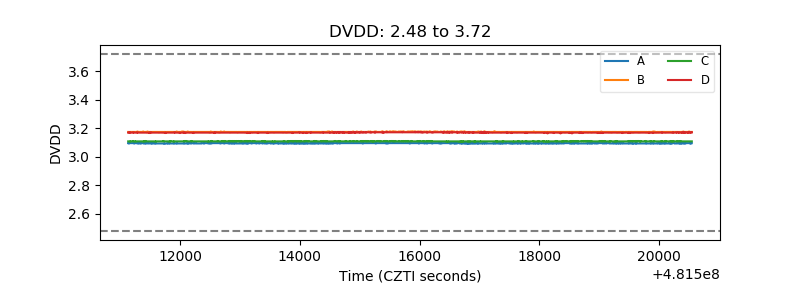 |
| Temperature 1 | 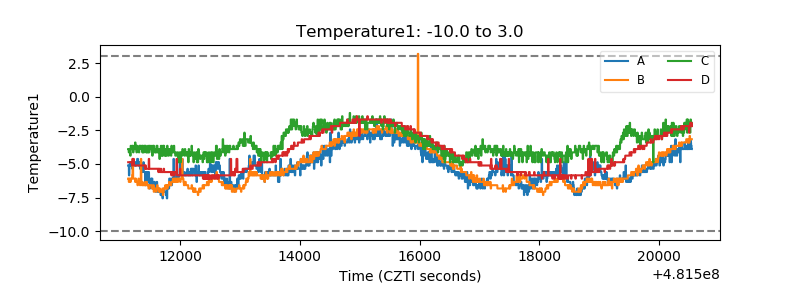 |
| Veto HV Monitor | 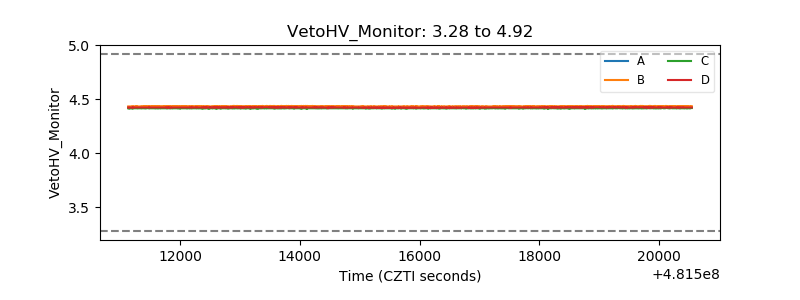 |
| Veto LLD | 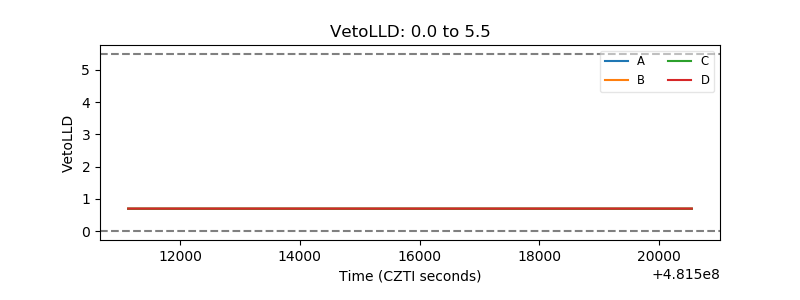 |
| Alpha Counter | 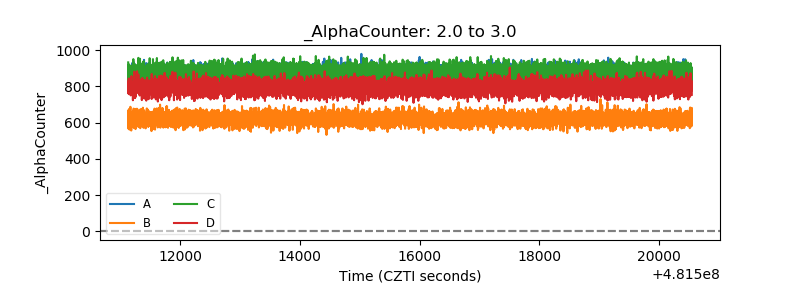 |
| _CPM_Rate | 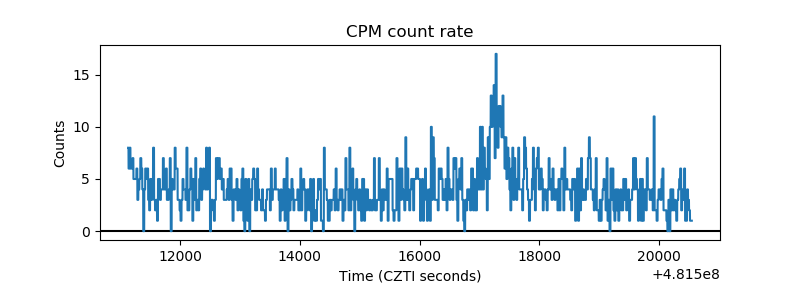 |
| CZT Counter | 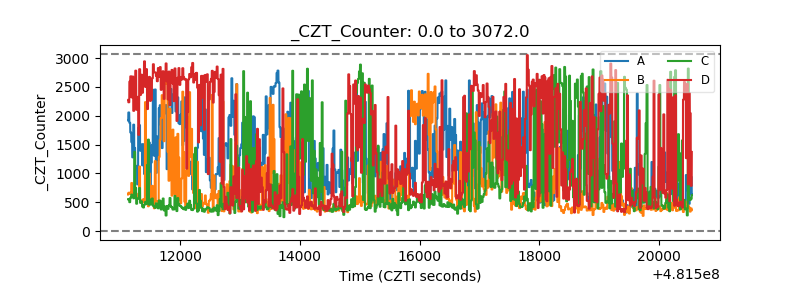 |
| +2.5 Volts monitor | 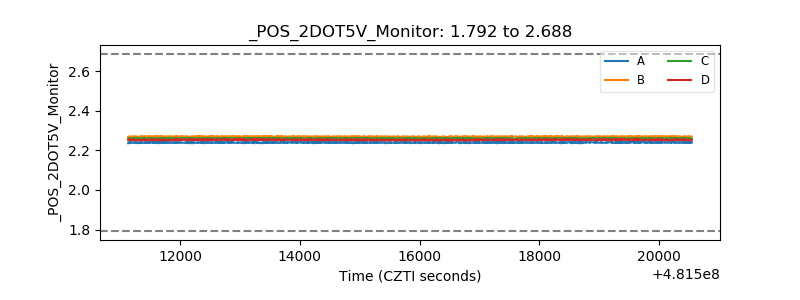 |
| +5 Volts monitor | 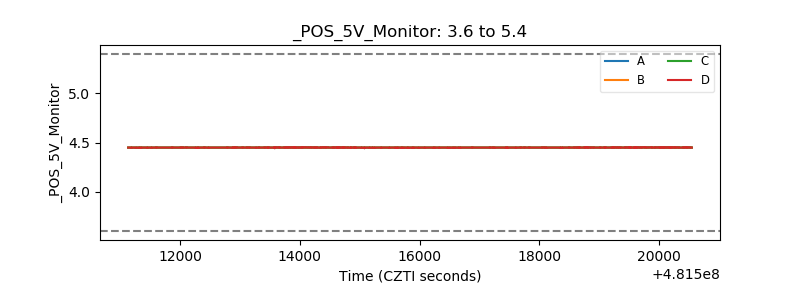 |
| _ROLL_ROT | 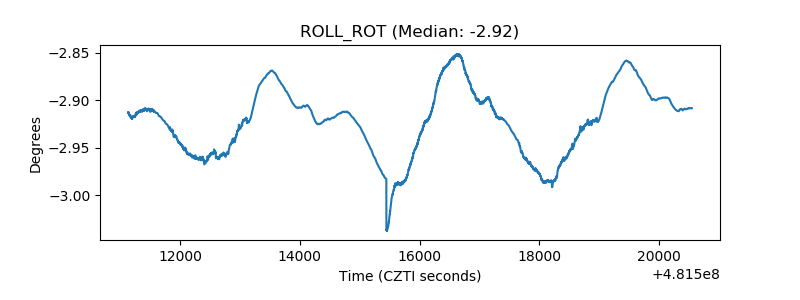 |
| _Roll_DEC | 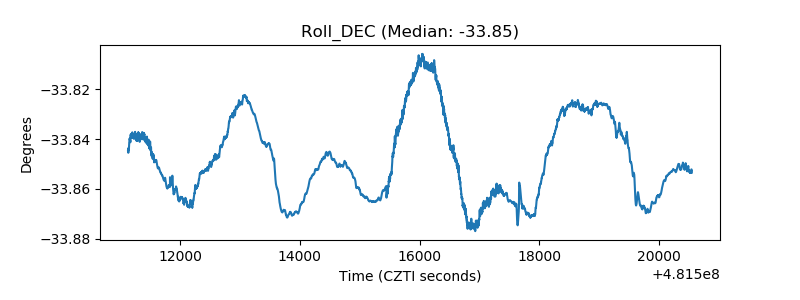 |
| _Roll_RA | 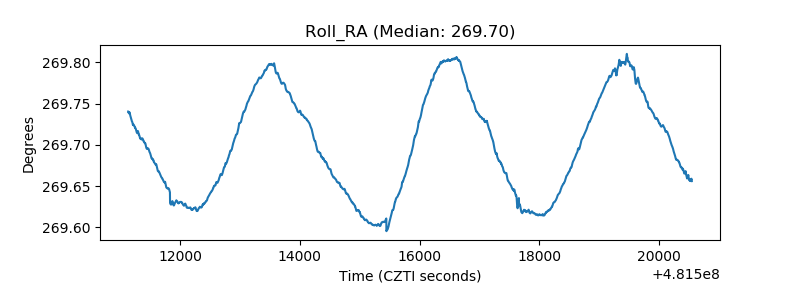 |
| Veto Counter | 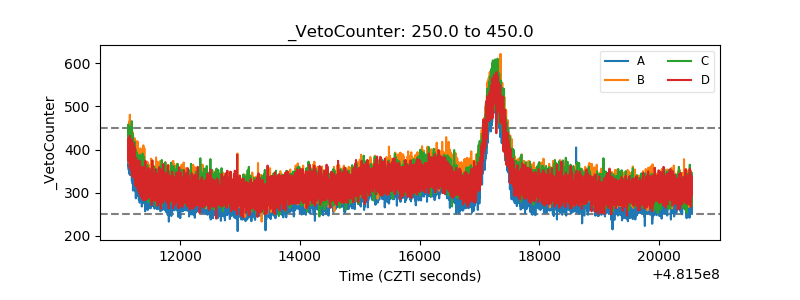 |