| Param | Original file | Final file |
|---|---|---|
| Filename | modeM0/AS1A13_090T01_9000006458_51492cztM0_level2.fits | modeM0/AS1A13_090T01_9000006458_51492cztM0_level2_quad_clean.evt |
| Size (bytes) | 2,102,987,520 | 284,466,240 |
| Size | 2.0 GB | 271.3 MB |
| Events in quadrant A | 25,589,278 | 1,662,823 |
| Events in quadrant B | 11,377,818 | 2,161,828 |
| Events in quadrant C | 11,781,463 | 1,923,883 |
| Events in quadrant D | 27,426,644 | 1,371,759 |
| Mode M0 | |||
|---|---|---|---|
| Quadrant | BADHDUFLAG | Total packets | Discarded packets |
| A | 0 | 91263 | 4 |
| B | 0 | 49218 | 4 |
| C | 0 | 50696 | 4 |
| D | 0 | 96851 | 4 |
| Mode M9 | |||
|---|---|---|---|
| Quadrant | BADHDUFLAG | Total packets | Discarded packets |
| A | 0 | 28 | 0 |
| B | 0 | 28 | 0 |
| C | 0 | 28 | 0 |
| D | 0 | 28 | 0 |
| Mode SS | |||
|---|---|---|---|
| Quadrant | BADHDUFLAG | Total packets | Discarded packets |
| A | 0 | 438 | 0 |
| B | 0 | 438 | 0 |
| C | 0 | 438 | 0 |
| D | 0 | 438 | 0 |
| Quadrant | Total seconds | Saturated seconds | Saturation percentage |
|---|---|---|---|
| A | 21678 | 3486 | 16.080819% |
| B | 21678 | 513 | 2.366454% |
| C | 21679 | 577 | 2.661562% |
| D | 21679 | 4607 | 21.250980% |
Noise dominated data is calculated using 1-second bins in cleaned event files. If a bin has >2000 counts, and if more than 50% of those come from <1% of pixels, then it is considered to be noise-dominated and hence unusable.
| Quadrant | # 1 sec bins | Bins with >0 counts | Bins with >2000 counts | High rate bins dominated by noise | Noise dominated (total time) | Noise dominated (detector-on time) | Marked lightcurve |
|---|---|---|---|---|---|---|---|
| A | 24269 | 21677 | 2643 | 2643 | 10.89% | 12.19% | 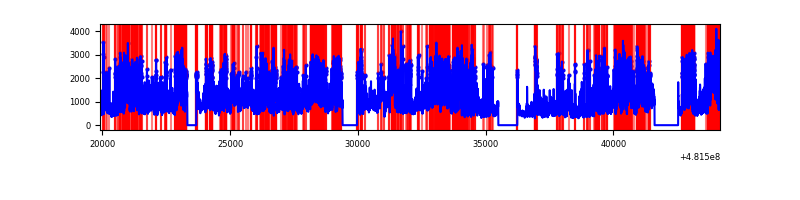 |
| B | 24270 | 21679 | 168 | 168 | 0.69% | 0.77% | 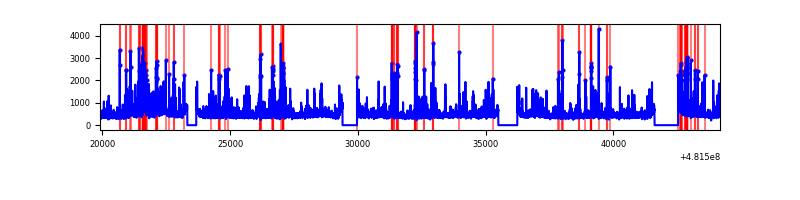 |
| C | 24271 | 21679 | 335 | 335 | 1.38% | 1.55% | 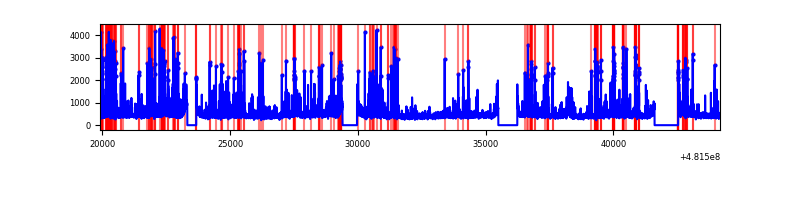 |
| D | 24271 | 21679 | 4573 | 4573 | 18.84% | 21.09% | 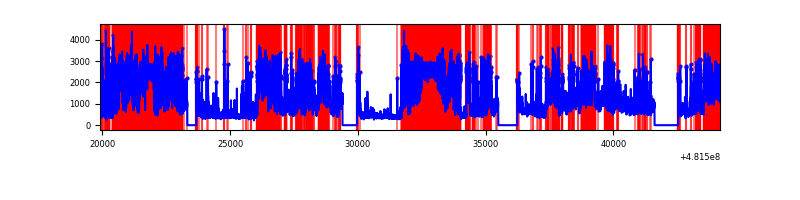 |
Top three noisy pixels from each quadrant. If the there are fewer than three noisy pixels in the level2.evt file, extra rows are filled as -1
| Pixel properties | Quadrant properties | ||||||
|---|---|---|---|---|---|---|---|
| Quadrant | DetID | PixID | Counts | Sigma | Mean | Median | Sigma |
| A | 12 | 3 | 7080690 | 13049.94 | 2211 | 2153 | 542.4 |
| A | 12 | 250 | 3904609 | 7194.54 | 2211 | 2153 | 542.4 |
| A | 8 | 43 | 1152367 | 2120.52 | 2211 | 2153 | 542.4 |
| B | 0 | 213 | 341328 | 694.49 | 2300 | 2217 | 488.3 |
| B | 2 | 208 | 254449 | 516.56 | 2300 | 2217 | 488.3 |
| B | 0 | 171 | 215171 | 436.12 | 2300 | 2217 | 488.3 |
| C | 0 | 177 | 848033 | 1358.05 | 2274 | 2253 | 622.8 |
| C | 13 | 3 | 750906 | 1202.1 | 2274 | 2253 | 622.8 |
| C | 14 | 245 | 252429 | 401.7 | 2274 | 2253 | 622.8 |
| D | 8 | 176 | 13890061 | 23855.22 | 2099 | 2025 | 582.2 |
| D | 2 | 216 | 1496748 | 2567.46 | 2099 | 2025 | 582.2 |
| D | 7 | 60 | 1073558 | 1840.55 | 2099 | 2025 | 582.2 |
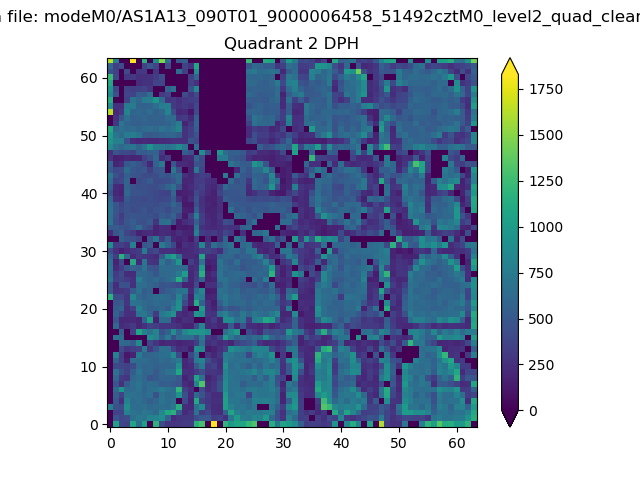
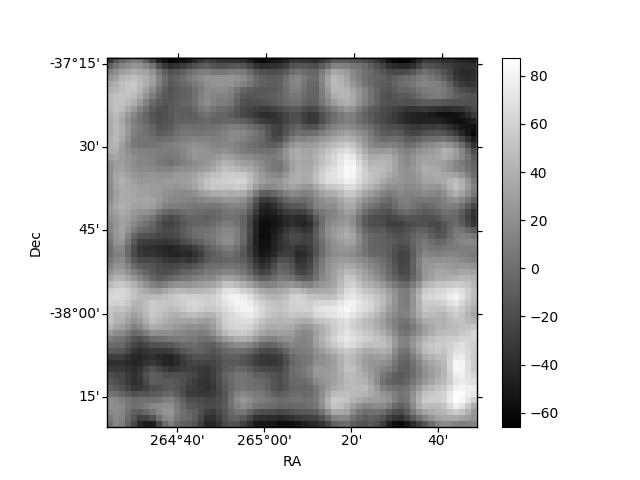
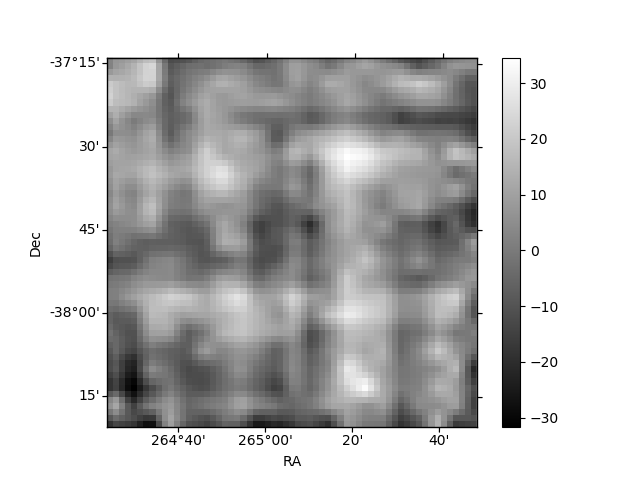
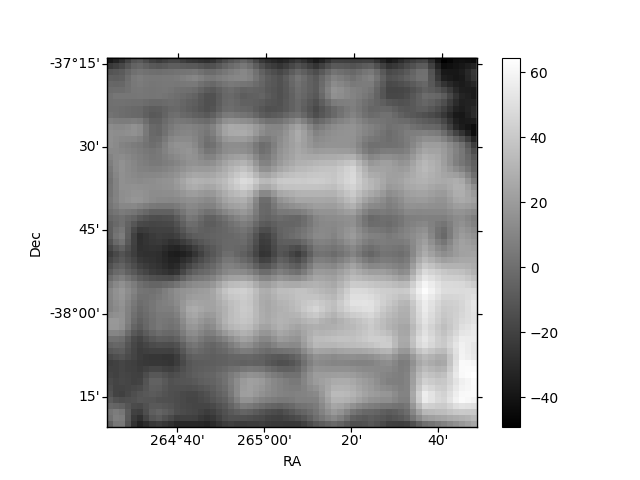
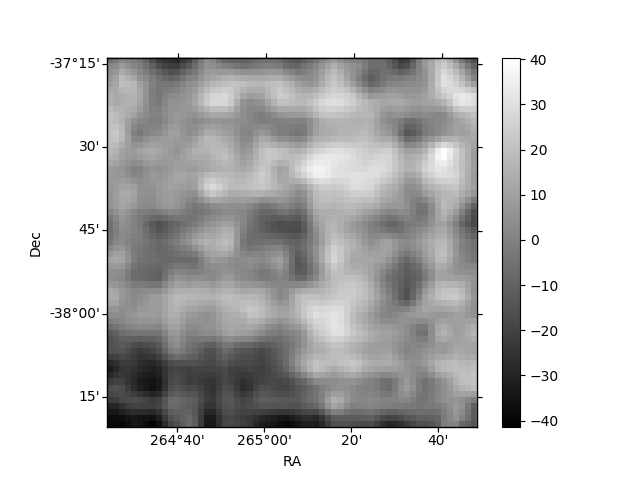
Histogram calculated using DETX and DETY for each event in the final _common_clean file
| Quadrant A | 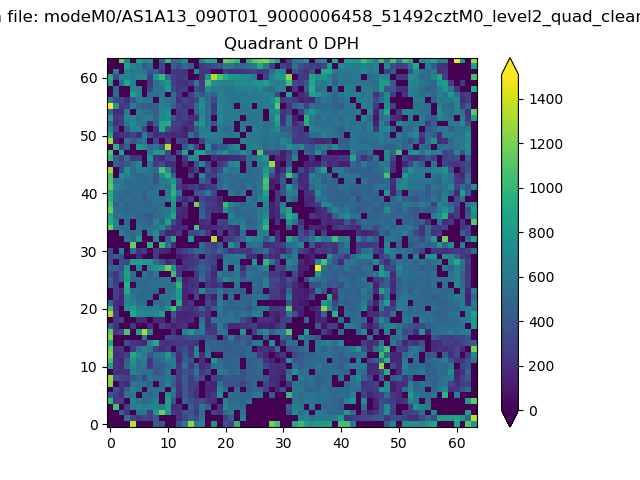 |
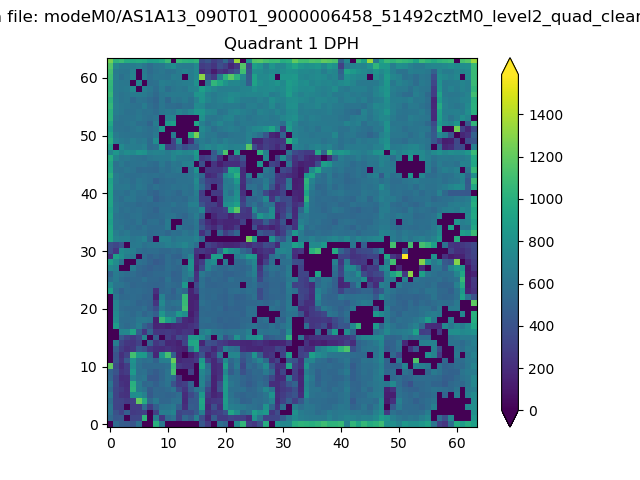 |
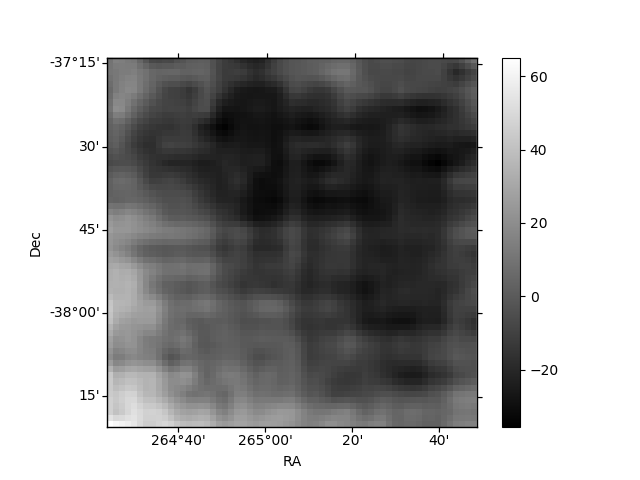
Quadrant B |
|---|---|---|---|
| Quadrant D | 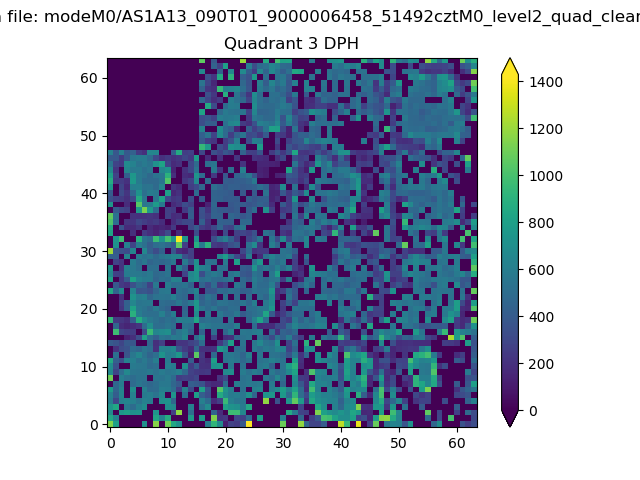 |
 |
Quadrant C |
| Plot type | Count rate plots | Images |
|---|---|---|
| Comparison with Poisson distribution Blue bars denote a histogram of data divided into 1 sec bins. Red curve is a Poisson curve with rate = median count rate of data. |
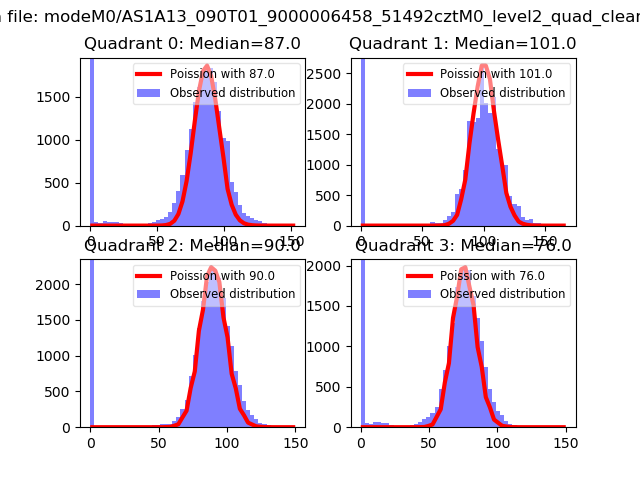 |
 |
| Quadrant-wise count rates Data is divided into 100 sec bins |
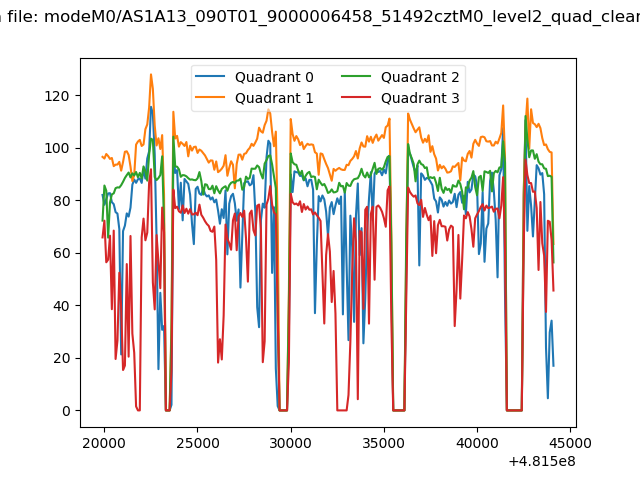 |
|
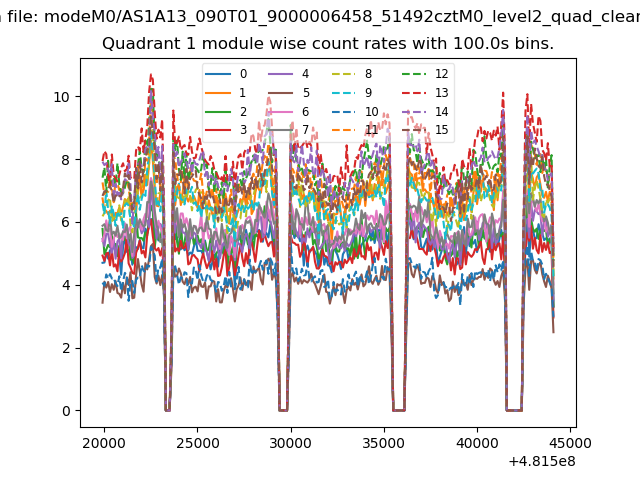
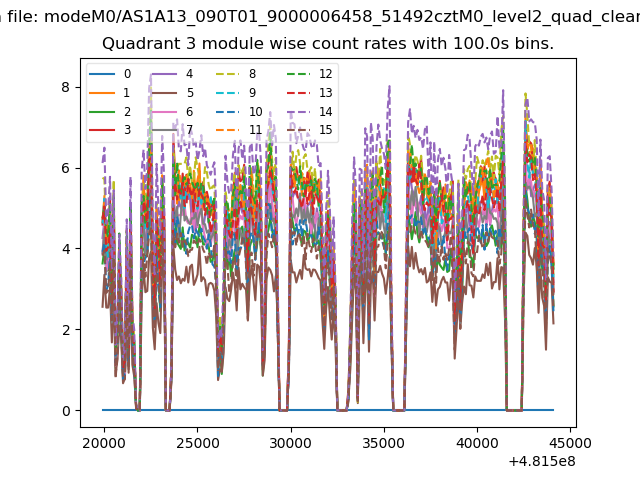
| Module-wise count rates for Quadrant A Data is divided into 100 sec bins |
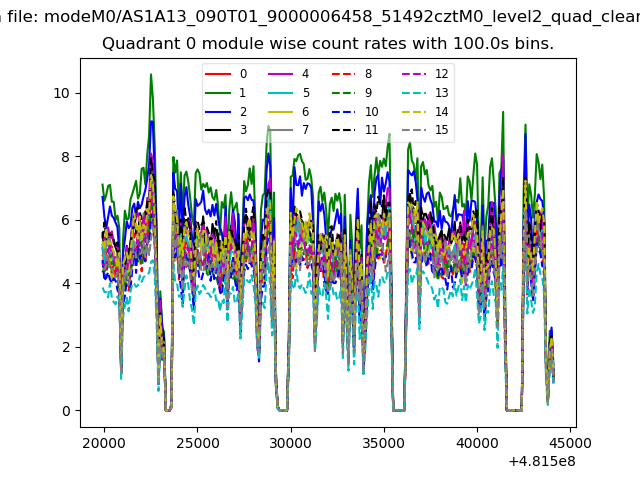 |
 |
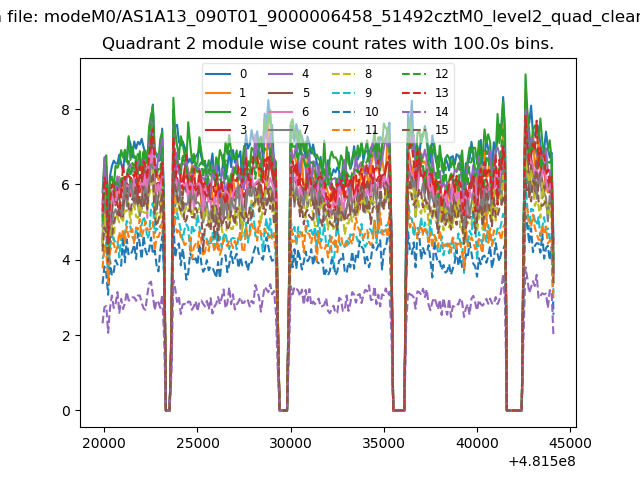
| Module-wise count rates for Quadrant B Data is divided into 100 sec bins |
 |
 |
| Module-wise count rates for Quadrant C Data is divided into 100 sec bins |
 |
 |
| Module-wise count rates for Quadrant D Data is divided into 100 sec bins |
 |
 |
| Parameter | Plot |
|---|---|
| CZT HV Monitor | 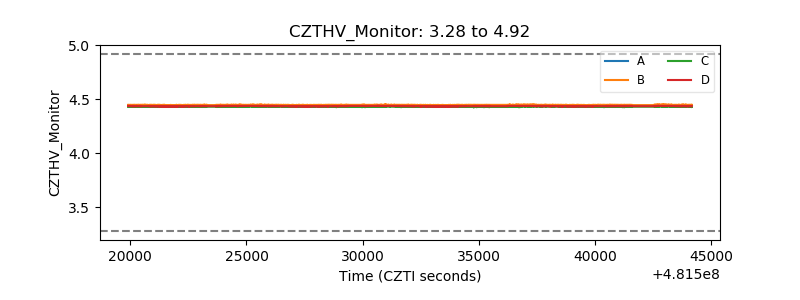 |
| D_VDD | 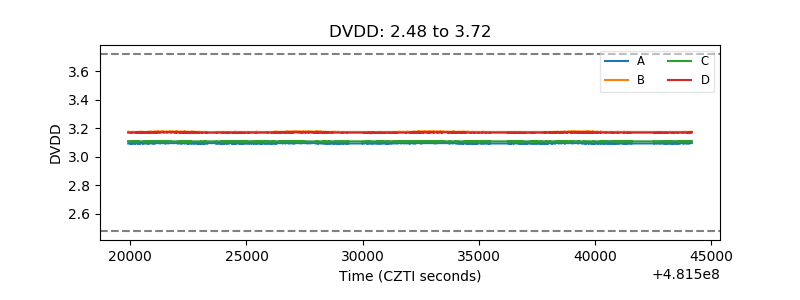 |
| Temperature 1 | 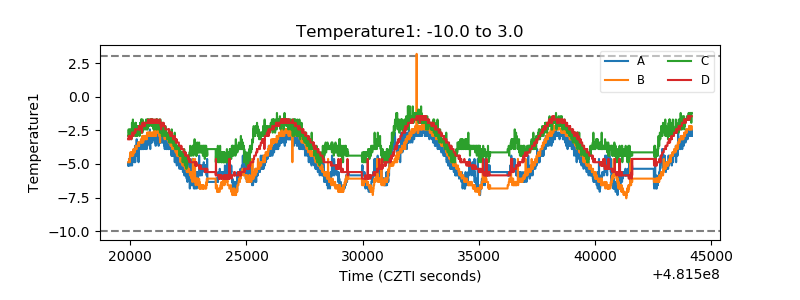 |
| Veto HV Monitor | 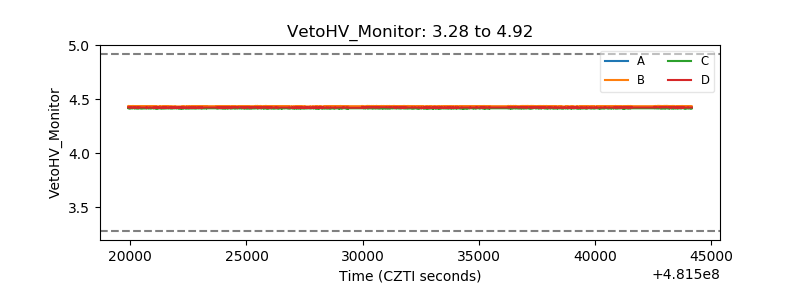 |
| Veto LLD | 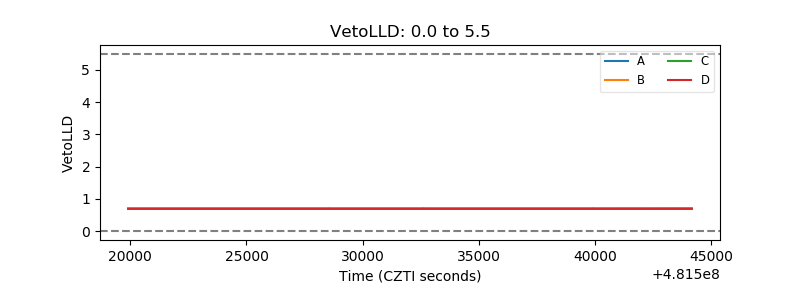 |
| Alpha Counter | 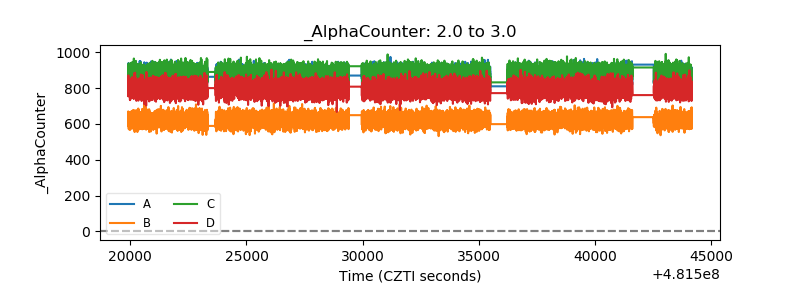 |
| _CPM_Rate | 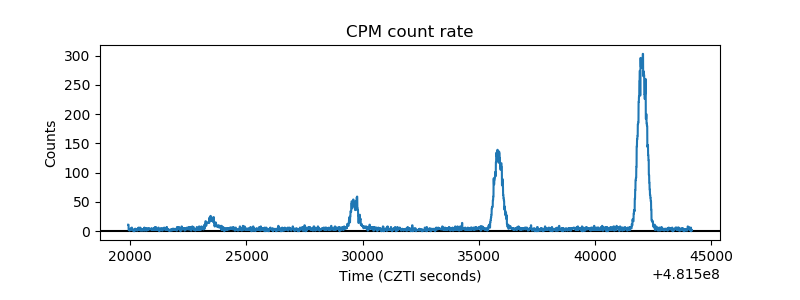 |
| CZT Counter | 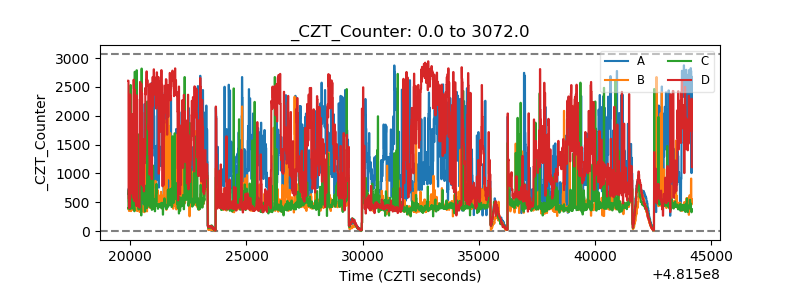 |
| +2.5 Volts monitor | 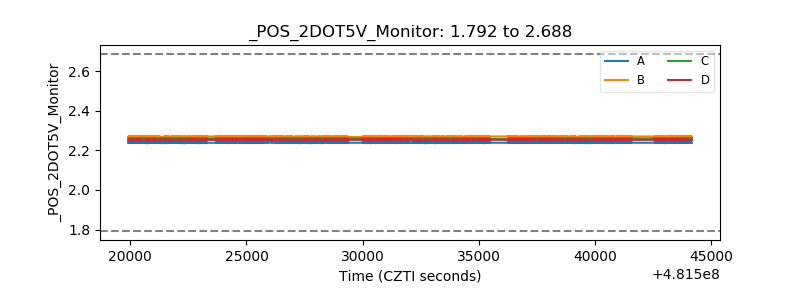 |
| +5 Volts monitor | 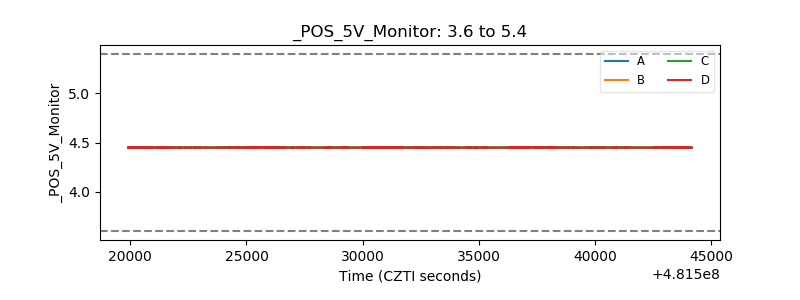 |
| _ROLL_ROT | 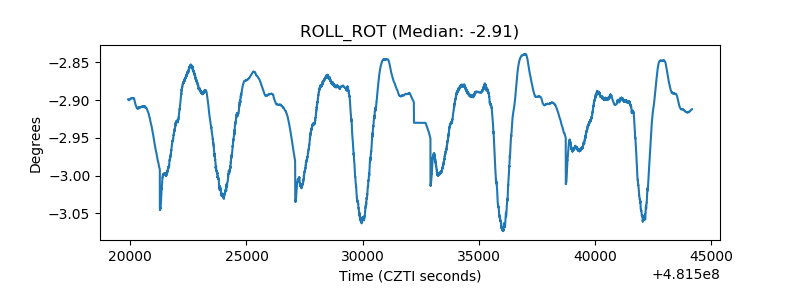 |
| _Roll_DEC | 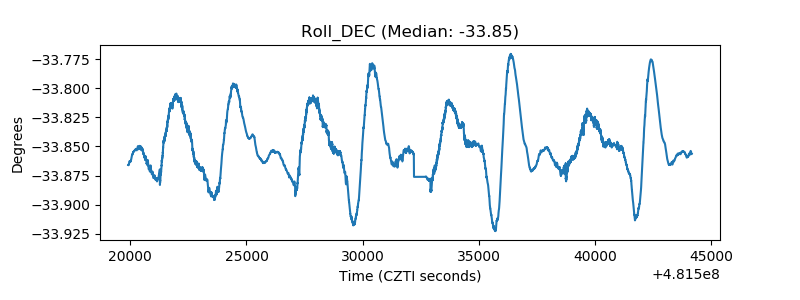 |
| _Roll_RA | 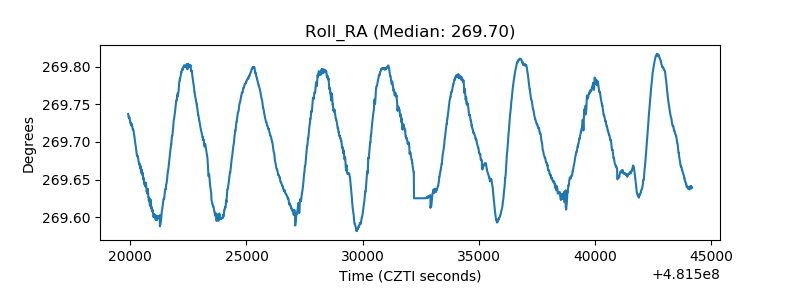 |
| Veto Counter | 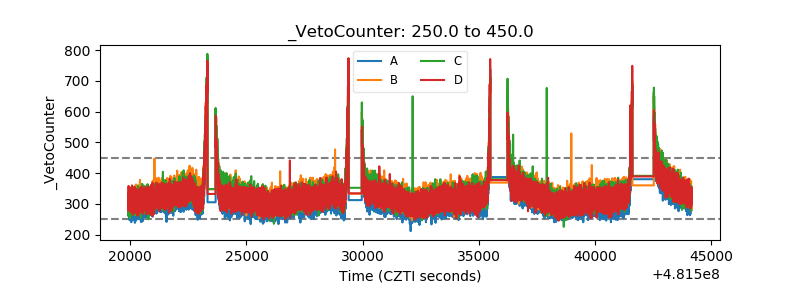 |