| Param | Original file | Final file |
|---|---|---|
| Filename | modeM0/AS1A13_090T01_9000006458_51494cztM0_level2.fits | modeM0/AS1A13_090T01_9000006458_51494cztM0_level2_quad_clean.evt |
| Size (bytes) | 809,133,120 | 89,055,360 |
| Size | 771.6 MB | 84.9 MB |
| Events in quadrant A | 5,228,283 | 630,314 |
| Events in quadrant B | 7,312,140 | 579,783 |
| Events in quadrant C | 5,940,250 | 591,991 |
| Events in quadrant D | 10,952,382 | 425,847 |
| Mode M0 | |||
|---|---|---|---|
| Quadrant | BADHDUFLAG | Total packets | Discarded packets |
| A | 0 | 19895 | 1 |
| B | 0 | 26421 | 1 |
| C | 0 | 22397 | 1 |
| D | 0 | 37248 | 1 |
| Mode M9 | |||
|---|---|---|---|
| Quadrant | BADHDUFLAG | Total packets | Discarded packets |
| A | 0 | 10 | 0 |
| B | 0 | 10 | 0 |
| C | 0 | 10 | 0 |
| D | 0 | 10 | 0 |
| Mode SS | |||
|---|---|---|---|
| Quadrant | BADHDUFLAG | Total packets | Discarded packets |
| A | 0 | 136 | 0 |
| B | 0 | 136 | 0 |
| C | 0 | 136 | 0 |
| D | 0 | 136 | 0 |
| Quadrant | Total seconds | Saturated seconds | Saturation percentage |
|---|---|---|---|
| A | 6710 | 454 | 6.766021% |
| B | 6711 | 1456 | 21.695723% |
| C | 6711 | 657 | 9.789897% |
| D | 6711 | 2332 | 34.748920% |
Noise dominated data is calculated using 1-second bins in cleaned event files. If a bin has >2000 counts, and if more than 50% of those come from <1% of pixels, then it is considered to be noise-dominated and hence unusable.
| Quadrant | # 1 sec bins | Bins with >0 counts | Bins with >2000 counts | High rate bins dominated by noise | Noise dominated (total time) | Noise dominated (detector-on time) | Marked lightcurve |
|---|---|---|---|---|---|---|---|
| A | 7770 | 6710 | 258 | 258 | 3.32% | 3.85% | 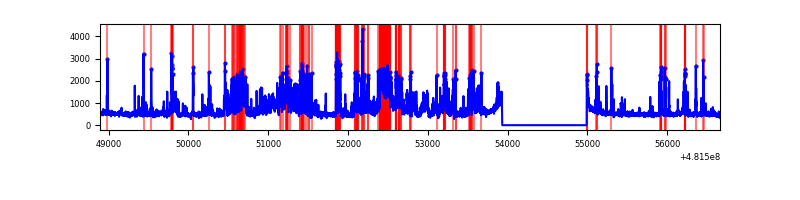 |
| B | 7771 | 6711 | 884 | 884 | 11.38% | 13.17% | 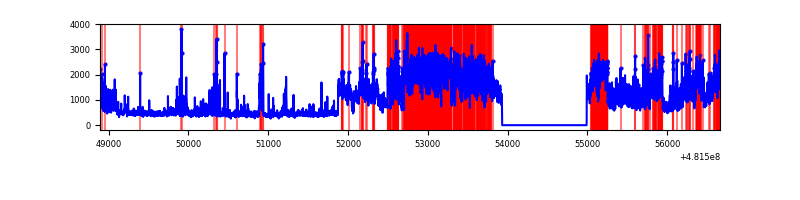 |
| C | 7771 | 6711 | 610 | 610 | 7.85% | 9.09% | 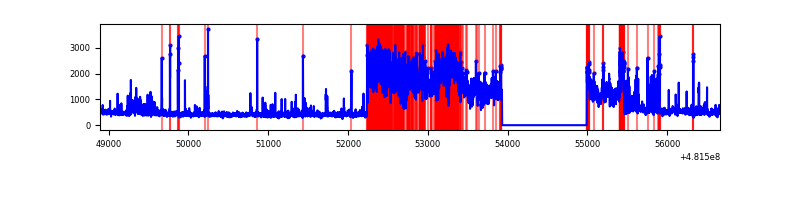 |
| D | 7771 | 6711 | 2331 | 2331 | 30.00% | 34.73% | 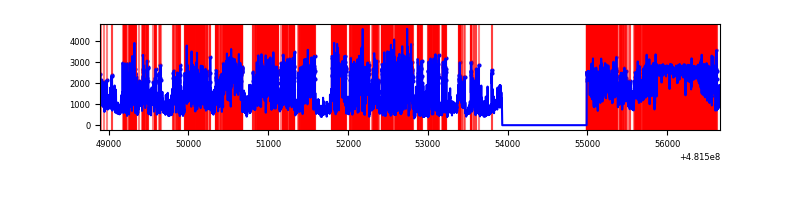 |
Top three noisy pixels from each quadrant. If the there are fewer than three noisy pixels in the level2.evt file, extra rows are filled as -1
| Pixel properties | Quadrant properties | ||||||
|---|---|---|---|---|---|---|---|
| Quadrant | DetID | PixID | Counts | Sigma | Mean | Median | Sigma |
| A | 12 | 250 | 1336628 | 7426.6 | 737 | 719 | 179.9 |
| A | 12 | 3 | 206540 | 1144.2 | 737 | 719 | 179.9 |
| A | 8 | 43 | 133649 | 738.99 | 737 | 719 | 179.9 |
| B | 4 | 81 | 3816478 | 25670.57 | 694 | 670 | 148.6 |
| B | 8 | 234 | 277106 | 1859.7 | 694 | 670 | 148.6 |
| B | 5 | 185 | 66770 | 444.68 | 694 | 670 | 148.6 |
| C | 9 | 38 | 2608351 | 13317.24 | 712 | 707 | 195.8 |
| C | 13 | 3 | 96549 | 489.47 | 712 | 707 | 195.8 |
| C | 15 | 215 | 77327 | 391.3 | 712 | 707 | 195.8 |
| D | 8 | 176 | 5304523 | 30475.07 | 627 | 604 | 174.0 |
| D | 11 | 176 | 2575665 | 14795.7 | 627 | 604 | 174.0 |
| D | 1 | 3 | 140913 | 806.18 | 627 | 604 | 174.0 |
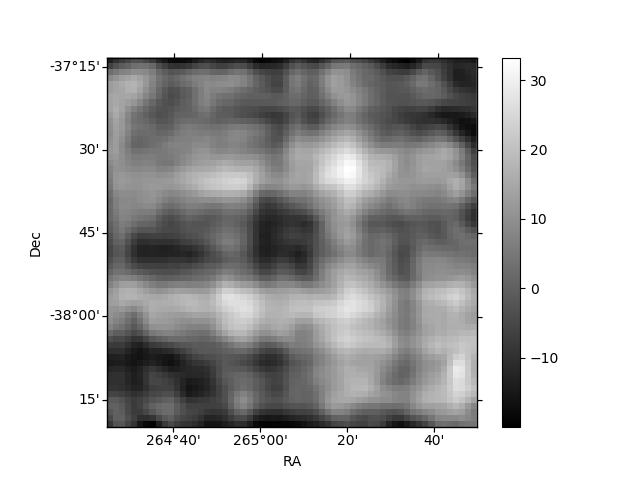
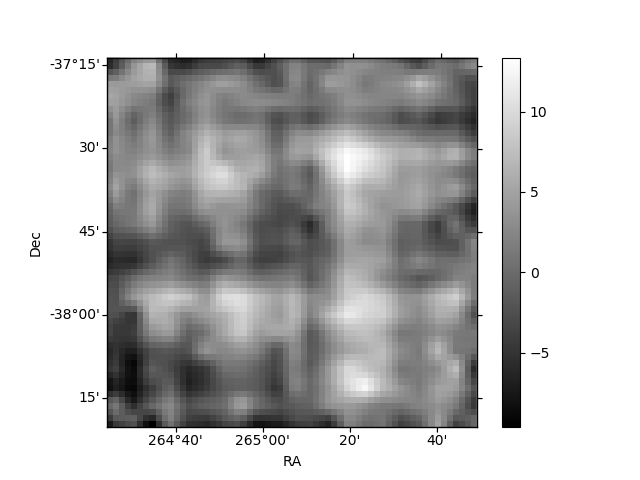
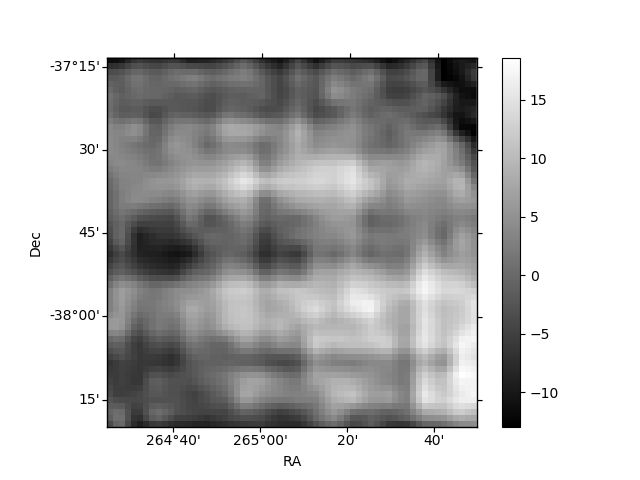
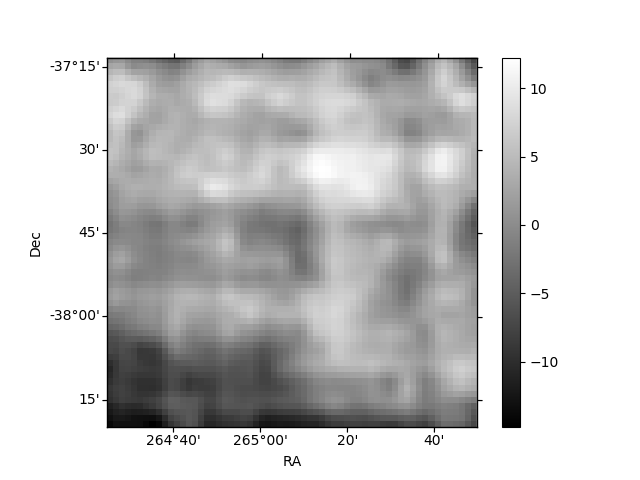
Histogram calculated using DETX and DETY for each event in the final _common_clean file
| Quadrant A | 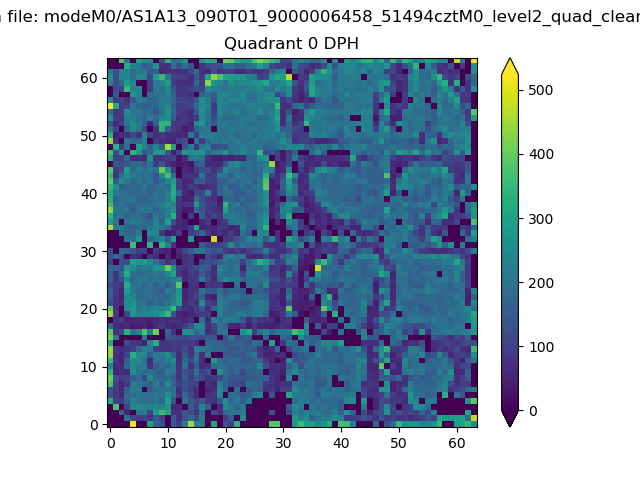 |
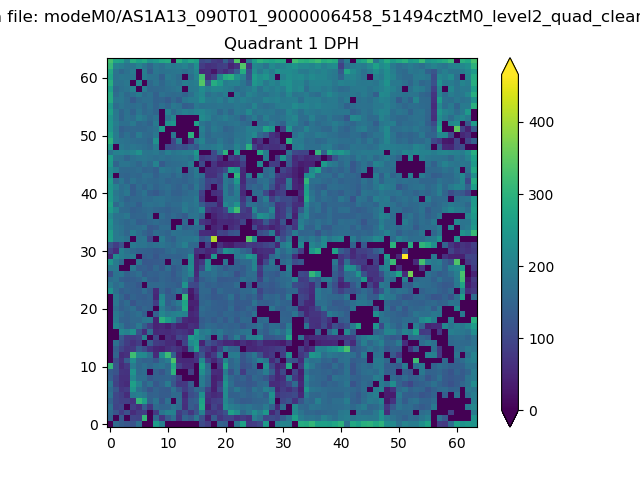 |
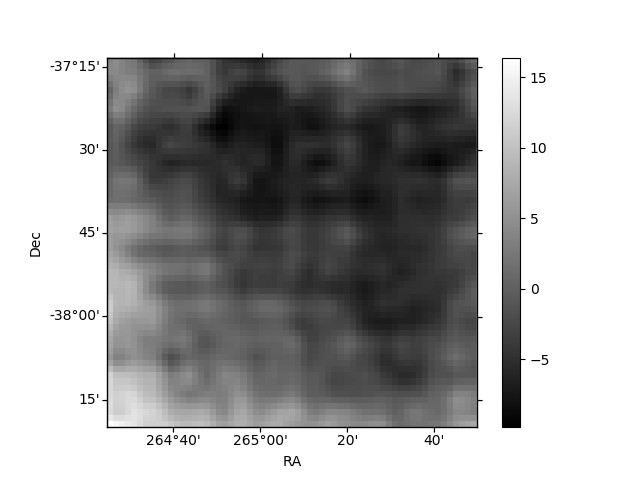
Quadrant B |
|---|---|---|---|
| Quadrant D | 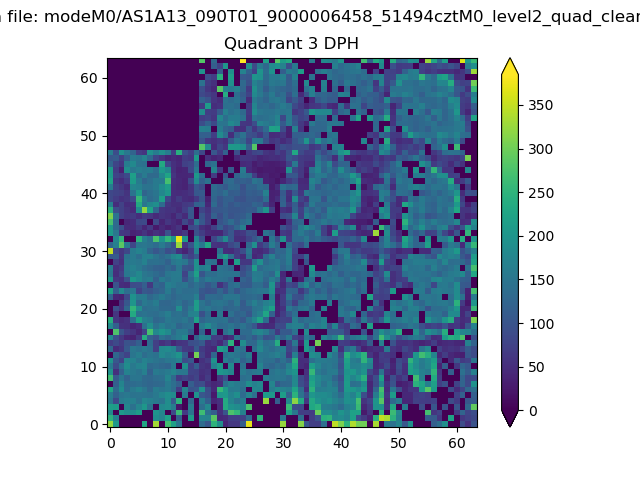 |
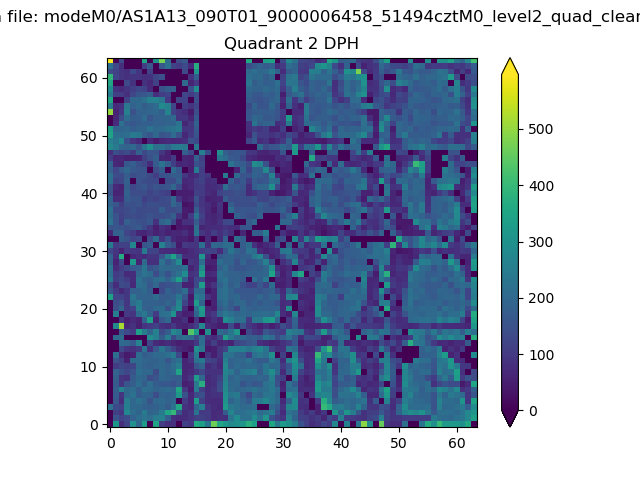 |
Quadrant C |
| Plot type | Count rate plots | Images |
|---|---|---|
| Comparison with Poisson distribution Blue bars denote a histogram of data divided into 1 sec bins. Red curve is a Poisson curve with rate = median count rate of data. |
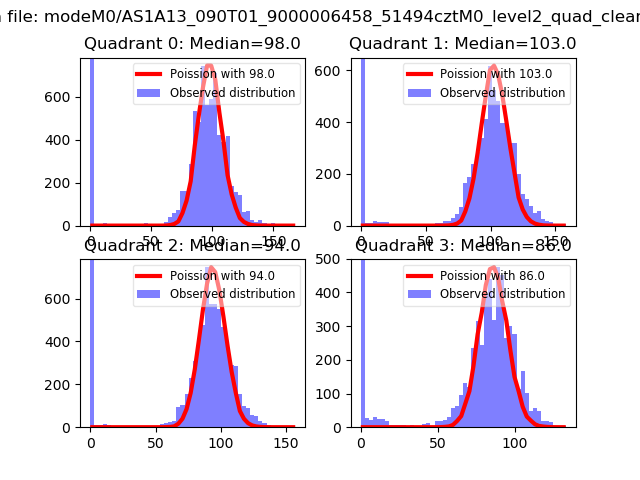 |
 |
| Quadrant-wise count rates Data is divided into 100 sec bins |
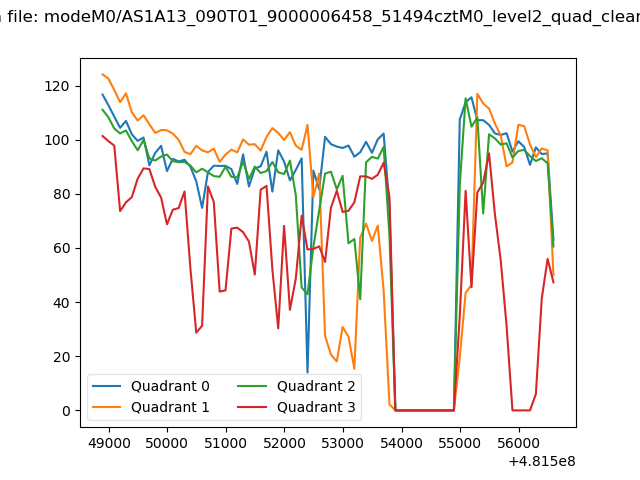 |
|
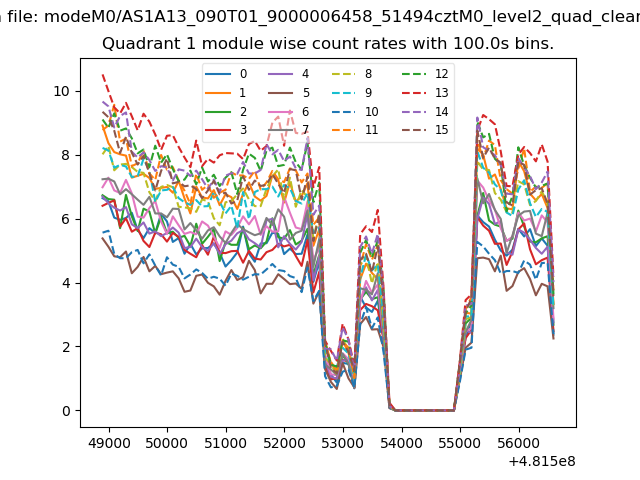
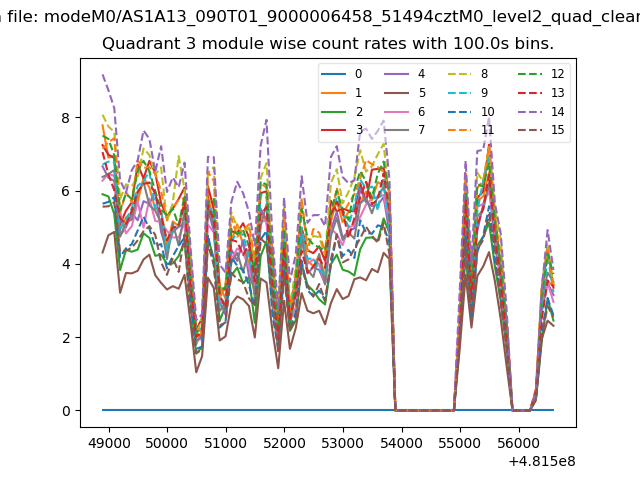
| Module-wise count rates for Quadrant A Data is divided into 100 sec bins |
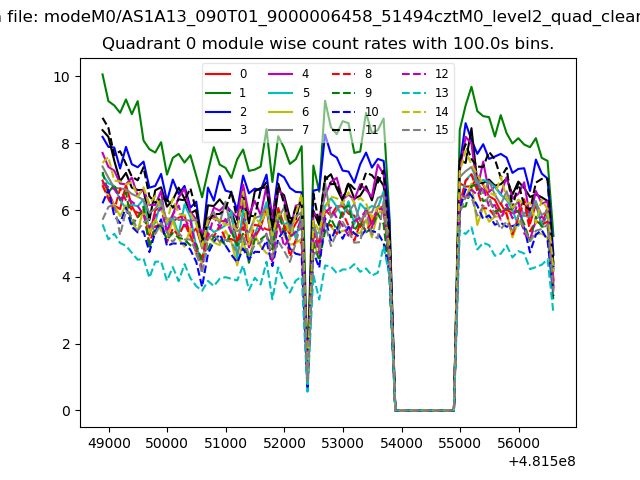 |
 |
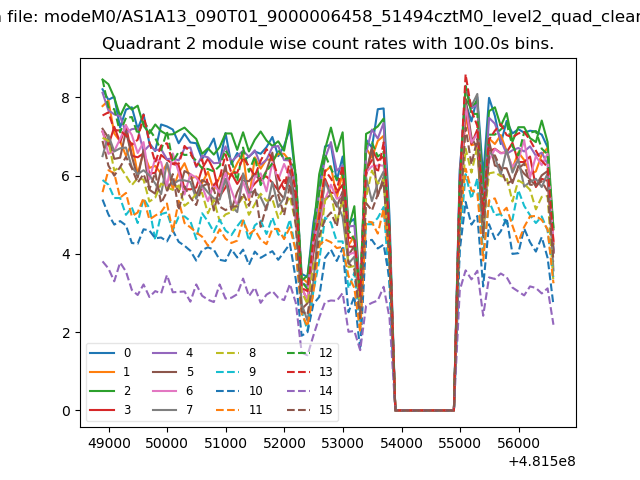
| Module-wise count rates for Quadrant B Data is divided into 100 sec bins |
 |
 |
| Module-wise count rates for Quadrant C Data is divided into 100 sec bins |
 |
 |
| Module-wise count rates for Quadrant D Data is divided into 100 sec bins |
 |
 |
| Parameter | Plot |
|---|---|
| CZT HV Monitor | 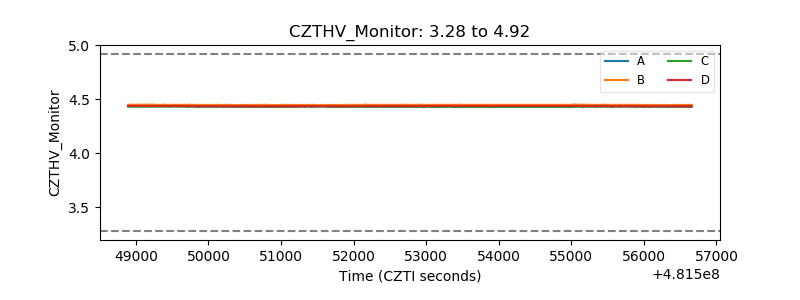 |
| D_VDD | 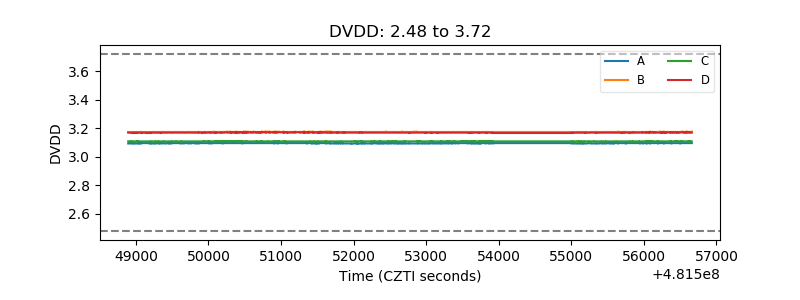 |
| Temperature 1 | 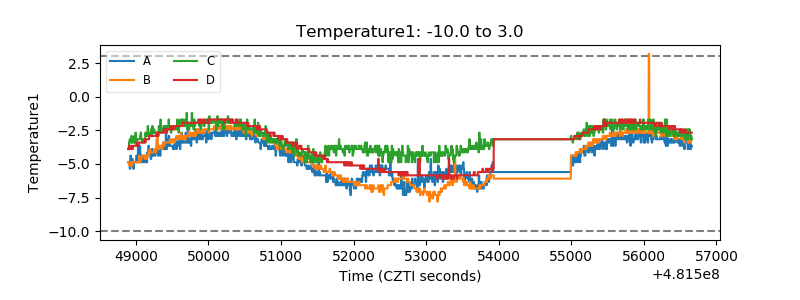 |
| Veto HV Monitor | 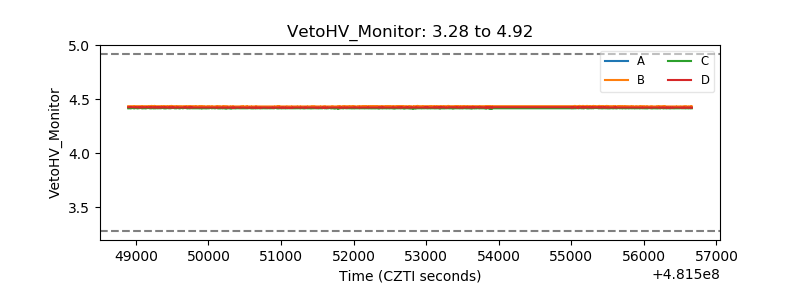 |
| Veto LLD | 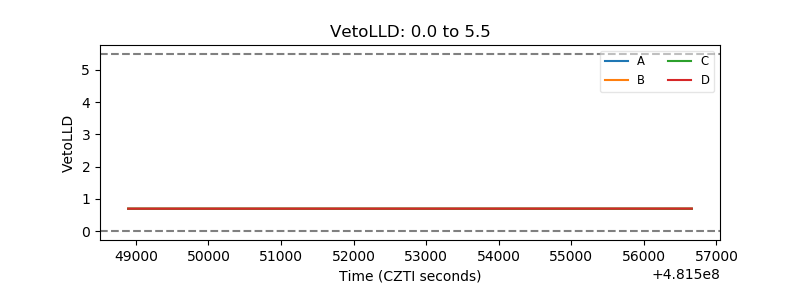 |
| Alpha Counter | 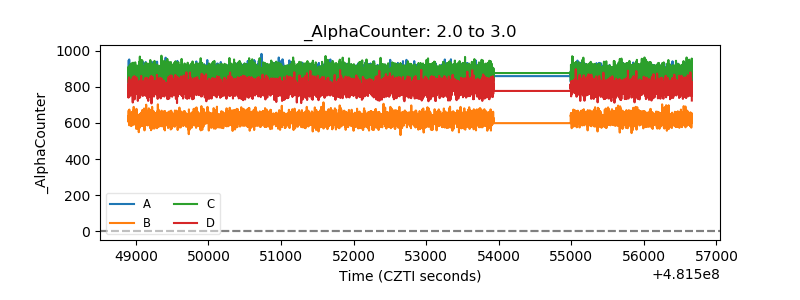 |
| _CPM_Rate | 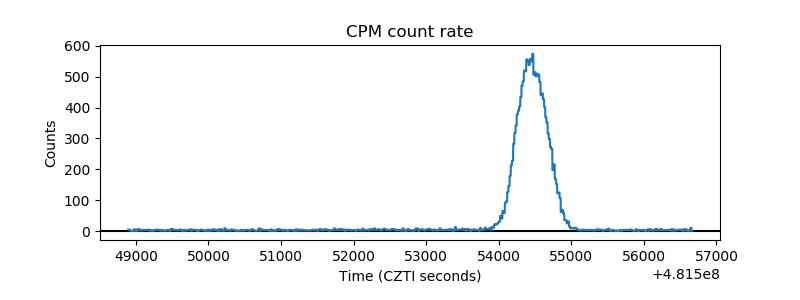 |
| CZT Counter | 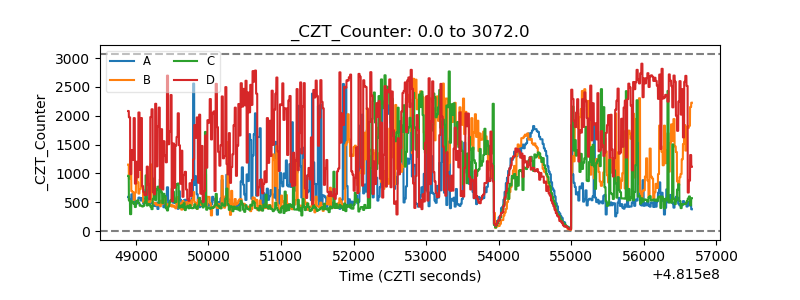 |
| +2.5 Volts monitor | 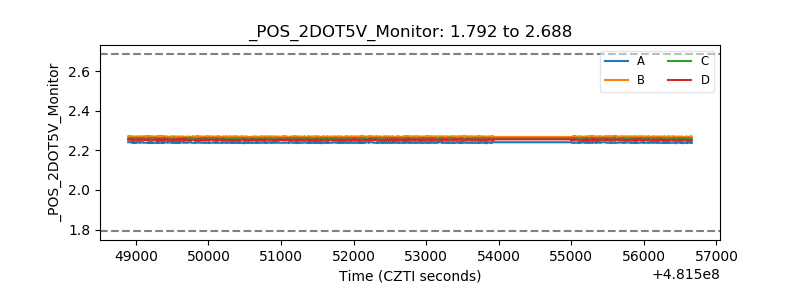 |
| +5 Volts monitor | 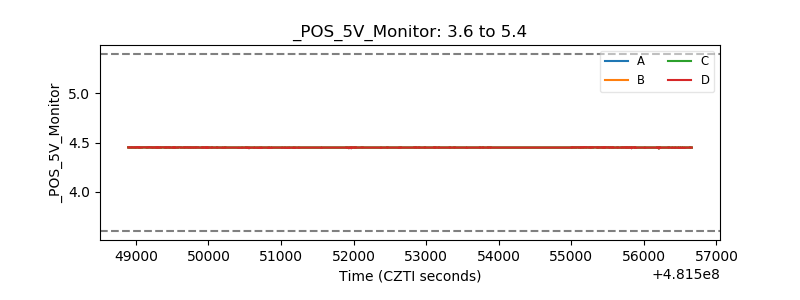 |
| _ROLL_ROT | 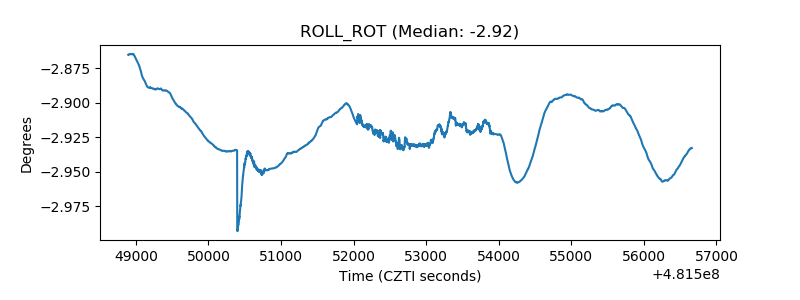 |
| _Roll_DEC | 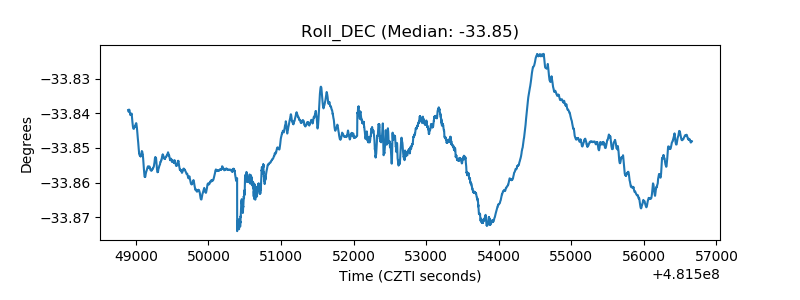 |
| _Roll_RA | 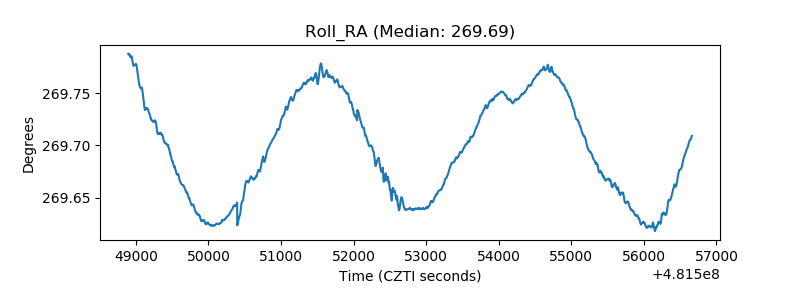 |
| Veto Counter | 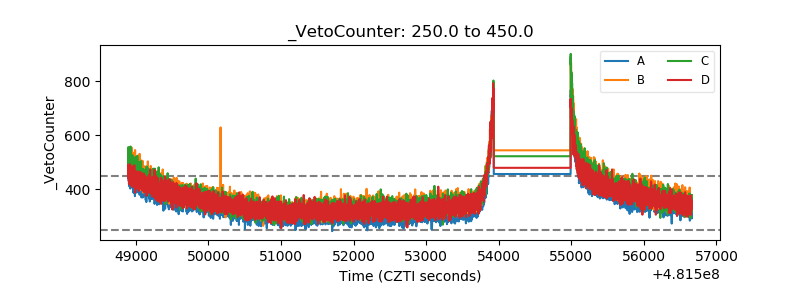 |