| Param | Original file | Final file |
|---|---|---|
| Filename | modeM0/AS1A13_090T01_9000006458_51495cztM0_level2.fits | modeM0/AS1A13_090T01_9000006458_51495cztM0_level2_quad_clean.evt |
| Size (bytes) | 770,345,280 | 87,730,560 |
| Size | 734.7 MB | 83.7 MB |
| Events in quadrant A | 5,359,842 | 602,250 |
| Events in quadrant B | 5,850,475 | 659,955 |
| Events in quadrant C | 4,345,983 | 604,960 |
| Events in quadrant D | 12,456,068 | 334,926 |
| Mode M0 | |||
|---|---|---|---|
| Quadrant | BADHDUFLAG | Total packets | Discarded packets |
| A | 0 | 20304 | 0 |
| B | 0 | 21765 | 0 |
| C | 0 | 17335 | 0 |
| D | 0 | 41519 | 0 |
| Mode M9 | |||
|---|---|---|---|
| Quadrant | BADHDUFLAG | Total packets | Discarded packets |
| A | 0 | 11 | 0 |
| B | 0 | 11 | 0 |
| C | 0 | 11 | 0 |
| D | 0 | 11 | 0 |
| Mode SS | |||
|---|---|---|---|
| Quadrant | BADHDUFLAG | Total packets | Discarded packets |
| A | 0 | 132 | 0 |
| B | 0 | 132 | 0 |
| C | 0 | 132 | 0 |
| D | 0 | 132 | 0 |
| Quadrant | Total seconds | Saturated seconds | Saturation percentage |
|---|---|---|---|
| A | 6510 | 573 | 8.801843% |
| B | 6510 | 592 | 9.093702% |
| C | 6510 | 185 | 2.841782% |
| D | 6510 | 3126 | 48.018433% |
Noise dominated data is calculated using 1-second bins in cleaned event files. If a bin has >2000 counts, and if more than 50% of those come from <1% of pixels, then it is considered to be noise-dominated and hence unusable.
| Quadrant | # 1 sec bins | Bins with >0 counts | Bins with >2000 counts | High rate bins dominated by noise | Noise dominated (total time) | Noise dominated (detector-on time) | Marked lightcurve |
|---|---|---|---|---|---|---|---|
| A | 7600 | 6510 | 382 | 382 | 5.03% | 5.87% | 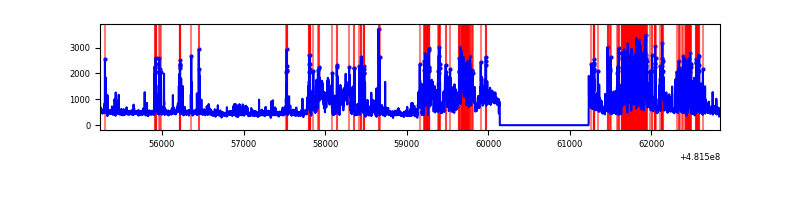 |
| B | 7600 | 6510 | 324 | 324 | 4.26% | 4.98% | 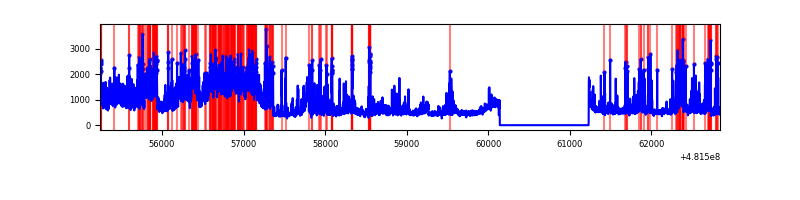 |
| C | 7600 | 6510 | 105 | 105 | 1.38% | 1.61% | 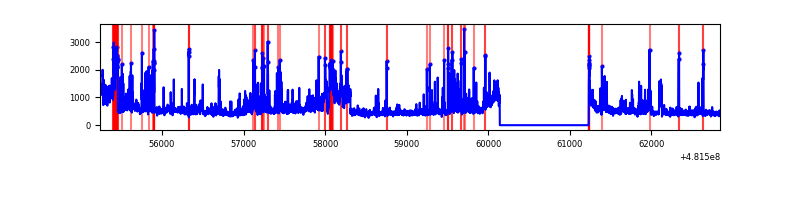 |
| D | 7599 | 6509 | 3224 | 3224 | 42.43% | 49.53% | 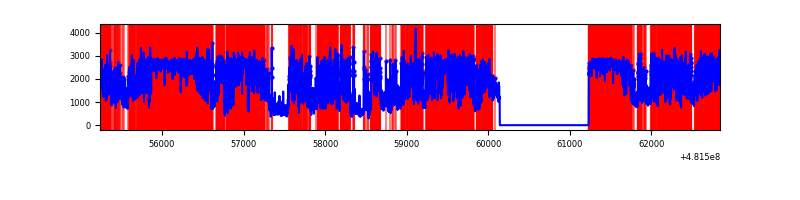 |
Top three noisy pixels from each quadrant. If the there are fewer than three noisy pixels in the level2.evt file, extra rows are filled as -1
| Pixel properties | Quadrant properties | ||||||
|---|---|---|---|---|---|---|---|
| Quadrant | DetID | PixID | Counts | Sigma | Mean | Median | Sigma |
| A | 12 | 250 | 975002 | 5584.79 | 714 | 695 | 174.5 |
| A | 12 | 2 | 451417 | 2583.57 | 714 | 695 | 174.5 |
| A | 8 | 249 | 256845 | 1468.27 | 714 | 695 | 174.5 |
| B | 4 | 81 | 1914179 | 12665.36 | 708 | 685 | 151.1 |
| B | 8 | 234 | 241097 | 1591.28 | 708 | 685 | 151.1 |
| B | 8 | 128 | 216007 | 1425.21 | 708 | 685 | 151.1 |
| C | 9 | 38 | 707076 | 3596.66 | 704 | 700 | 196.4 |
| C | 15 | 215 | 200178 | 1015.68 | 704 | 700 | 196.4 |
| C | 13 | 3 | 158296 | 802.43 | 704 | 700 | 196.4 |
| D | 8 | 176 | 6342419 | 40755.06 | 556 | 536 | 155.6 |
| D | 11 | 176 | 3193483 | 20518.94 | 556 | 536 | 155.6 |
| D | 3 | 12 | 329205 | 2112.14 | 556 | 536 | 155.6 |
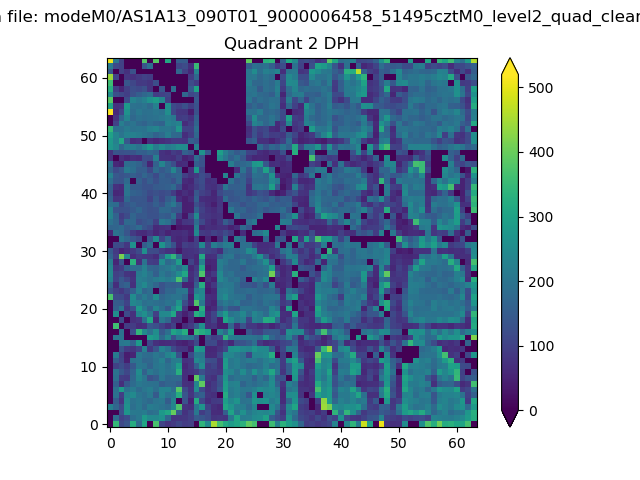
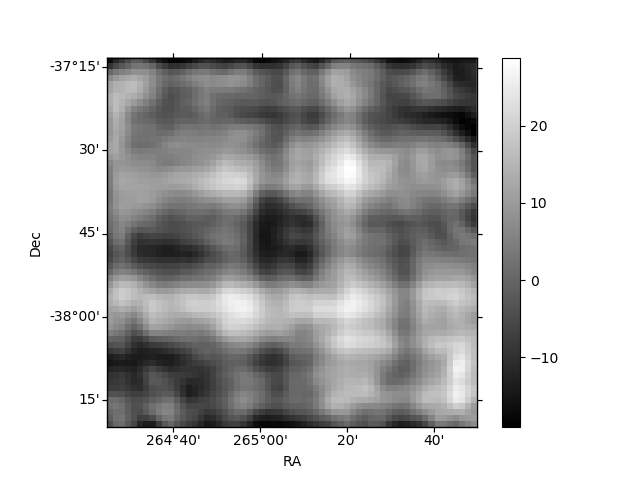
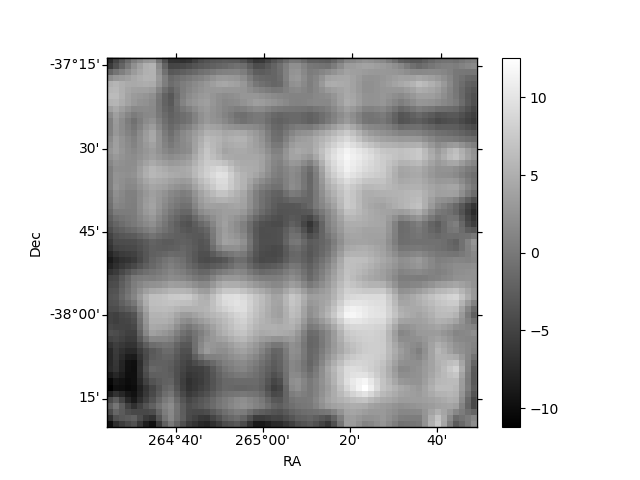
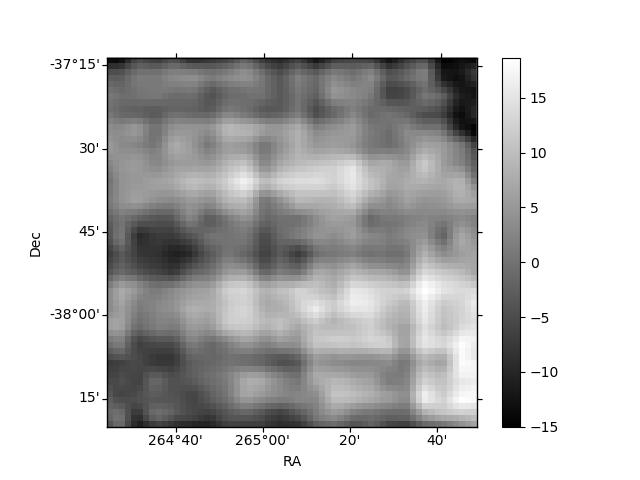
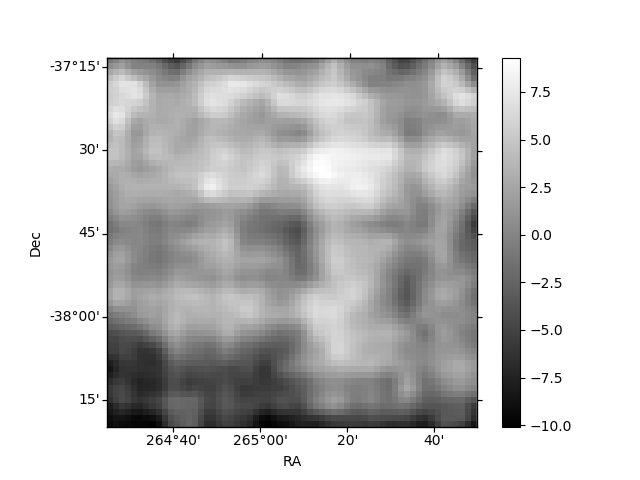
Histogram calculated using DETX and DETY for each event in the final _common_clean file
| Quadrant A | 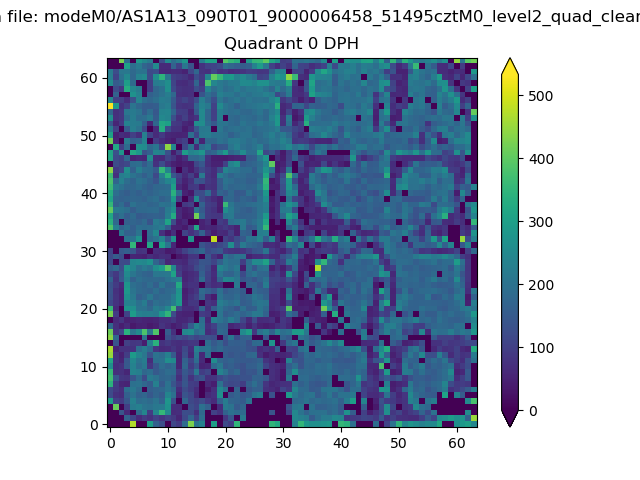 |
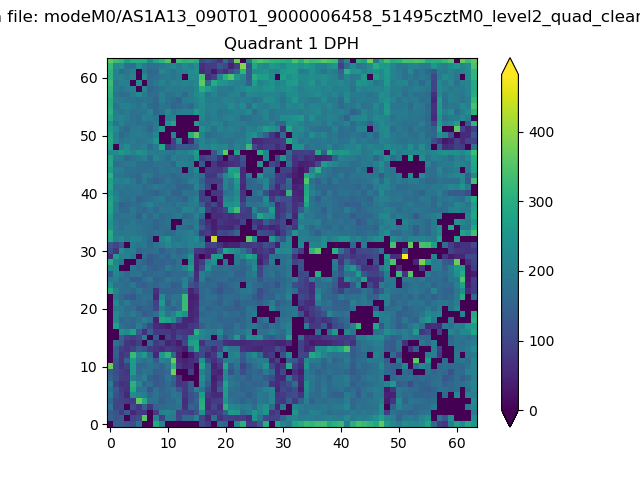 |
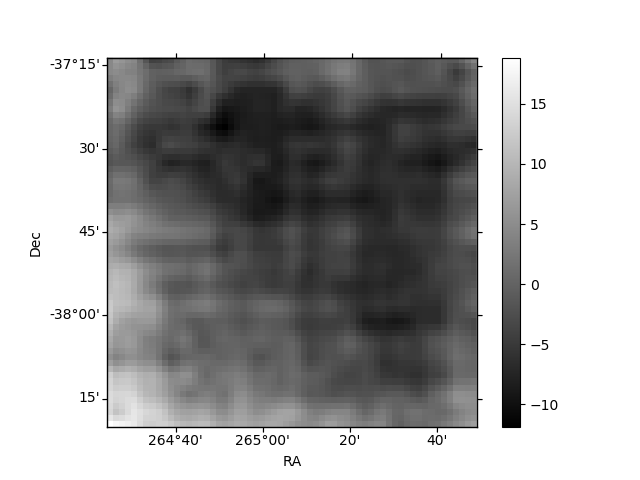
Quadrant B |
|---|---|---|---|
| Quadrant D | 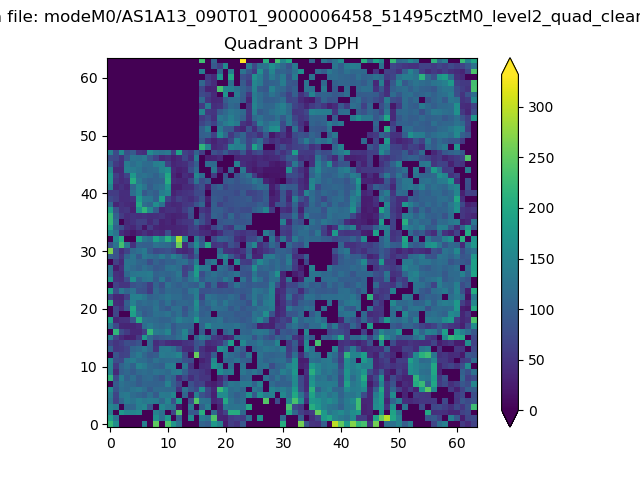 |
 |
Quadrant C |
| Plot type | Count rate plots | Images |
|---|---|---|
| Comparison with Poisson distribution Blue bars denote a histogram of data divided into 1 sec bins. Red curve is a Poisson curve with rate = median count rate of data. |
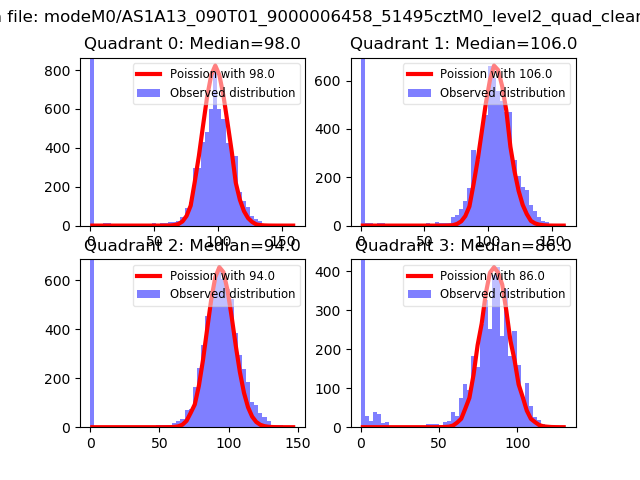 |
 |
| Quadrant-wise count rates Data is divided into 100 sec bins |
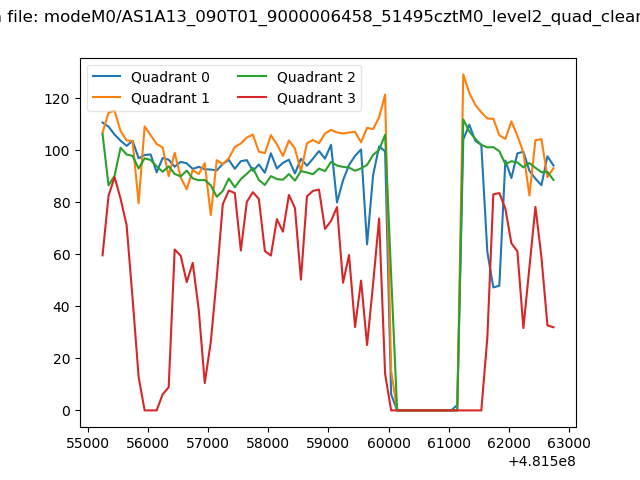 |
|
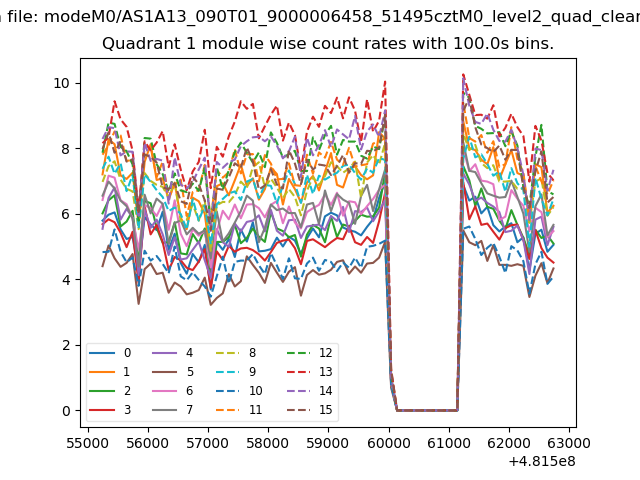
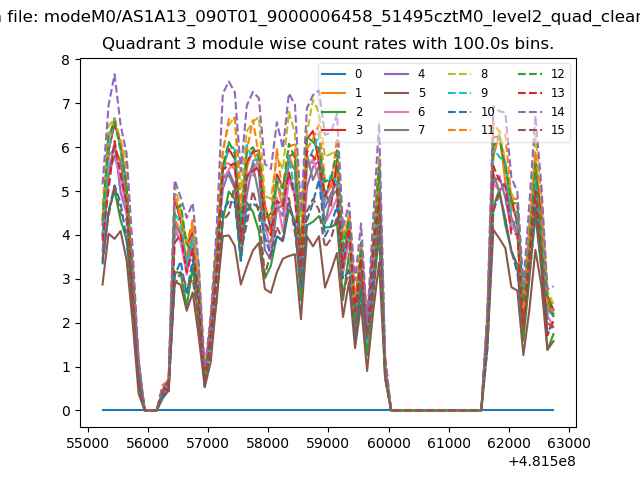
| Module-wise count rates for Quadrant A Data is divided into 100 sec bins |
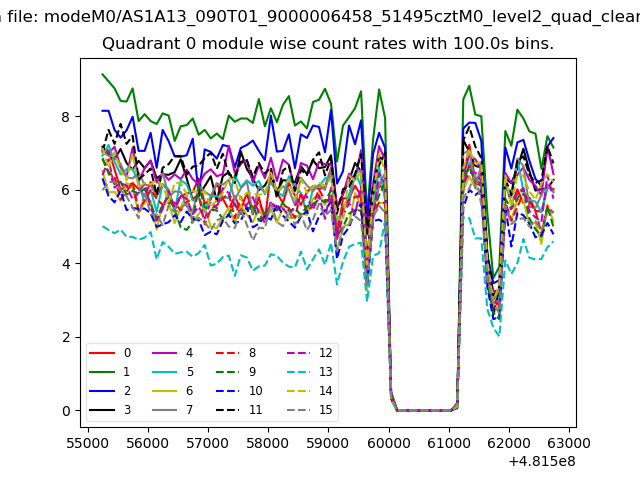 |
 |
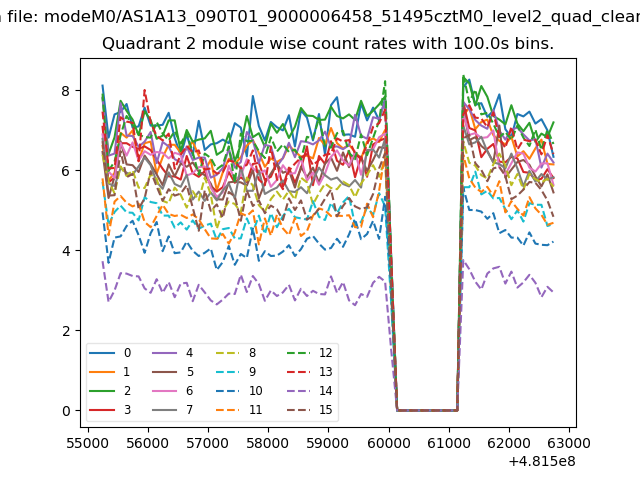
| Module-wise count rates for Quadrant B Data is divided into 100 sec bins |
 |
 |
| Module-wise count rates for Quadrant C Data is divided into 100 sec bins |
 |
 |
| Module-wise count rates for Quadrant D Data is divided into 100 sec bins |
 |
 |
| Parameter | Plot |
|---|---|
| CZT HV Monitor | 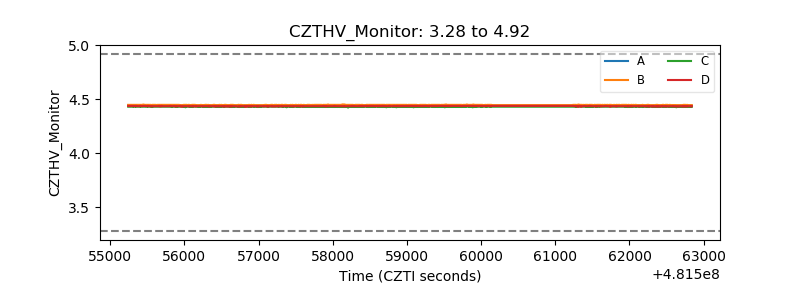 |
| D_VDD | 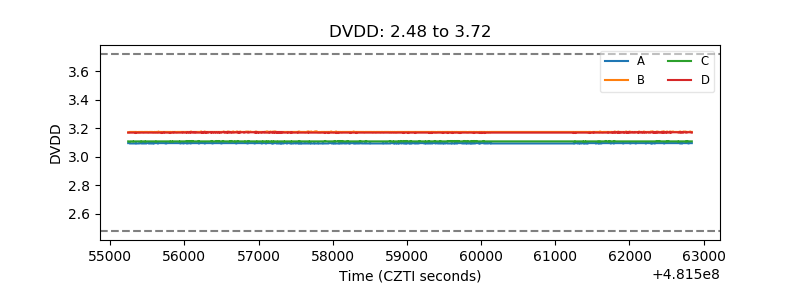 |
| Temperature 1 | 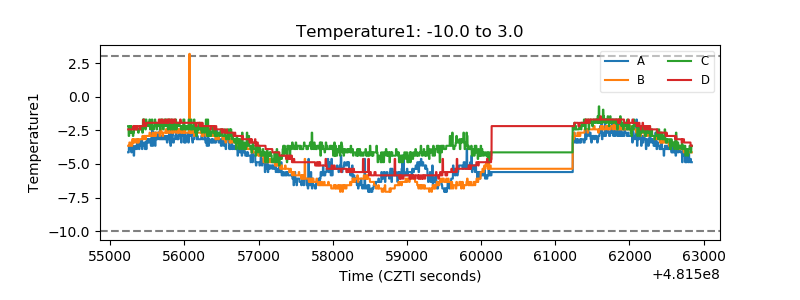 |
| Veto HV Monitor | 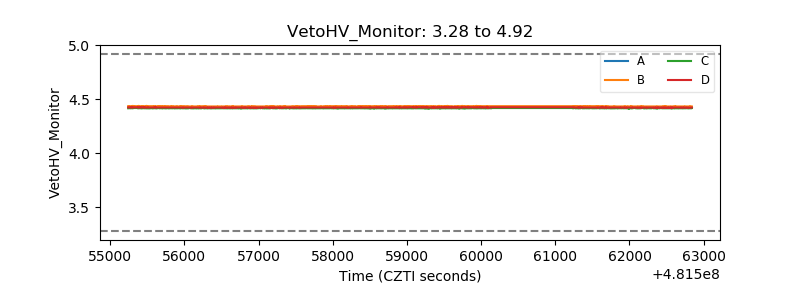 |
| Veto LLD | 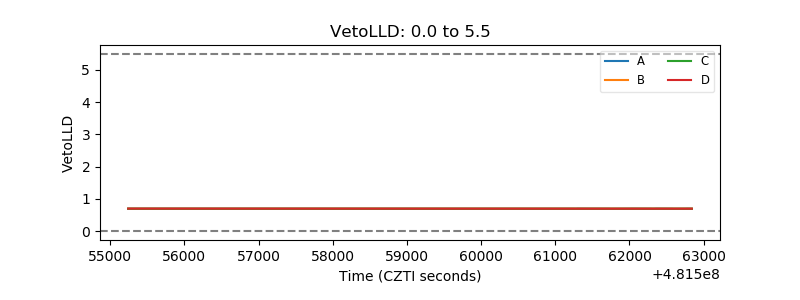 |
| Alpha Counter |  |
| _CPM_Rate | 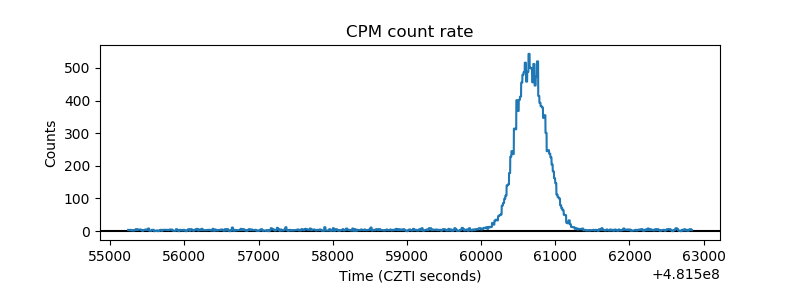 |
| CZT Counter | 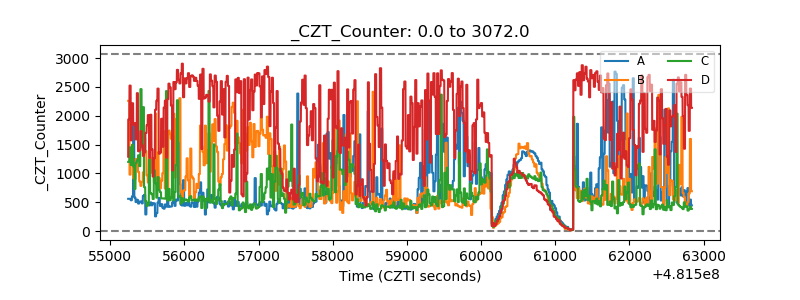 |
| +2.5 Volts monitor | 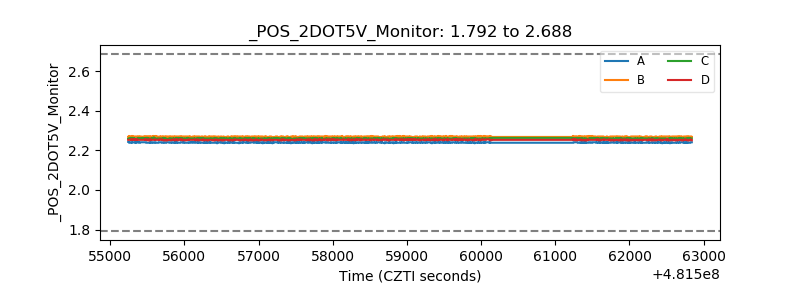 |
| +5 Volts monitor |  |
| _ROLL_ROT | 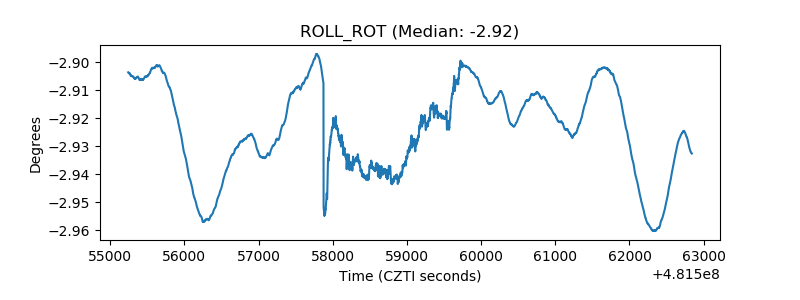 |
| _Roll_DEC | 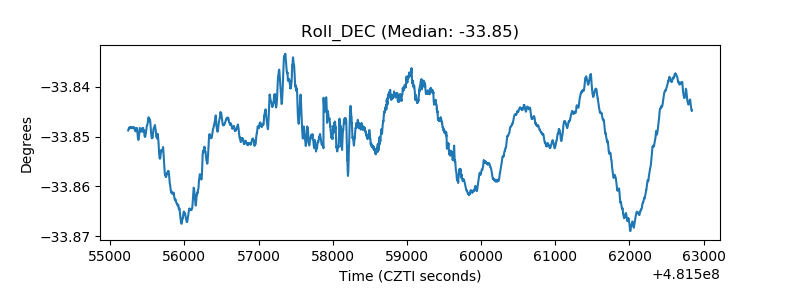 |
| _Roll_RA | 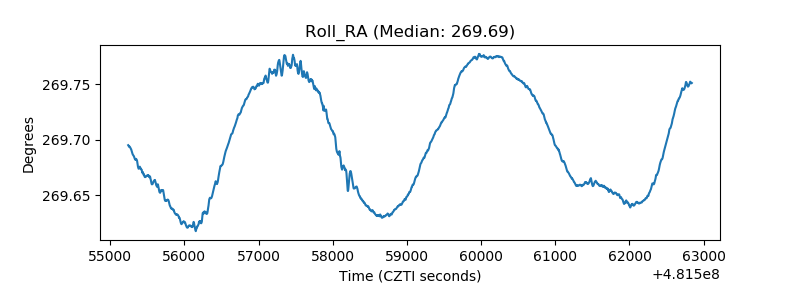 |
| Veto Counter | 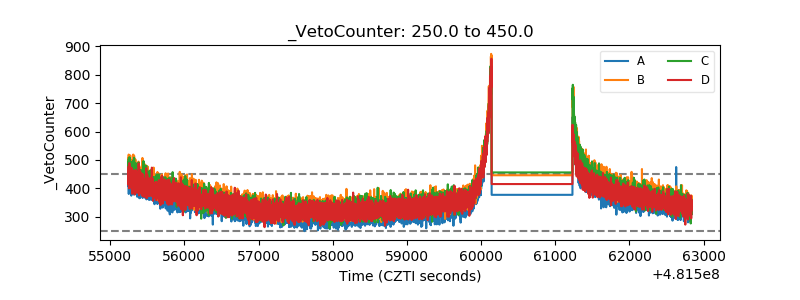 |