| Param | Original file | Final file |
|---|---|---|
| Filename | modeM0/AS1A13_090T01_9000006458_51498cztM0_level2.fits | modeM0/AS1A13_090T01_9000006458_51498cztM0_level2_quad_clean.evt |
| Size (bytes) | 838,310,400 | 96,652,800 |
| Size | 799.5 MB | 92.2 MB |
| Events in quadrant A | 6,668,215 | 661,294 |
| Events in quadrant B | 9,280,280 | 594,992 |
| Events in quadrant C | 4,833,857 | 673,492 |
| Events in quadrant D | 9,667,762 | 473,254 |
| Mode M0 | |||
|---|---|---|---|
| Quadrant | BADHDUFLAG | Total packets | Discarded packets |
| A | 0 | 24836 | 2 |
| B | 0 | 32770 | 2 |
| C | 0 | 19516 | 2 |
| D | 0 | 34022 | 2 |
| Mode M9 | |||
|---|---|---|---|
| Quadrant | BADHDUFLAG | Total packets | Discarded packets |
| A | 0 | 13 | 0 |
| B | 0 | 13 | 0 |
| C | 0 | 13 | 0 |
| D | 0 | 13 | 0 |
| Mode SS | |||
|---|---|---|---|
| Quadrant | BADHDUFLAG | Total packets | Discarded packets |
| A | 0 | 156 | 0 |
| B | 0 | 156 | 0 |
| C | 0 | 156 | 0 |
| D | 0 | 156 | 0 |
| Quadrant | Total seconds | Saturated seconds | Saturation percentage |
|---|---|---|---|
| A | 7516 | 756 | 10.058542% |
| B | 7516 | 1948 | 25.918042% |
| C | 7516 | 289 | 3.845130% |
| D | 7516 | 2208 | 29.377328% |
Noise dominated data is calculated using 1-second bins in cleaned event files. If a bin has >2000 counts, and if more than 50% of those come from <1% of pixels, then it is considered to be noise-dominated and hence unusable.
| Quadrant | # 1 sec bins | Bins with >0 counts | Bins with >2000 counts | High rate bins dominated by noise | Noise dominated (total time) | Noise dominated (detector-on time) | Marked lightcurve |
|---|---|---|---|---|---|---|---|
| A | 8850 | 7518 | 512 | 512 | 5.79% | 6.81% | 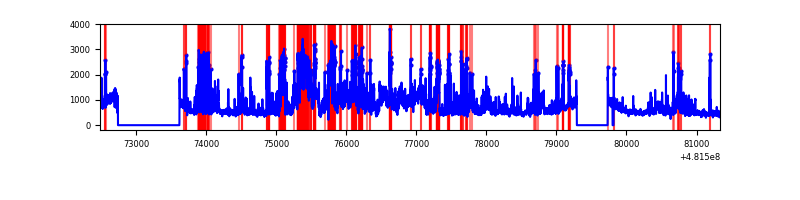 |
| B | 8850 | 7518 | 1446 | 1446 | 16.34% | 19.23% | 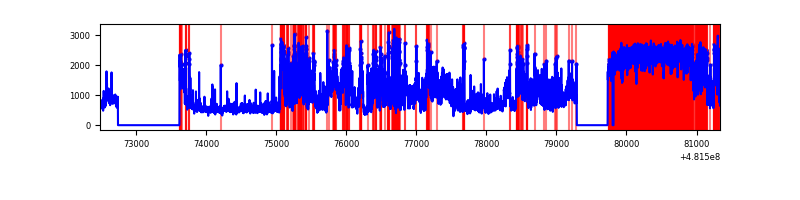 |
| C | 8850 | 7517 | 194 | 194 | 2.19% | 2.58% | 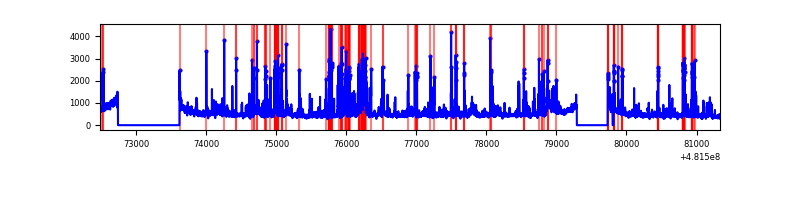 |
| D | 8849 | 7516 | 2126 | 2126 | 24.03% | 28.29% | 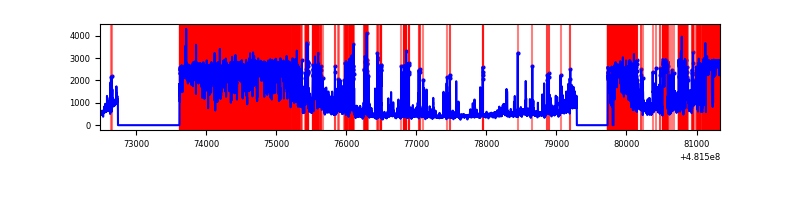 |
Top three noisy pixels from each quadrant. If the there are fewer than three noisy pixels in the level2.evt file, extra rows are filled as -1
| Pixel properties | Quadrant properties | ||||||
|---|---|---|---|---|---|---|---|
| Quadrant | DetID | PixID | Counts | Sigma | Mean | Median | Sigma |
| A | 12 | 3 | 924327 | 4548.89 | 826 | 805 | 203.0 |
| A | 4 | 175 | 499365 | 2455.7 | 826 | 805 | 203.0 |
| A | 8 | 43 | 469420 | 2308.2 | 826 | 805 | 203.0 |
| B | 4 | 81 | 2946284 | 18225.12 | 743 | 714 | 161.6 |
| B | 10 | 254 | 1794036 | 11095.82 | 743 | 714 | 161.6 |
| B | 2 | 208 | 985903 | 6095.66 | 743 | 714 | 161.6 |
| C | 12 | 252 | 435446 | 1941.28 | 820 | 815 | 223.9 |
| C | 3 | 233 | 258516 | 1151.02 | 820 | 815 | 223.9 |
| C | 12 | 247 | 191569 | 852.0 | 820 | 815 | 223.9 |
| D | 8 | 176 | 5437787 | 27402.28 | 716 | 693 | 198.4 |
| D | 11 | 176 | 867376 | 4367.98 | 716 | 693 | 198.4 |
| D | 2 | 216 | 141040 | 707.33 | 716 | 693 | 198.4 |
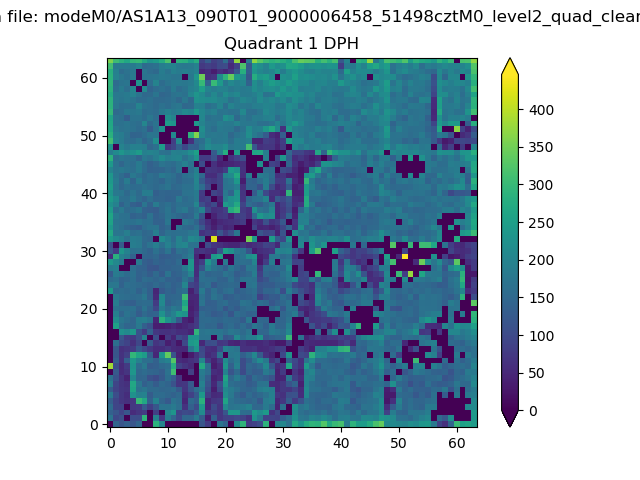
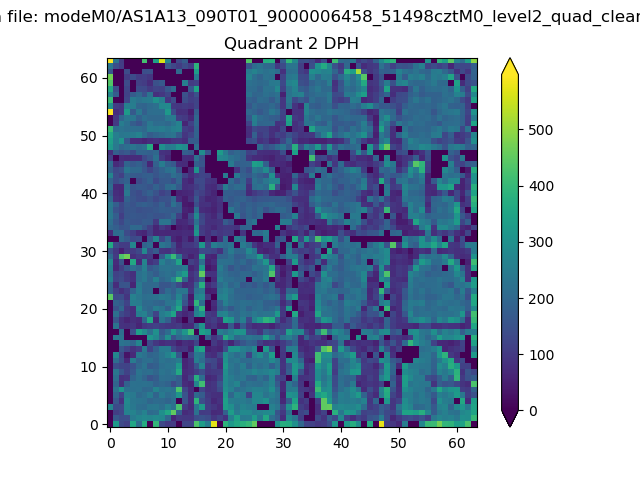
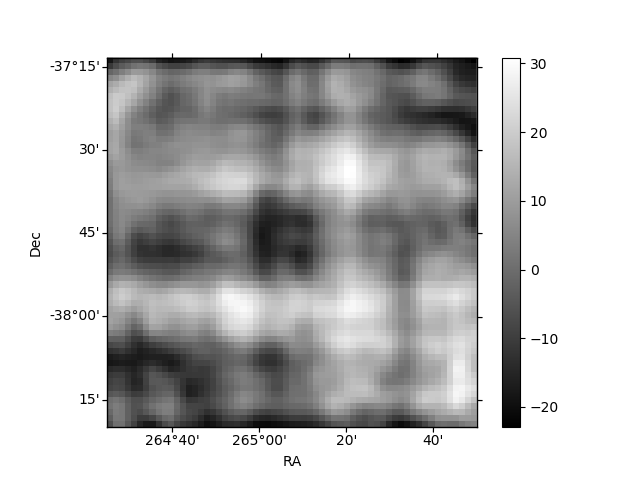
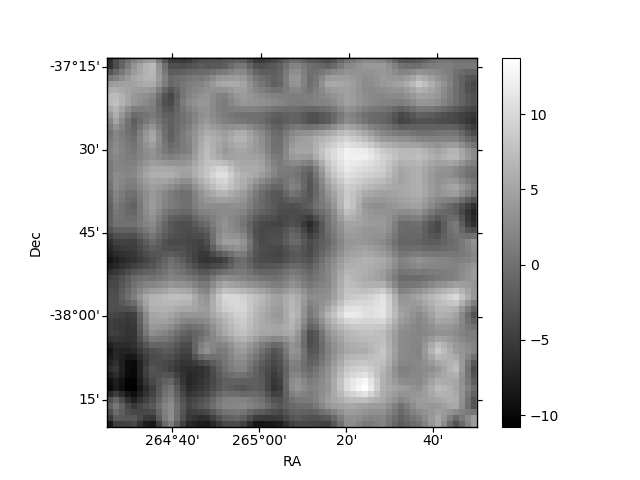
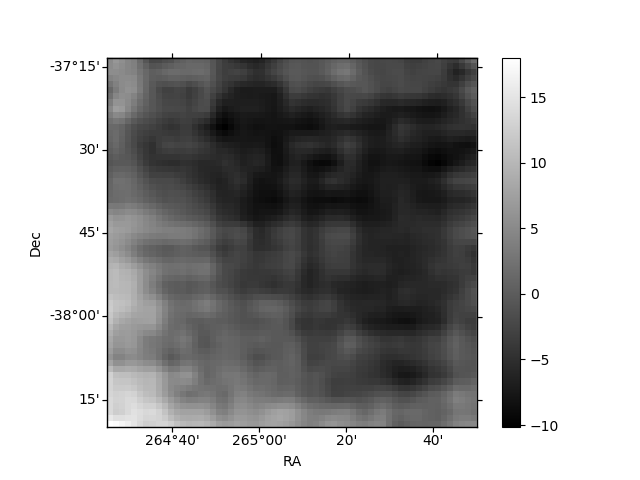
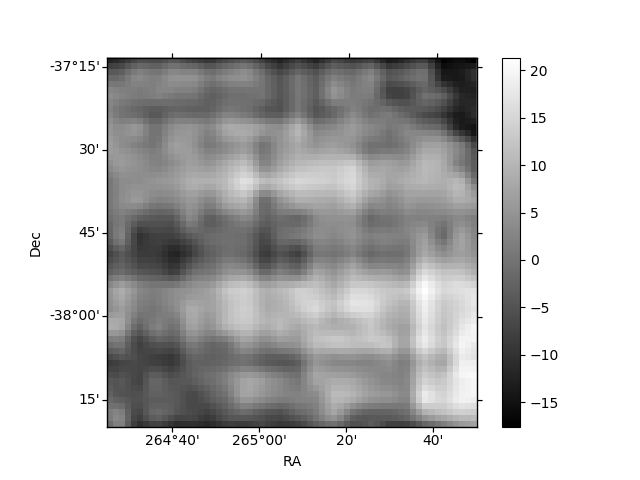
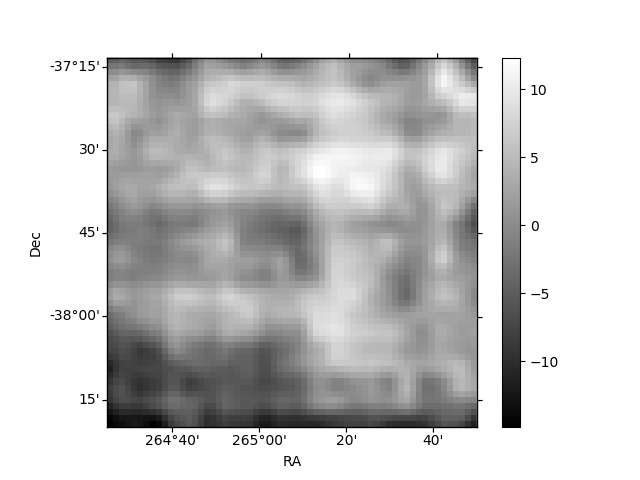
Histogram calculated using DETX and DETY for each event in the final _common_clean file
| Quadrant A |  |
 |
Quadrant B |
|---|---|---|---|
| Quadrant D | 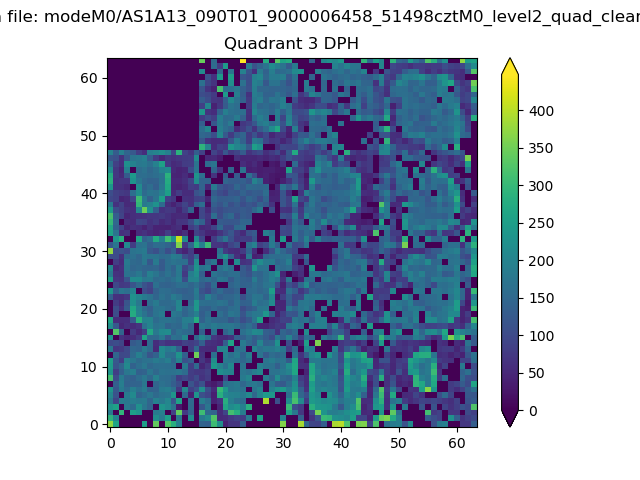 |
 |
Quadrant C |
| Plot type | Count rate plots | Images |
|---|---|---|
| Comparison with Poisson distribution Blue bars denote a histogram of data divided into 1 sec bins. Red curve is a Poisson curve with rate = median count rate of data. |
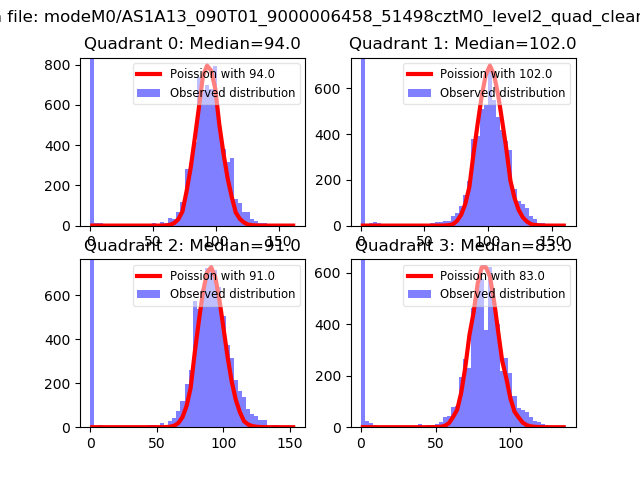 |
 |
| Quadrant-wise count rates Data is divided into 100 sec bins |
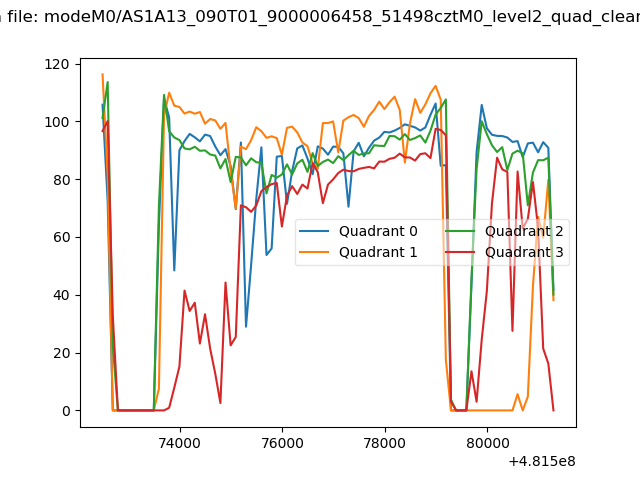 |
|
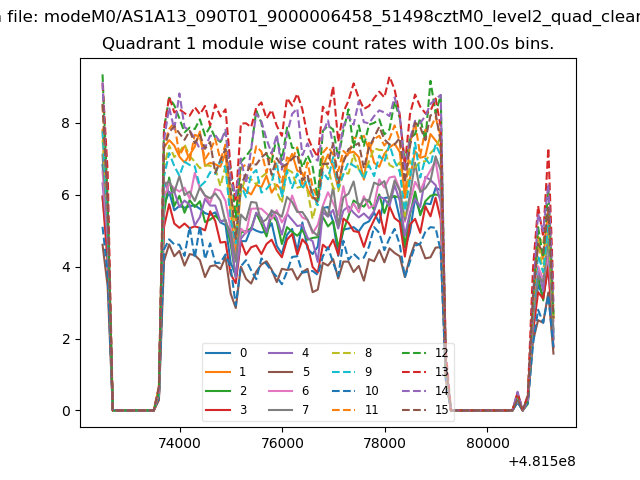
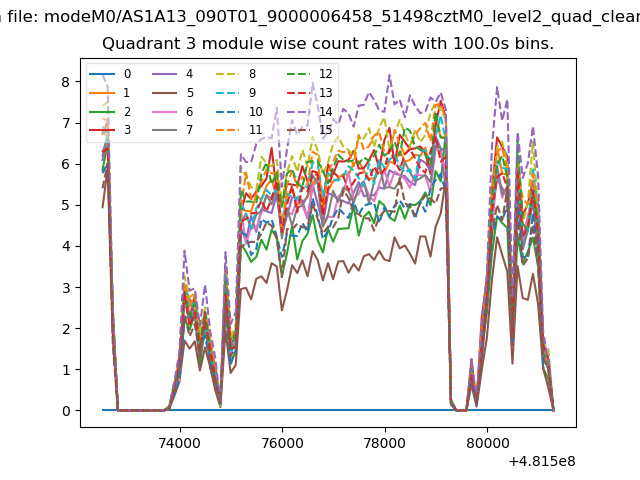
| Module-wise count rates for Quadrant A Data is divided into 100 sec bins |
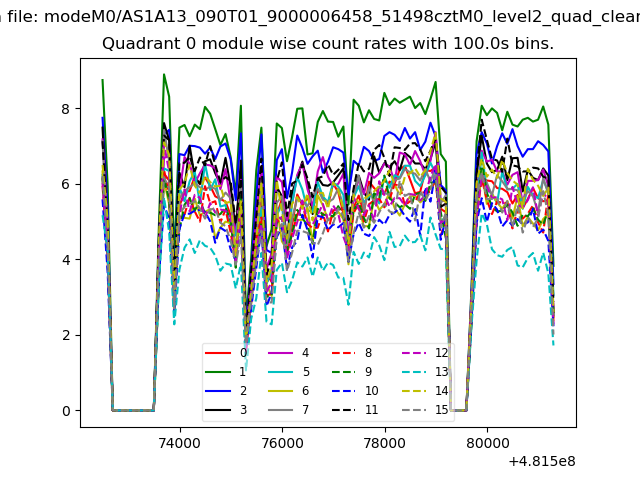 |
 |
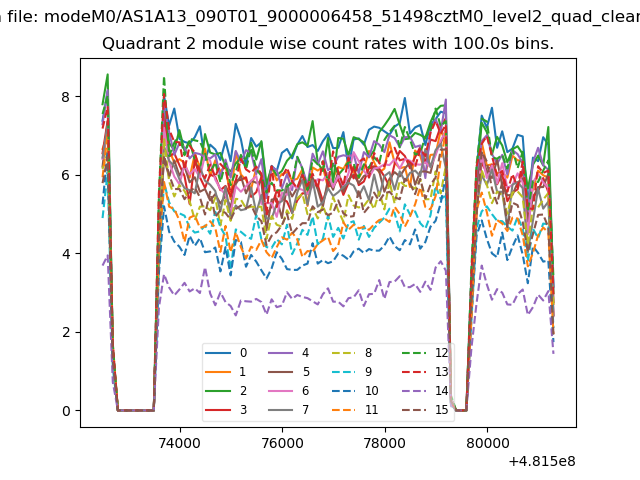
| Module-wise count rates for Quadrant B Data is divided into 100 sec bins |
 |
 |
| Module-wise count rates for Quadrant C Data is divided into 100 sec bins |
 |
 |
| Module-wise count rates for Quadrant D Data is divided into 100 sec bins |
 |
 |
| Parameter | Plot |
|---|---|
| CZT HV Monitor | 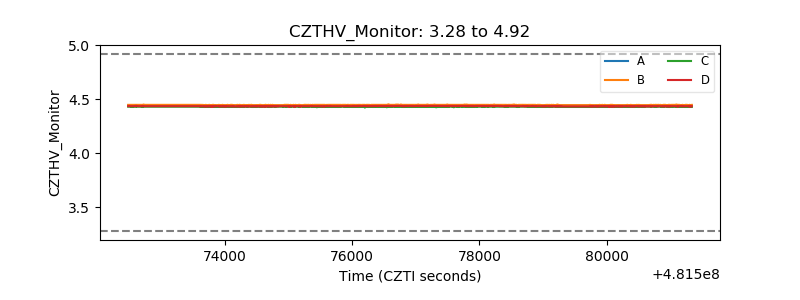 |
| D_VDD | 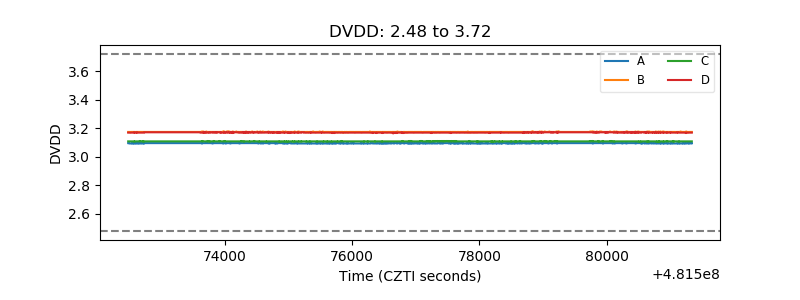 |
| Temperature 1 | 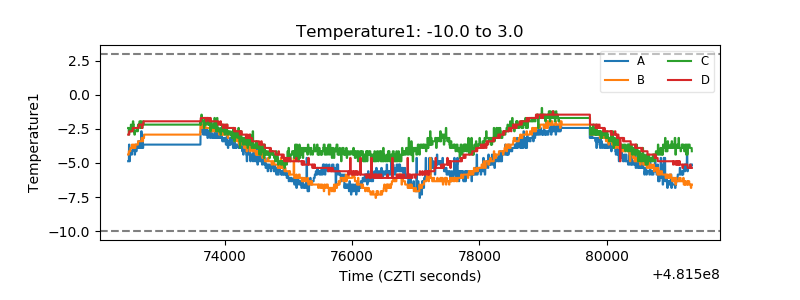 |
| Veto HV Monitor | 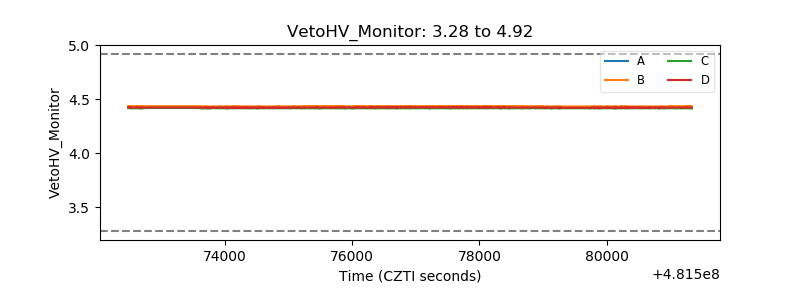 |
| Veto LLD | 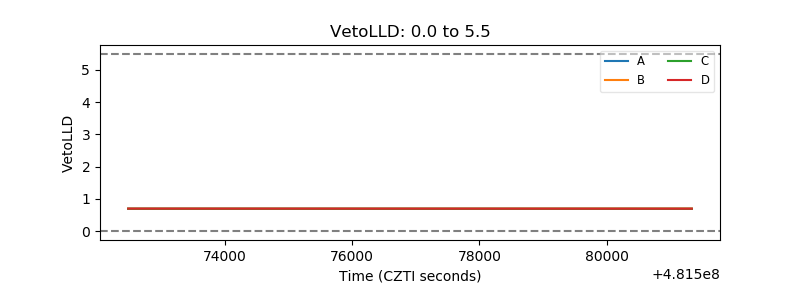 |
| Alpha Counter | 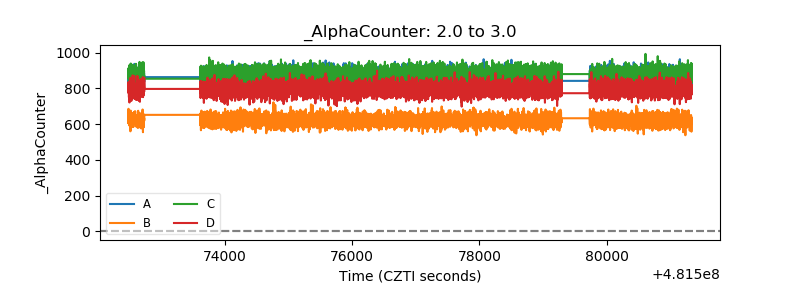 |
| _CPM_Rate | 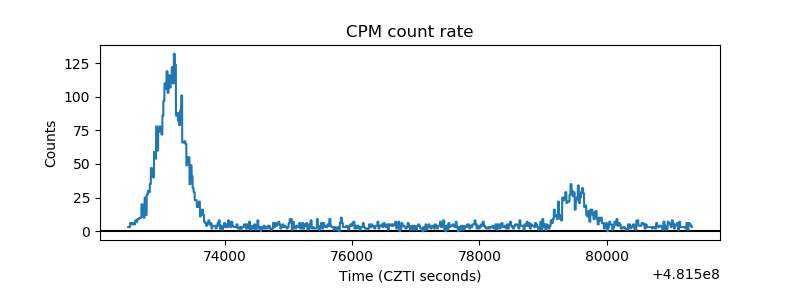 |
| CZT Counter | 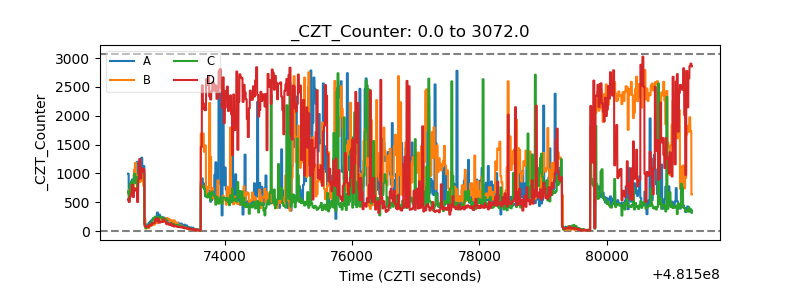 |
| +2.5 Volts monitor | 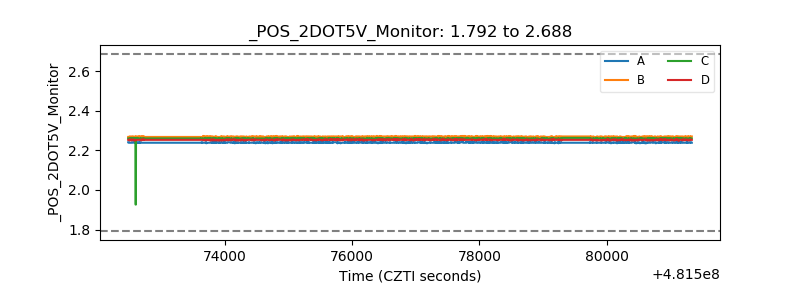 |
| +5 Volts monitor | 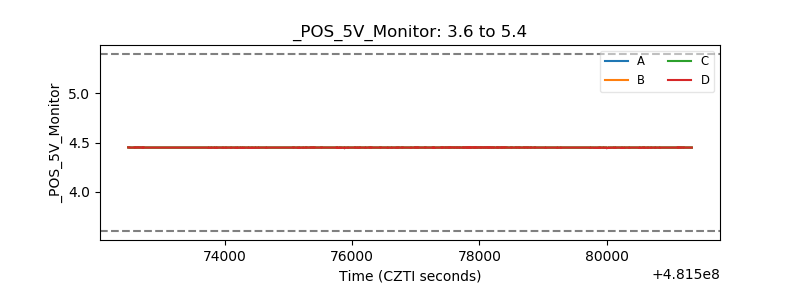 |
| _ROLL_ROT | 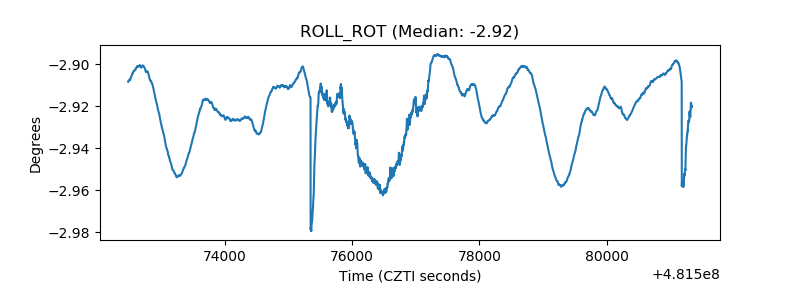 |
| _Roll_DEC | 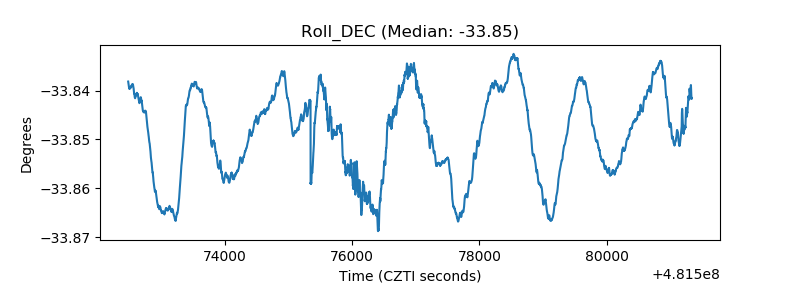 |
| _Roll_RA | 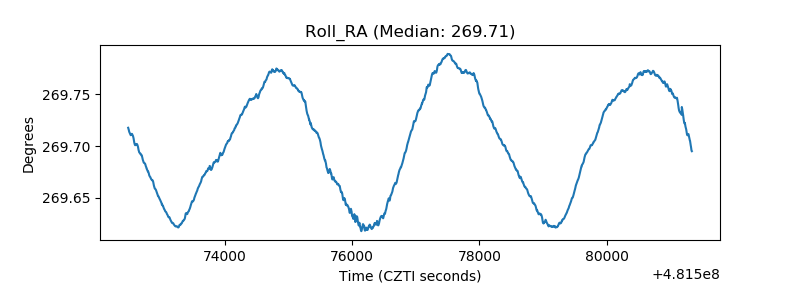 |
| Veto Counter | 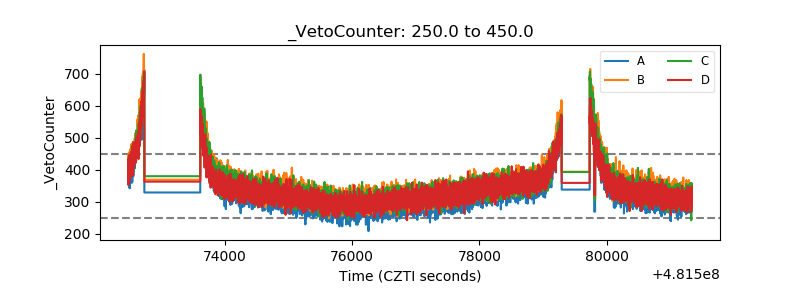 |