| Param | Original file | Final file |
|---|---|---|
| Filename | modeM0/AS1A13_090T01_9000006458_51499cztM0_level2.fits | modeM0/AS1A13_090T01_9000006458_51499cztM0_level2_quad_clean.evt |
| Size (bytes) | 1,128,689,280 | 89,593,920 |
| Size | 1.1 GB | 85.4 MB |
| Events in quadrant A | 6,712,026 | 699,217 |
| Events in quadrant B | 14,029,652 | 414,928 |
| Events in quadrant C | 4,644,194 | 709,787 |
| Events in quadrant D | 15,780,667 | 335,567 |
| Mode M0 | |||
|---|---|---|---|
| Quadrant | BADHDUFLAG | Total packets | Discarded packets |
| A | 0 | 25437 | 1 |
| B | 0 | 47086 | 1 |
| C | 0 | 19463 | 1 |
| D | 0 | 52373 | 1 |
| Mode M9 | |||
|---|---|---|---|
| Quadrant | BADHDUFLAG | Total packets | Discarded packets |
| A | 1 | 140505114794024 | 140501265154094 |
| B | 1 | -1 | -1 |
| C | 1 | -1 | -1 |
| D | 1 | -1 | -1 |
| Mode SS | |||
|---|---|---|---|
| Quadrant | BADHDUFLAG | Total packets | Discarded packets |
| A | 0 | 158 | 0 |
| B | 0 | 158 | 0 |
| C | 0 | 158 | 0 |
| D | 0 | 158 | 0 |
| Quadrant | Total seconds | Saturated seconds | Saturation percentage |
|---|---|---|---|
| A | 7956 | 802 | 10.080442% |
| B | 7956 | 4275 | 53.733032% |
| C | 7956 | 239 | 3.004022% |
| D | 7956 | 4302 | 54.072398% |
Noise dominated data is calculated using 1-second bins in cleaned event files. If a bin has >2000 counts, and if more than 50% of those come from <1% of pixels, then it is considered to be noise-dominated and hence unusable.
| Quadrant | # 1 sec bins | Bins with >0 counts | Bins with >2000 counts | High rate bins dominated by noise | Noise dominated (total time) | Noise dominated (detector-on time) | Marked lightcurve |
|---|---|---|---|---|---|---|---|
| A | 7976 | 7961 | 531 | 531 | 6.66% | 6.67% | 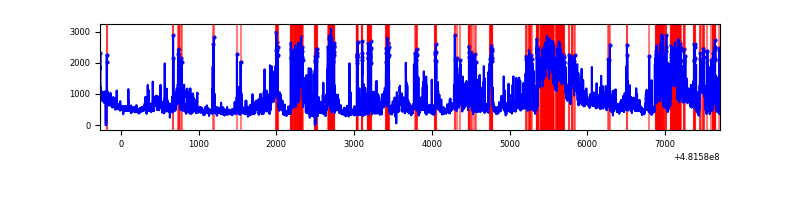 |
| B | 7976 | 7961 | 3665 | 3665 | 45.95% | 46.04% | 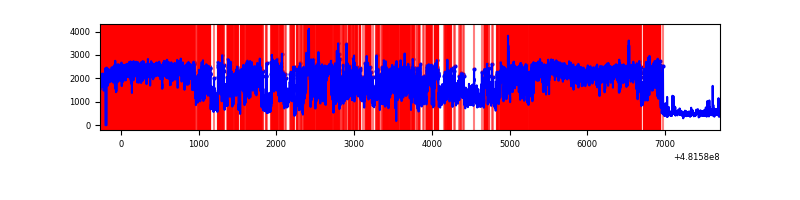 |
| C | 7976 | 7961 | 190 | 190 | 2.38% | 2.39% | 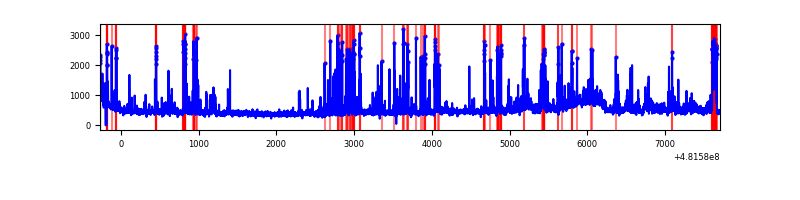 |
| D | 7976 | 7960 | 4574 | 4574 | 57.35% | 57.46% | 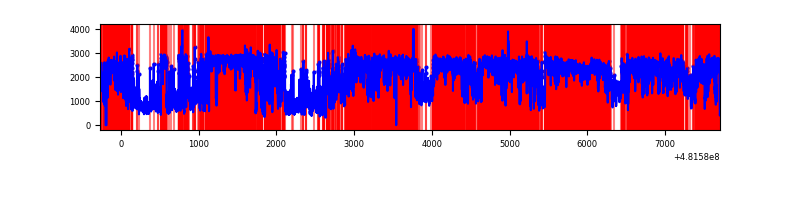 |
Top three noisy pixels from each quadrant. If the there are fewer than three noisy pixels in the level2.evt file, extra rows are filled as -1
| Pixel properties | Quadrant properties | ||||||
|---|---|---|---|---|---|---|---|
| Quadrant | DetID | PixID | Counts | Sigma | Mean | Median | Sigma |
| A | 12 | 250 | 966995 | 4670.42 | 838 | 818 | 206.9 |
| A | 12 | 3 | 499210 | 2409.19 | 838 | 818 | 206.9 |
| A | 12 | 194 | 353330 | 1704.01 | 838 | 818 | 206.9 |
| B | 4 | 81 | 10257436 | 72077.14 | 662 | 639 | 142.3 |
| B | 2 | 208 | 311421 | 2183.94 | 662 | 639 | 142.3 |
| B | 15 | 52 | 184307 | 1290.68 | 662 | 639 | 142.3 |
| C | 13 | 3 | 338428 | 1446.57 | 845 | 838 | 233.4 |
| C | 12 | 252 | 194835 | 831.27 | 845 | 838 | 233.4 |
| C | 3 | 233 | 167785 | 715.37 | 845 | 838 | 233.4 |
| D | 8 | 176 | 11964513 | 66065.91 | 647 | 623 | 181.1 |
| D | 11 | 176 | 767399 | 4234.22 | 647 | 623 | 181.1 |
| D | 2 | 216 | 194630 | 1071.33 | 647 | 623 | 181.1 |
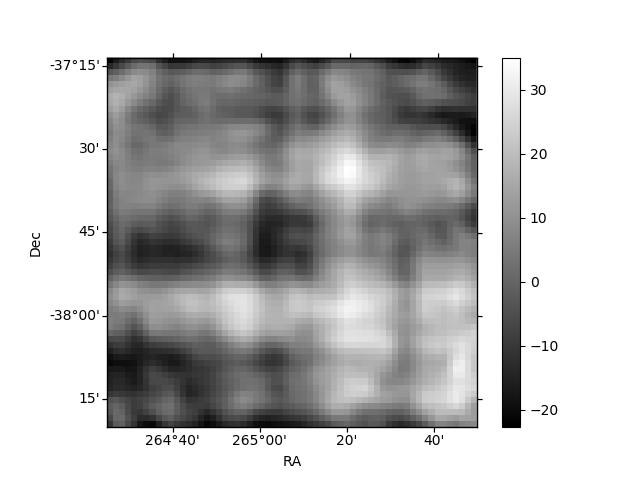
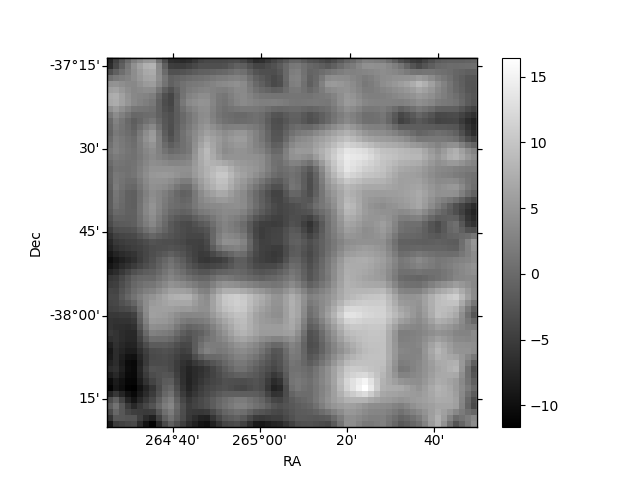
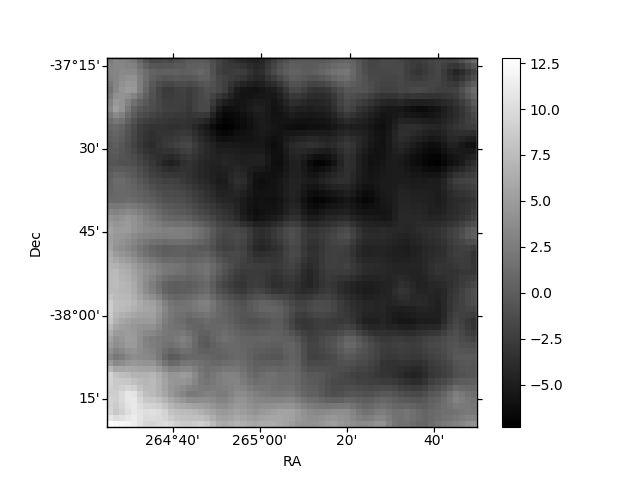
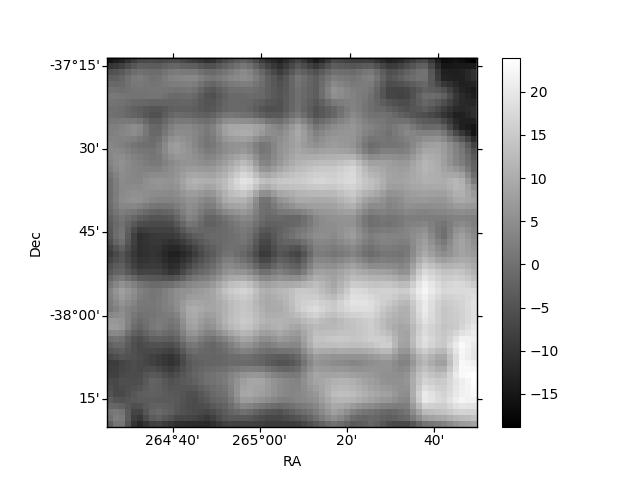
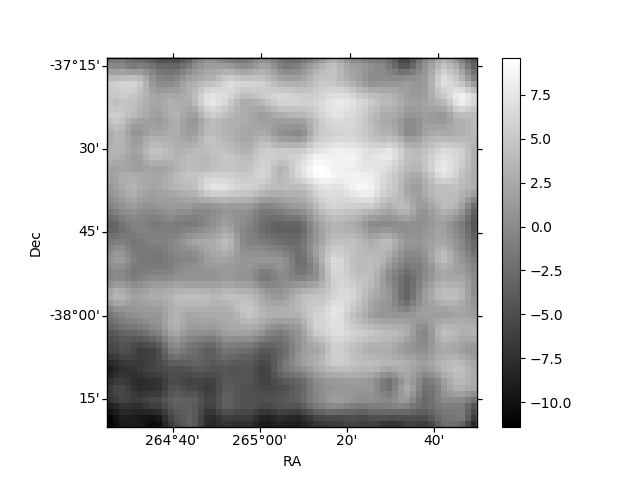
Histogram calculated using DETX and DETY for each event in the final _common_clean file
| Quadrant A | 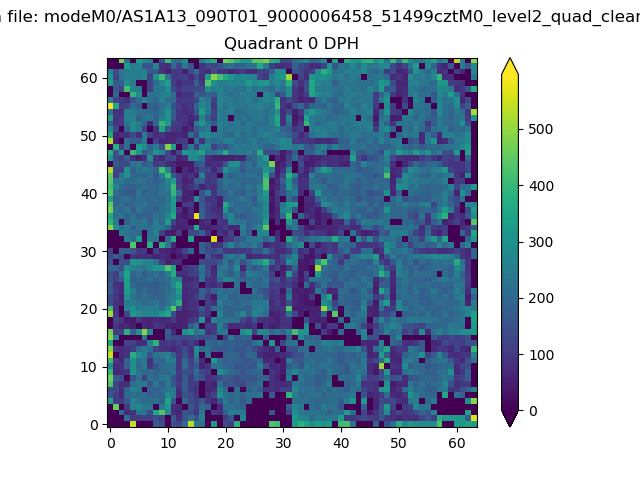 |
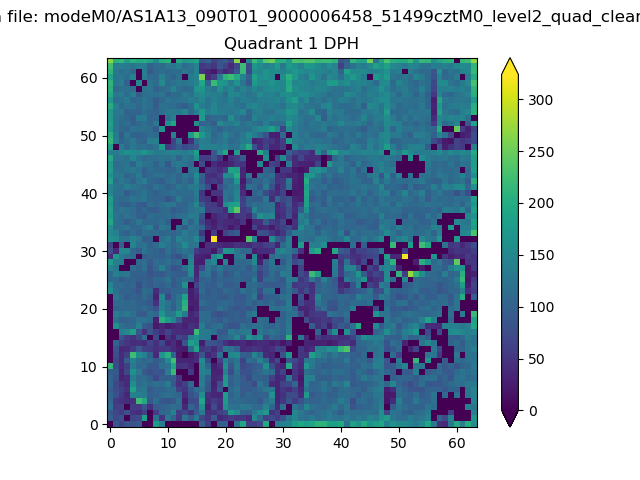 |
Quadrant B |
|---|---|---|---|
| Quadrant D | 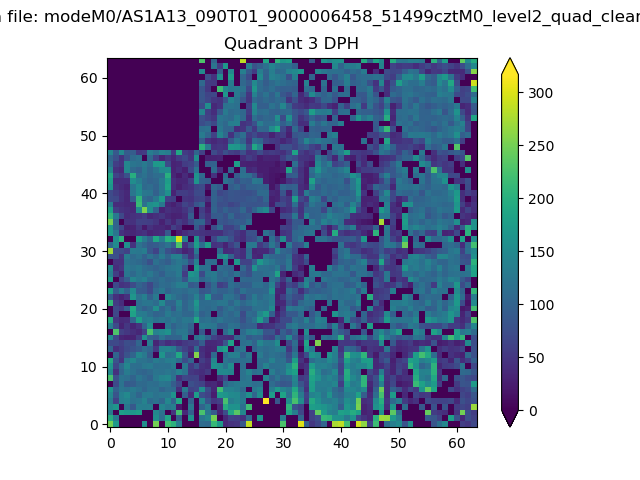 |
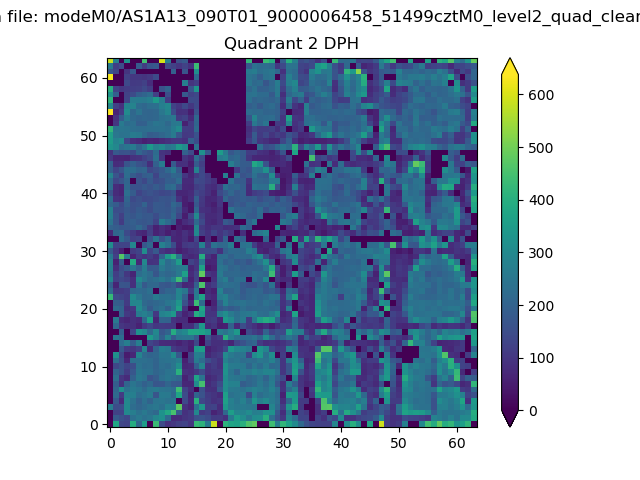 |
Quadrant C |
| Plot type | Count rate plots | Images |
|---|---|---|
| Comparison with Poisson distribution Blue bars denote a histogram of data divided into 1 sec bins. Red curve is a Poisson curve with rate = median count rate of data. |
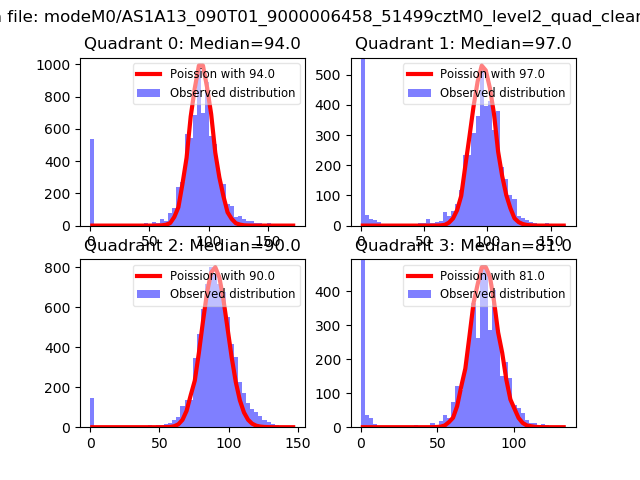 |
 |
| Quadrant-wise count rates Data is divided into 100 sec bins |
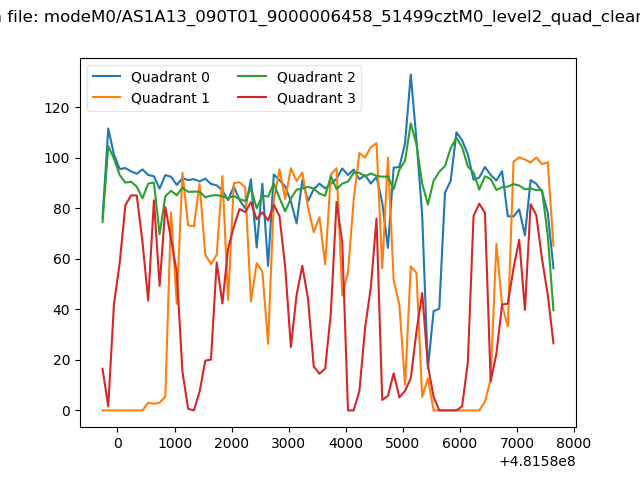 |
|
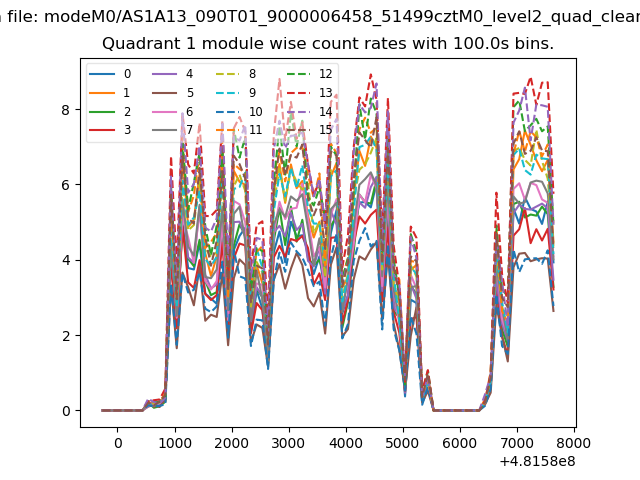
| Module-wise count rates for Quadrant A Data is divided into 100 sec bins |
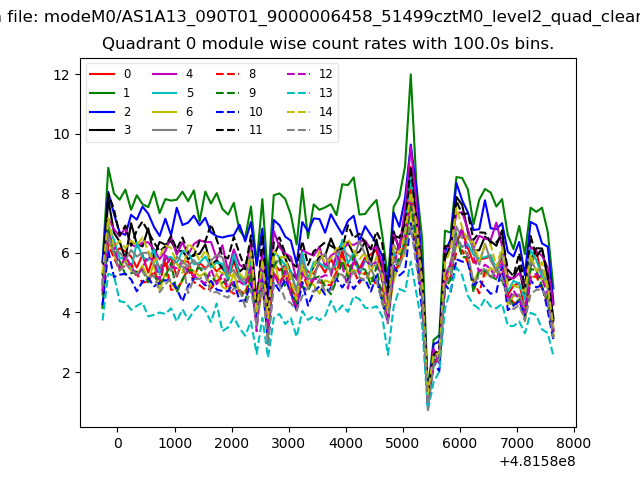 |
 |
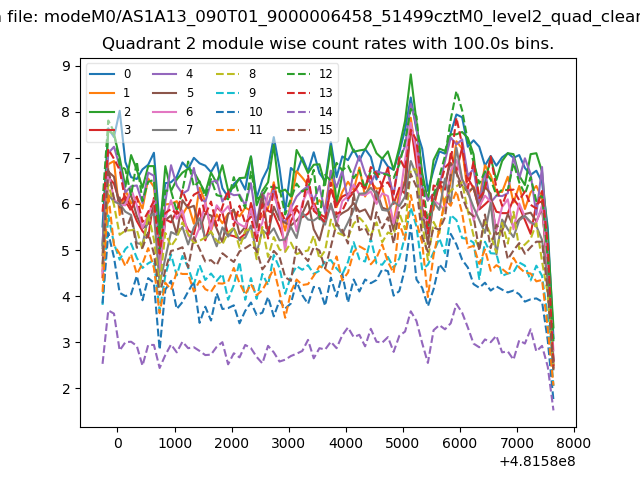
| Module-wise count rates for Quadrant B Data is divided into 100 sec bins |
 |
 |
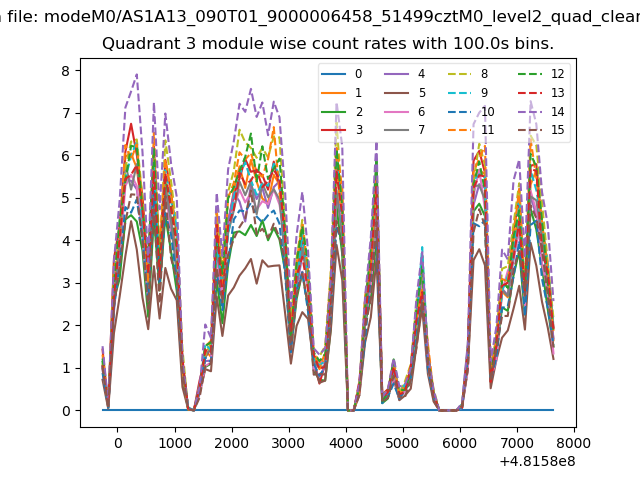
| Module-wise count rates for Quadrant C Data is divided into 100 sec bins |
 |
 |
| Module-wise count rates for Quadrant D Data is divided into 100 sec bins |
 |
 |
| Parameter | Plot |
|---|---|
| CZT HV Monitor | 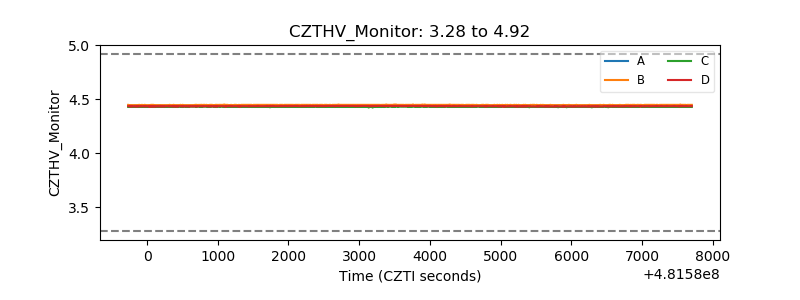 |
| D_VDD | 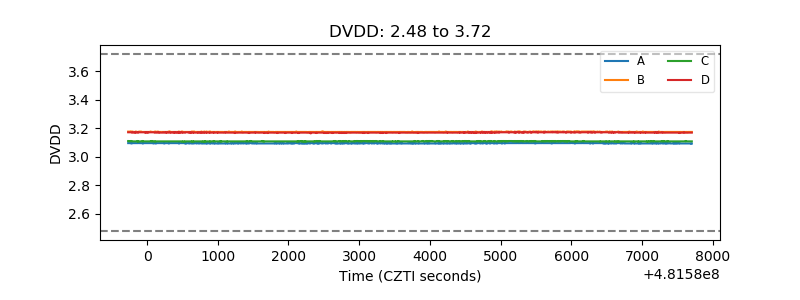 |
| Temperature 1 | 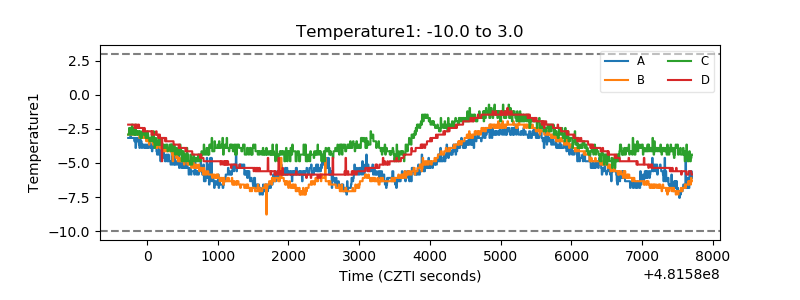 |
| Veto HV Monitor | 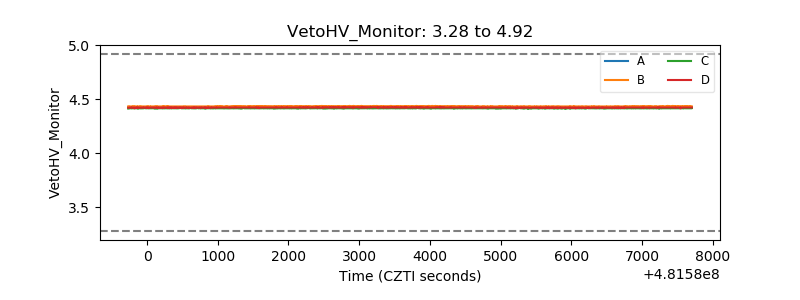 |
| Veto LLD | 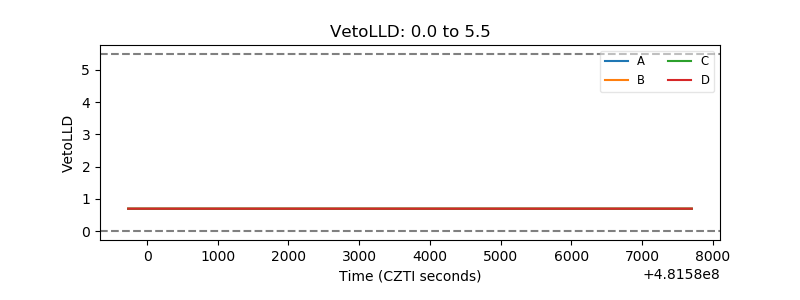 |
| Alpha Counter | 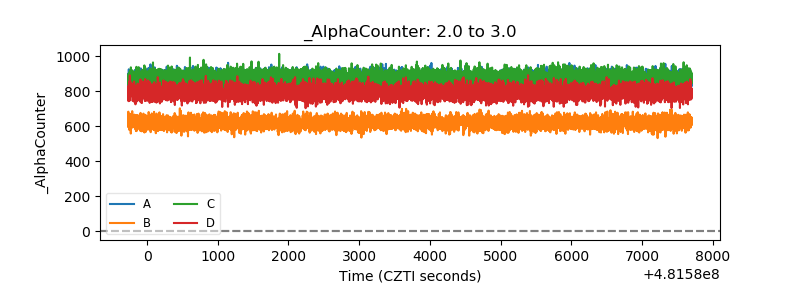 |
| _CPM_Rate | 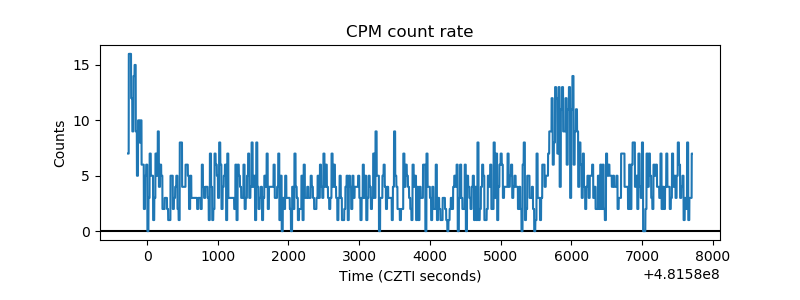 |
| CZT Counter | 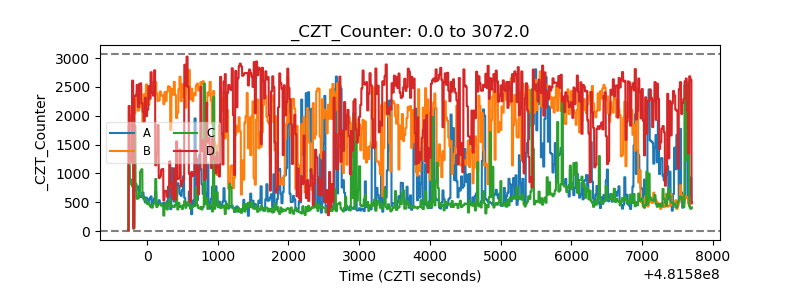 |
| +2.5 Volts monitor | 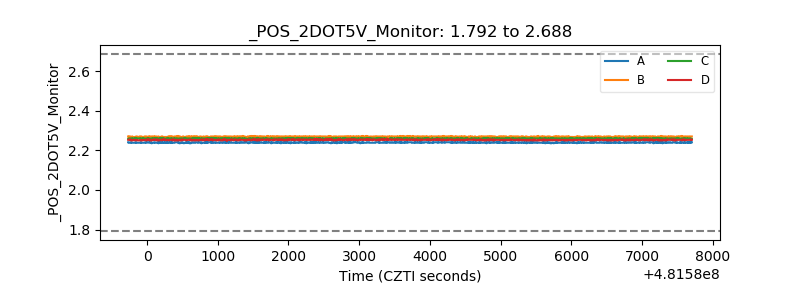 |
| +5 Volts monitor | 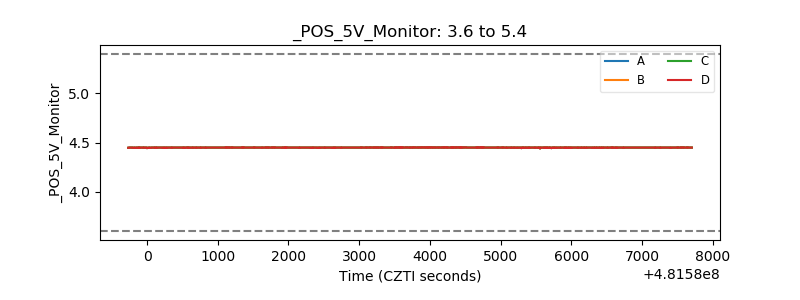 |
| _ROLL_ROT | 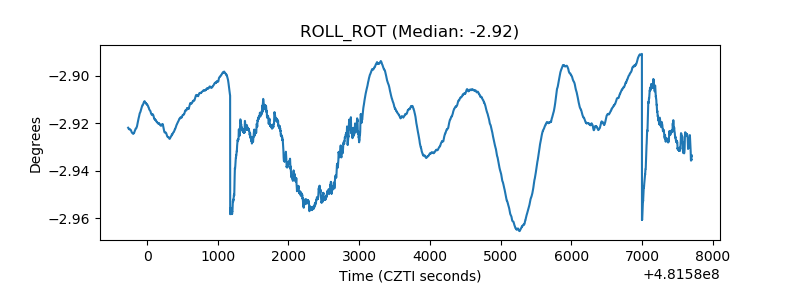 |
| _Roll_DEC | 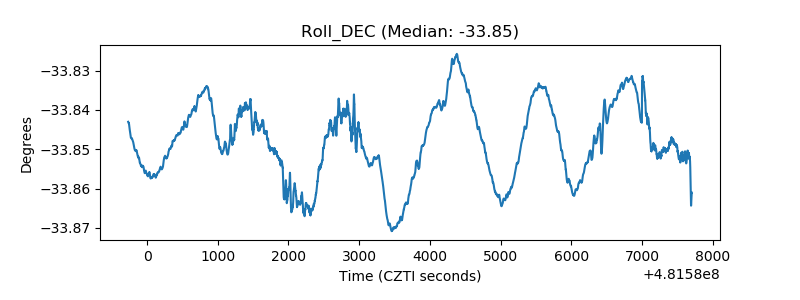 |
| _Roll_RA | 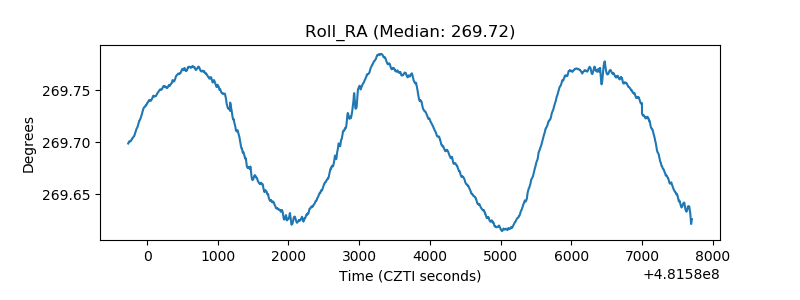 |
| Veto Counter | 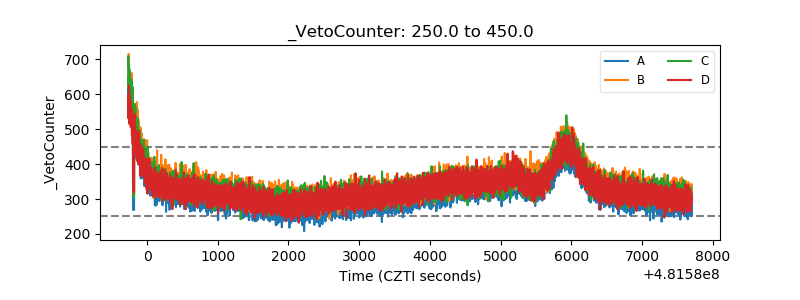 |