| Param | Original file | Final file |
|---|---|---|
| Filename | modeM0/AS1A13_090T01_9000006458_51505cztM0_level2.fits | modeM0/AS1A13_090T01_9000006458_51505cztM0_level2_quad_clean.evt |
| Size (bytes) | 2,395,108,800 | 228,882,240 |
| Size | 2.2 GB | 218.3 MB |
| Events in quadrant A | 16,672,241 | 1,625,266 |
| Events in quadrant B | 35,012,362 | 937,980 |
| Events in quadrant C | 14,649,959 | 1,624,273 |
| Events in quadrant D | 20,830,547 | 1,404,552 |
| Mode M0 | |||
|---|---|---|---|
| Quadrant | BADHDUFLAG | Total packets | Discarded packets |
| A | 0 | 62893 | 3 |
| B | 0 | 117383 | 3 |
| C | 0 | 56722 | 3 |
| D | 0 | 75305 | 10 |
| Mode M9 | |||
|---|---|---|---|
| Quadrant | BADHDUFLAG | Total packets | Discarded packets |
| A | 0 | 7 | 0 |
| B | 0 | 7 | 0 |
| C | 0 | 7 | 0 |
| D | 0 | 7 | 0 |
| Mode SS | |||
|---|---|---|---|
| Quadrant | BADHDUFLAG | Total packets | Discarded packets |
| A | 0 | 394 | 0 |
| B | 0 | 394 | 0 |
| C | 0 | 394 | 0 |
| D | 0 | 394 | 0 |
| Quadrant | Total seconds | Saturated seconds | Saturation percentage |
|---|---|---|---|
| A | 19405 | 2196 | 11.316671% |
| B | 19406 | 10821 | 55.761105% |
| C | 19406 | 1457 | 7.507987% |
| D | 19405 | 2366 | 12.192734% |
Noise dominated data is calculated using 1-second bins in cleaned event files. If a bin has >2000 counts, and if more than 50% of those come from <1% of pixels, then it is considered to be noise-dominated and hence unusable.
| Quadrant | # 1 sec bins | Bins with >0 counts | Bins with >2000 counts | High rate bins dominated by noise | Noise dominated (total time) | Noise dominated (detector-on time) | Marked lightcurve |
|---|---|---|---|---|---|---|---|
| A | 20030 | 19407 | 1619 | 1619 | 8.08% | 8.34% | 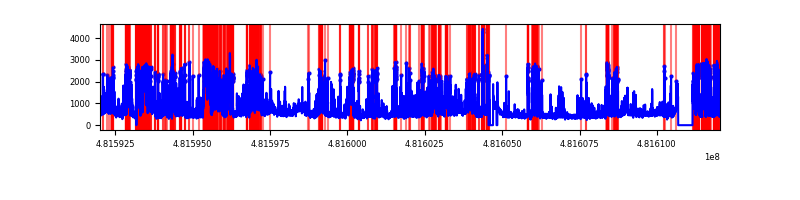 |
| B | 20031 | 19406 | 9446 | 9446 | 47.16% | 48.68% | 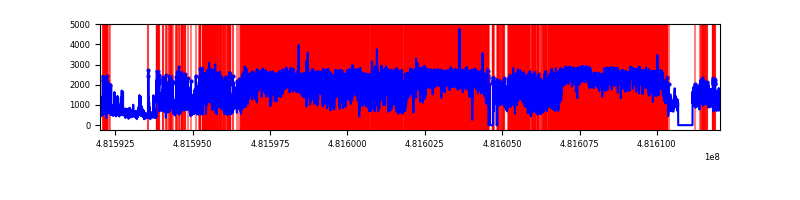 |
| C | 20031 | 19407 | 1174 | 1174 | 5.86% | 6.05% | 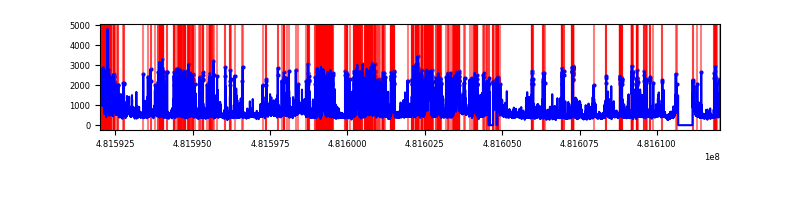 |
| D | 20031 | 19406 | 2259 | 2259 | 11.28% | 11.64% | 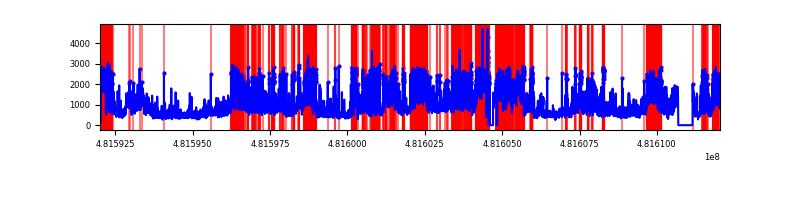 |
Top three noisy pixels from each quadrant. If the there are fewer than three noisy pixels in the level2.evt file, extra rows are filled as -1
| Pixel properties | Quadrant properties | ||||||
|---|---|---|---|---|---|---|---|
| Quadrant | DetID | PixID | Counts | Sigma | Mean | Median | Sigma |
| A | 12 | 250 | 3060386 | 6157.54 | 2028 | 1977 | 496.7 |
| A | 15 | 174 | 1319870 | 2653.33 | 2028 | 1977 | 496.7 |
| A | 8 | 43 | 1307331 | 2628.09 | 2028 | 1977 | 496.7 |
| B | 4 | 81 | 26129760 | 76835.51 | 1586 | 1528 | 340.1 |
| B | 2 | 208 | 773936 | 2271.43 | 1586 | 1528 | 340.1 |
| B | 0 | 171 | 404014 | 1183.59 | 1586 | 1528 | 340.1 |
| C | 15 | 205 | 2335551 | 4209.73 | 2016 | 2003 | 554.3 |
| C | 12 | 247 | 985598 | 1774.41 | 2016 | 2003 | 554.3 |
| C | 0 | 177 | 915671 | 1648.26 | 2016 | 2003 | 554.3 |
| D | 8 | 176 | 7921275 | 14521.97 | 1954 | 1886 | 545.3 |
| D | 7 | 60 | 1535396 | 2812.03 | 1954 | 1886 | 545.3 |
| D | 6 | 42 | 1462606 | 2678.56 | 1954 | 1886 | 545.3 |
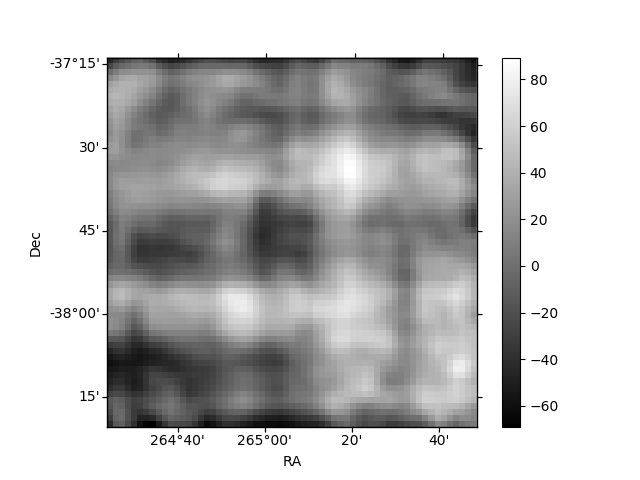
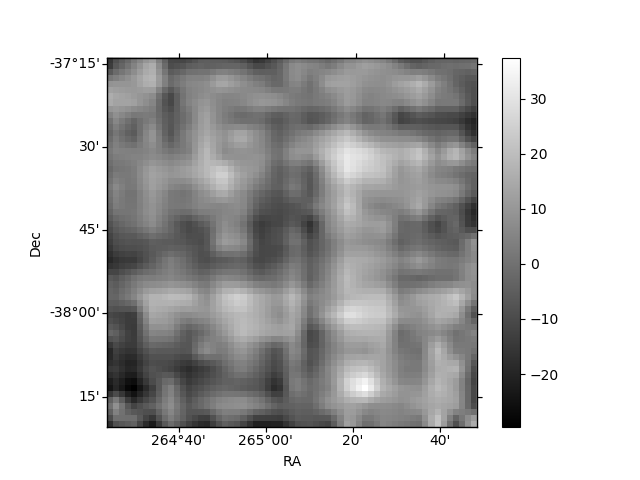
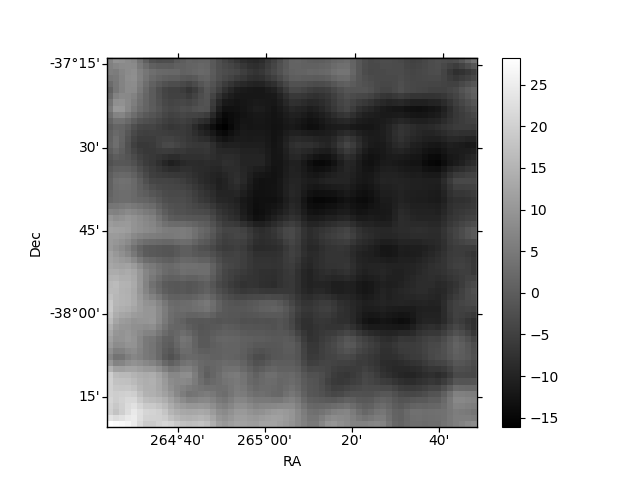
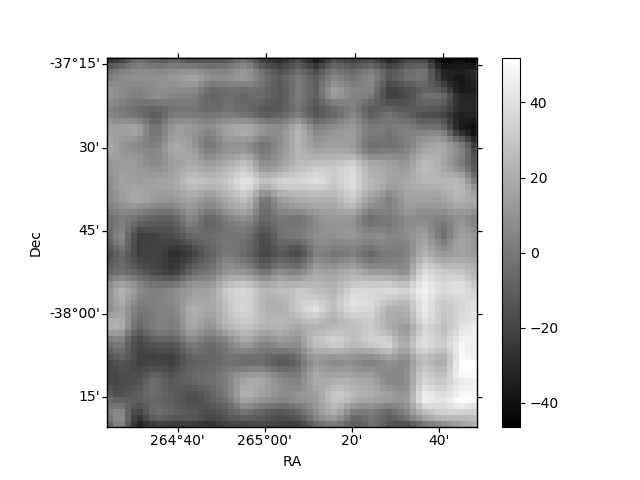
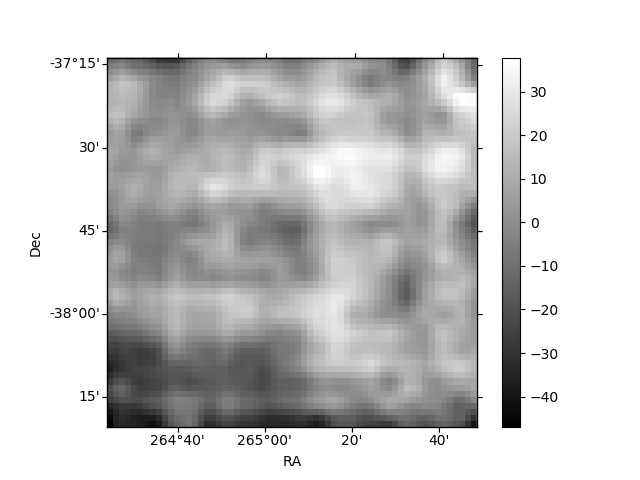
Histogram calculated using DETX and DETY for each event in the final _common_clean file
| Quadrant A | 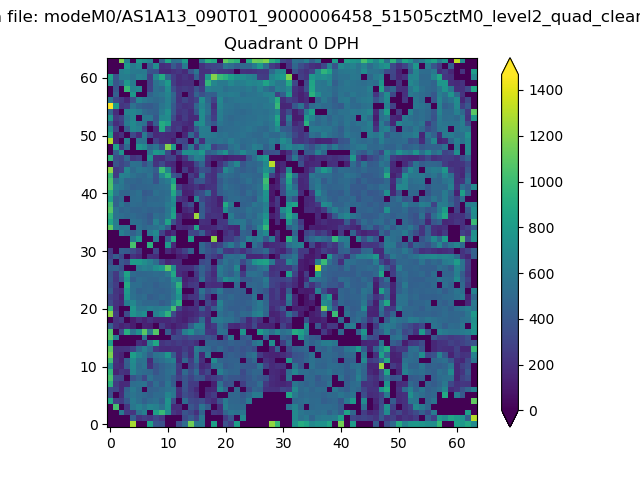 |
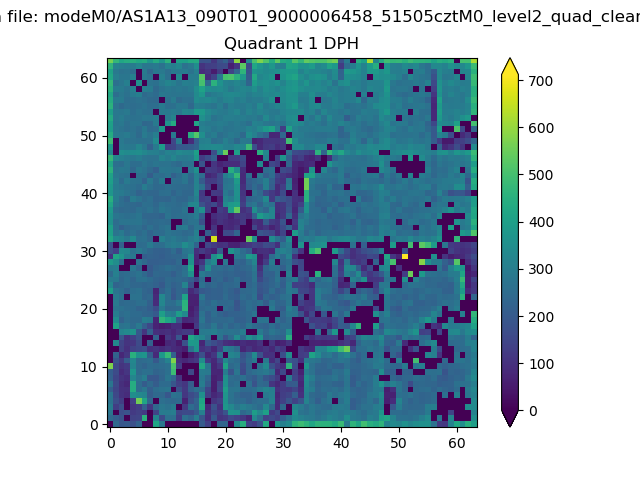 |
Quadrant B |
|---|---|---|---|
| Quadrant D | 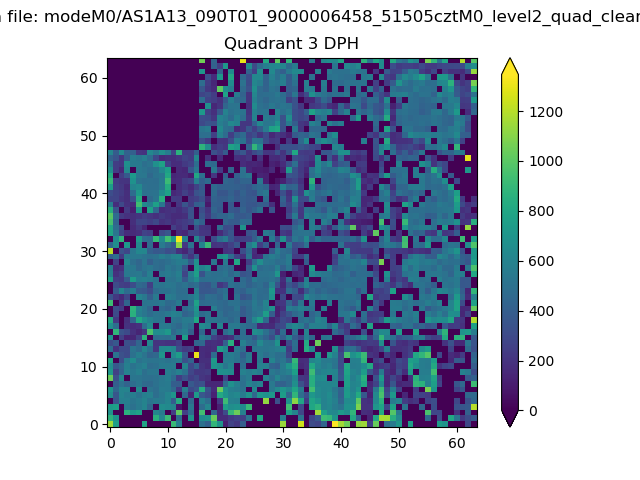 |
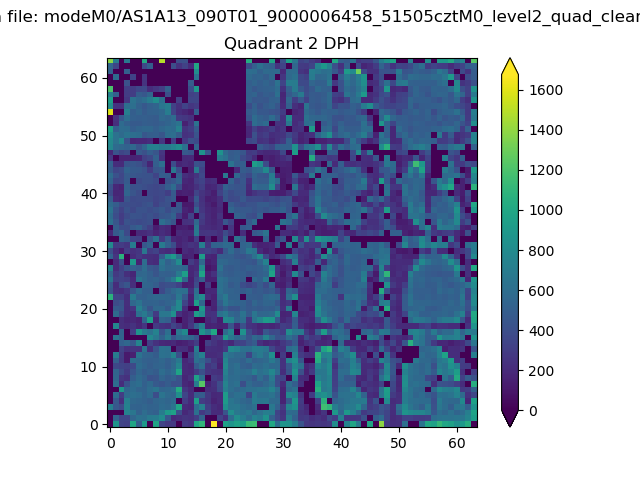 |
Quadrant C |
| Plot type | Count rate plots | Images |
|---|---|---|
| Comparison with Poisson distribution Blue bars denote a histogram of data divided into 1 sec bins. Red curve is a Poisson curve with rate = median count rate of data. |
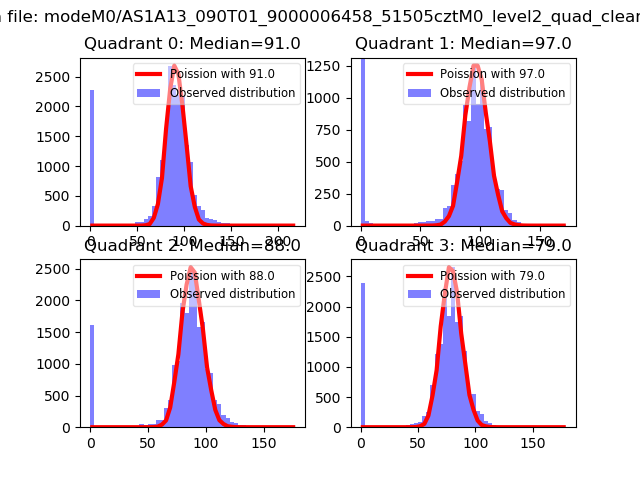 |
 |
| Quadrant-wise count rates Data is divided into 100 sec bins |
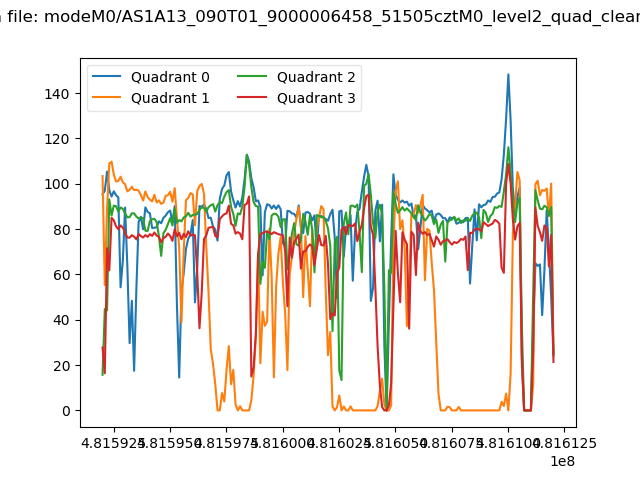 |
|
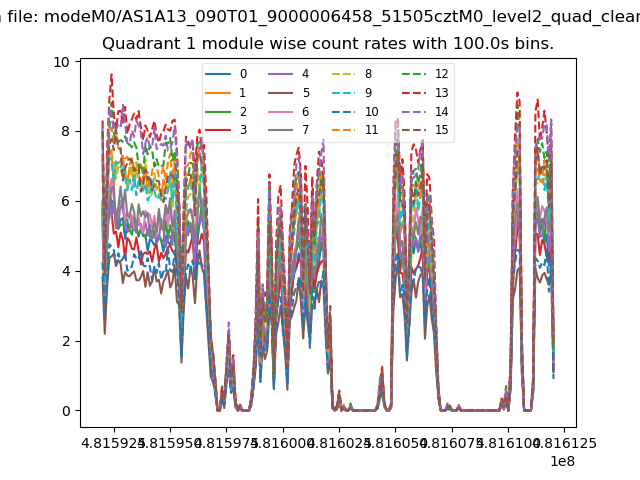
| Module-wise count rates for Quadrant A Data is divided into 100 sec bins |
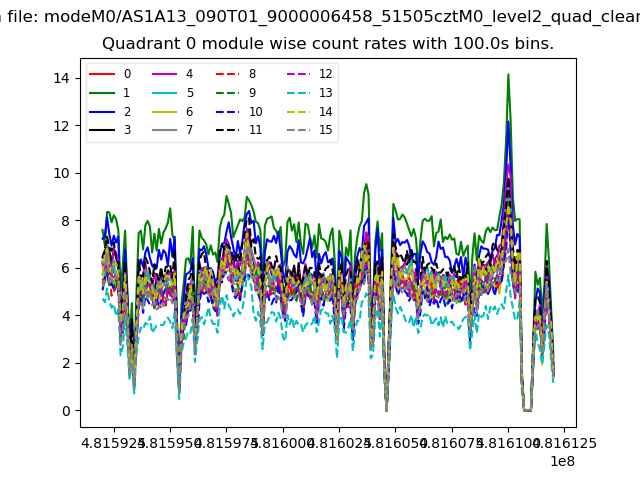 |
 |
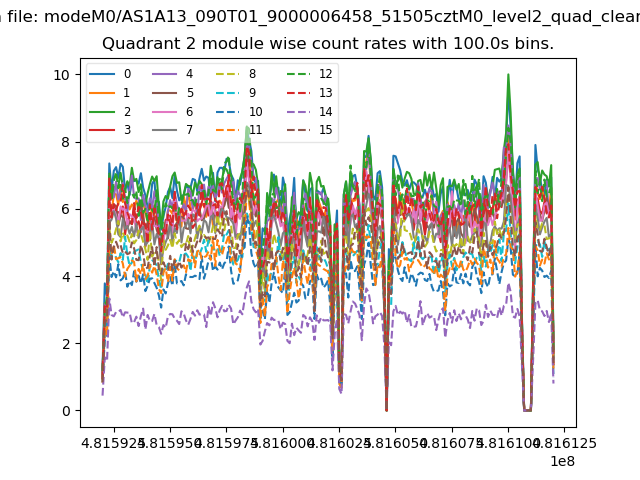
| Module-wise count rates for Quadrant B Data is divided into 100 sec bins |
 |
 |
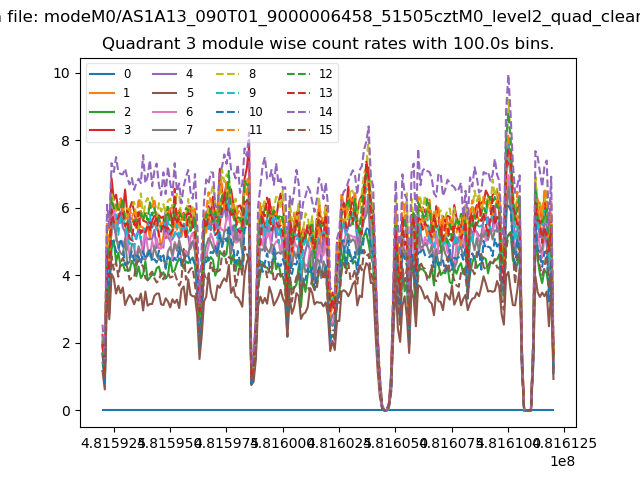
| Module-wise count rates for Quadrant C Data is divided into 100 sec bins |
 |
 |
| Module-wise count rates for Quadrant D Data is divided into 100 sec bins |
 |
 |
| Parameter | Plot |
|---|---|
| CZT HV Monitor | 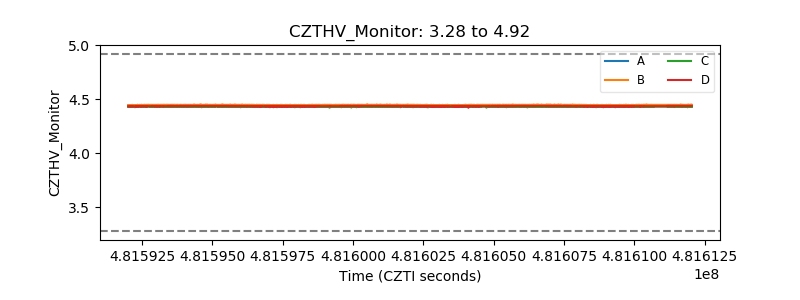 |
| D_VDD | 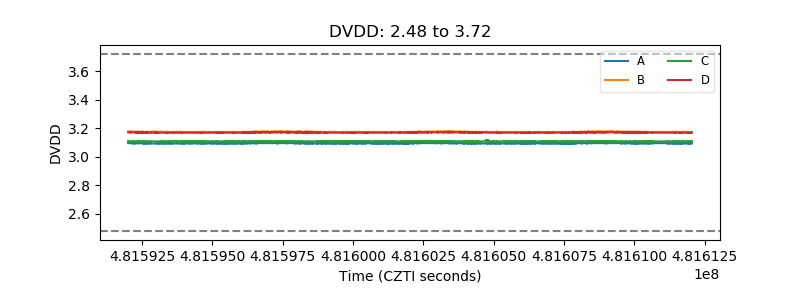 |
| Temperature 1 | 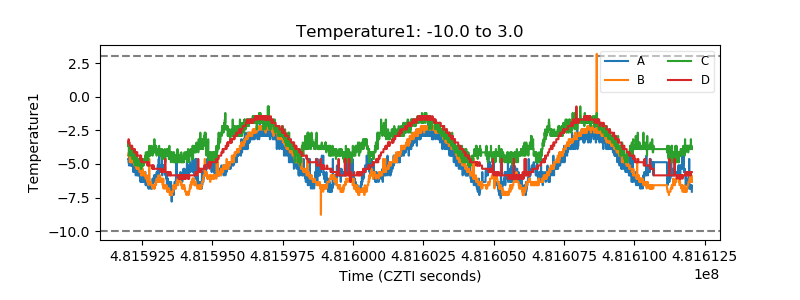 |
| Veto HV Monitor | 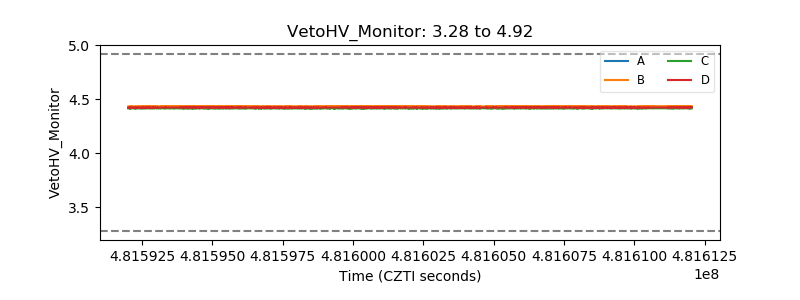 |
| Veto LLD | 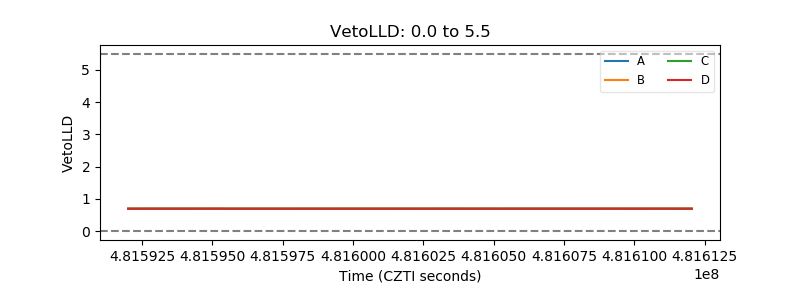 |
| Alpha Counter | 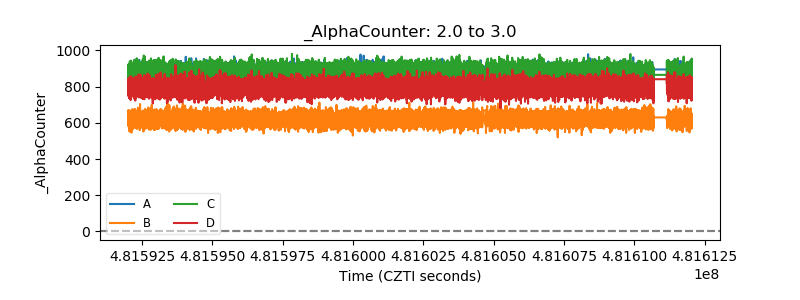 |
| _CPM_Rate | 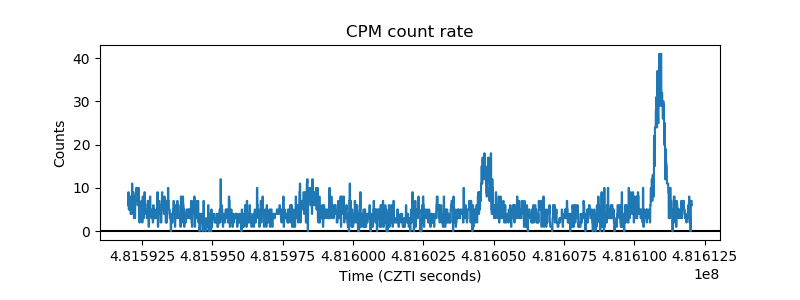 |
| CZT Counter | 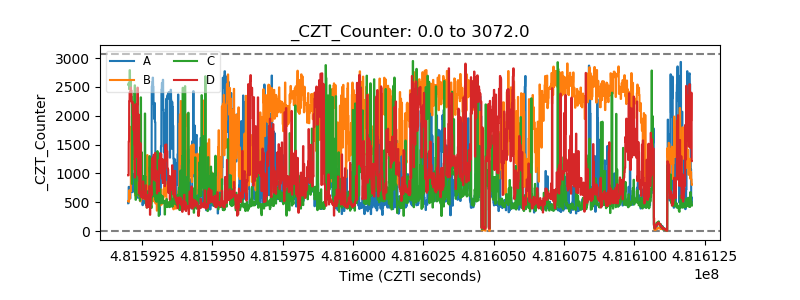 |
| +2.5 Volts monitor | 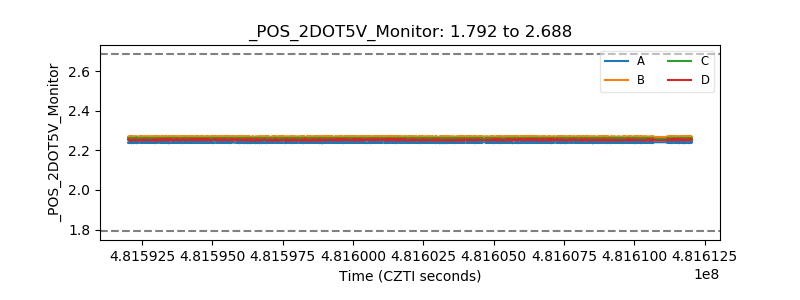 |
| +5 Volts monitor | 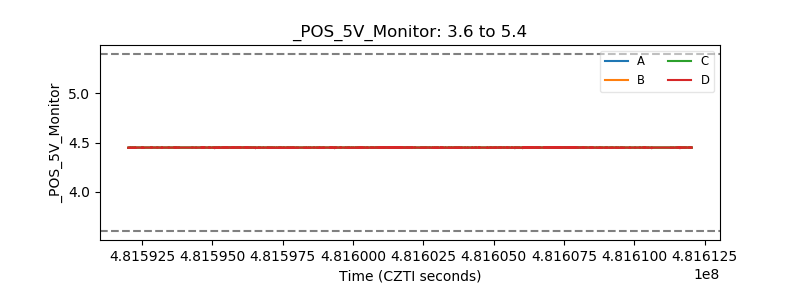 |
| _ROLL_ROT | 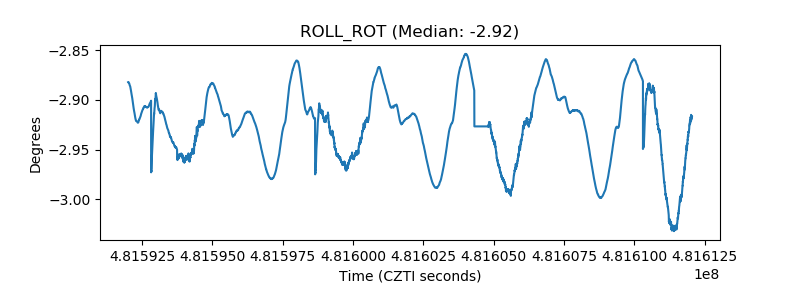 |
| _Roll_DEC | 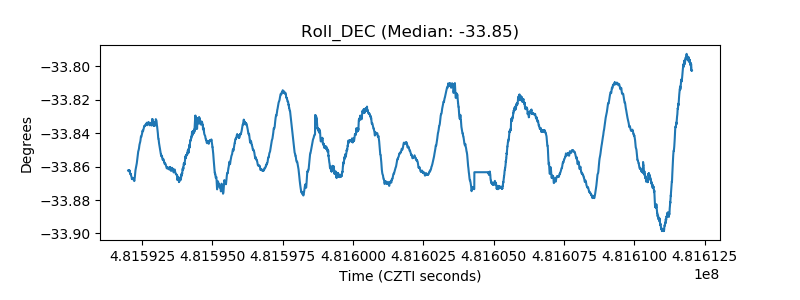 |
| _Roll_RA | 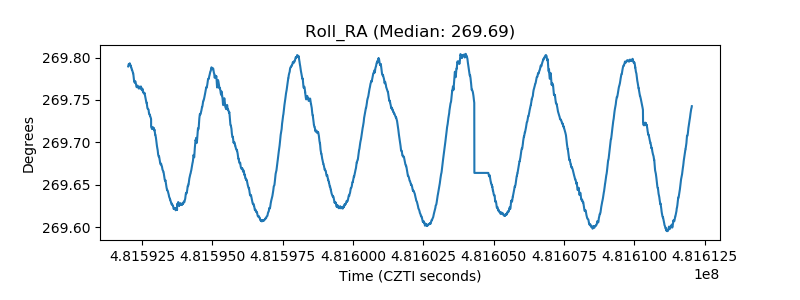 |
| Veto Counter | 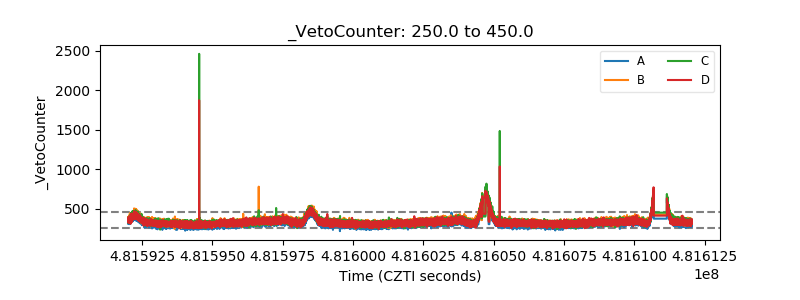 |