| Param | Original file | Final file |
|---|---|---|
| Filename | modeM0/AS1A13_090T01_9000006458_51507cztM0_level2.fits | modeM0/AS1A13_090T01_9000006458_51507cztM0_level2_quad_clean.evt |
| Size (bytes) | 1,836,293,760 | 230,172,480 |
| Size | 1.7 GB | 219.5 MB |
| Events in quadrant A | 13,156,511 | 1,536,298 |
| Events in quadrant B | 20,831,717 | 1,300,380 |
| Events in quadrant C | 10,723,790 | 1,577,508 |
| Events in quadrant D | 21,878,240 | 1,317,732 |
| Mode M0 | |||
|---|---|---|---|
| Quadrant | BADHDUFLAG | Total packets | Discarded packets |
| A | 0 | 50907 | 3 |
| B | 0 | 74041 | 7 |
| C | 0 | 43905 | 3 |
| D | 0 | 77452 | 3 |
| Mode M9 | |||
|---|---|---|---|
| Quadrant | BADHDUFLAG | Total packets | Discarded packets |
| A | 0 | 25 | 0 |
| B | 0 | 25 | 0 |
| C | 0 | 25 | 0 |
| D | 0 | 25 | 0 |
| Mode SS | |||
|---|---|---|---|
| Quadrant | BADHDUFLAG | Total packets | Discarded packets |
| A | 0 | 364 | 0 |
| B | 0 | 364 | 0 |
| C | 0 | 364 | 0 |
| D | 0 | 364 | 0 |
| Quadrant | Total seconds | Saturated seconds | Saturation percentage |
|---|---|---|---|
| A | 17941 | 1354 | 7.546959% |
| B | 17941 | 5095 | 28.398640% |
| C | 17941 | 530 | 2.954127% |
| D | 17941 | 2707 | 15.088345% |
Noise dominated data is calculated using 1-second bins in cleaned event files. If a bin has >2000 counts, and if more than 50% of those come from <1% of pixels, then it is considered to be noise-dominated and hence unusable.
| Quadrant | # 1 sec bins | Bins with >0 counts | Bins with >2000 counts | High rate bins dominated by noise | Noise dominated (total time) | Noise dominated (detector-on time) | Marked lightcurve |
|---|---|---|---|---|---|---|---|
| A | 20385 | 17941 | 1038 | 1038 | 5.09% | 5.79% | 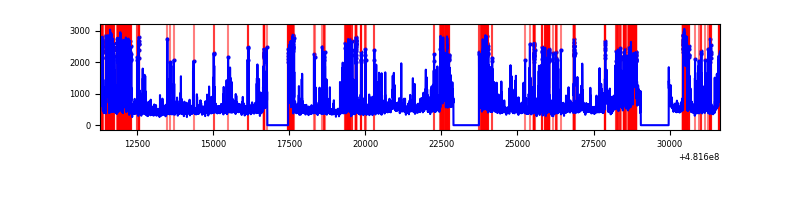 |
| B | 20385 | 17941 | 4083 | 4083 | 20.03% | 22.76% |  |
| C | 20385 | 17941 | 359 | 359 | 1.76% | 2.00% | 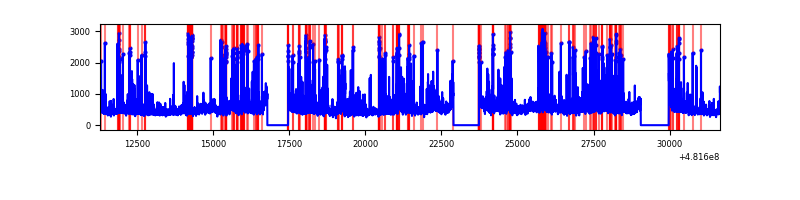 |
| D | 20385 | 17941 | 2935 | 2935 | 14.40% | 16.36% | 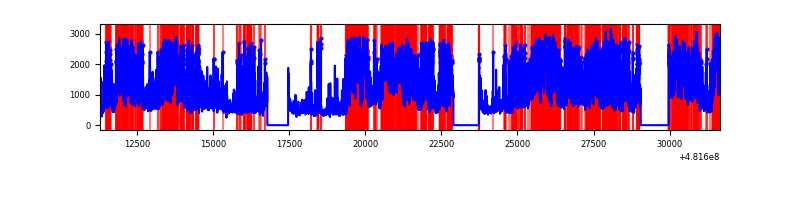 |
Top three noisy pixels from each quadrant. If the there are fewer than three noisy pixels in the level2.evt file, extra rows are filled as -1
| Pixel properties | Quadrant properties | ||||||
|---|---|---|---|---|---|---|---|
| Quadrant | DetID | PixID | Counts | Sigma | Mean | Median | Sigma |
| A | 2 | 143 | 1235313 | 2694.17 | 1879 | 1834 | 457.8 |
| A | 12 | 250 | 907529 | 1978.22 | 1879 | 1834 | 457.8 |
| A | 7 | 64 | 662922 | 1443.95 | 1879 | 1834 | 457.8 |
| B | 4 | 81 | 10204900 | 27906.43 | 1703 | 1642 | 365.6 |
| B | 2 | 208 | 1751938 | 4787.15 | 1703 | 1642 | 365.6 |
| B | 15 | 52 | 633226 | 1727.41 | 1703 | 1642 | 365.6 |
| C | 12 | 247 | 860417 | 1669.23 | 1872 | 1859 | 514.3 |
| C | 13 | 3 | 587750 | 1139.11 | 1872 | 1859 | 514.3 |
| C | 12 | 252 | 303034 | 585.55 | 1872 | 1859 | 514.3 |
| D | 8 | 176 | 8796869 | 17905.11 | 1775 | 1717 | 491.2 |
| D | 11 | 176 | 3565034 | 7254.18 | 1775 | 1717 | 491.2 |
| D | 6 | 42 | 834329 | 1695.03 | 1775 | 1717 | 491.2 |
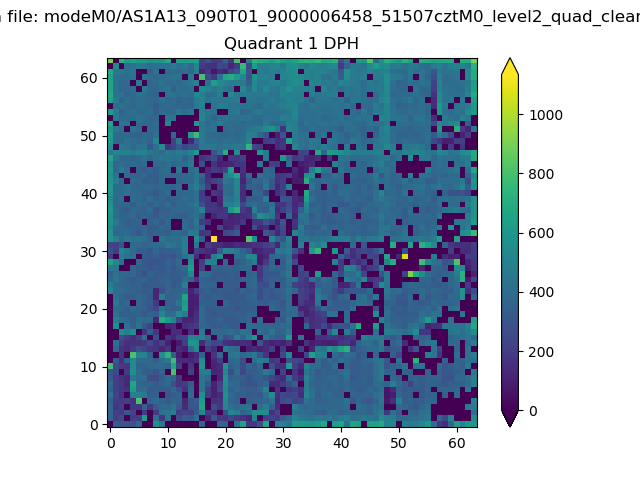
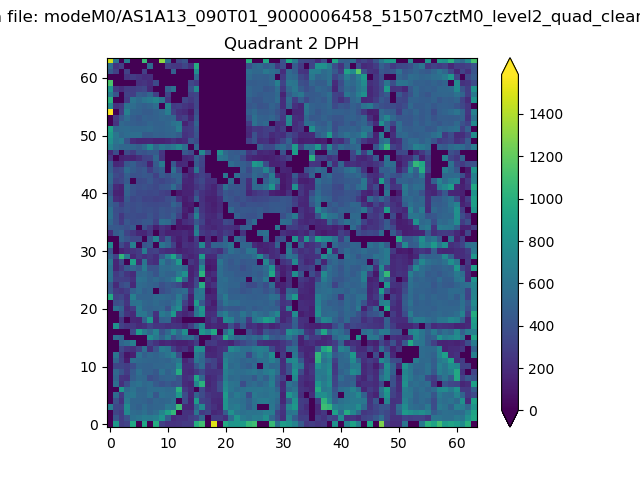
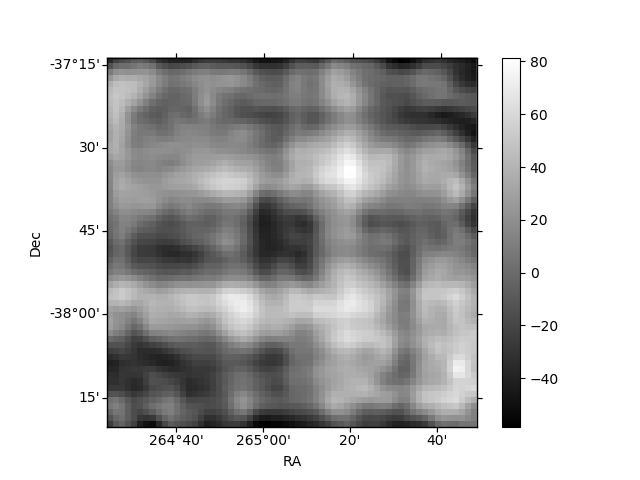
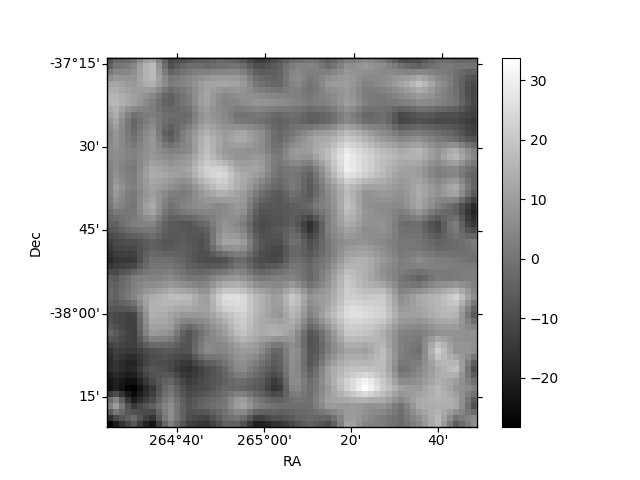
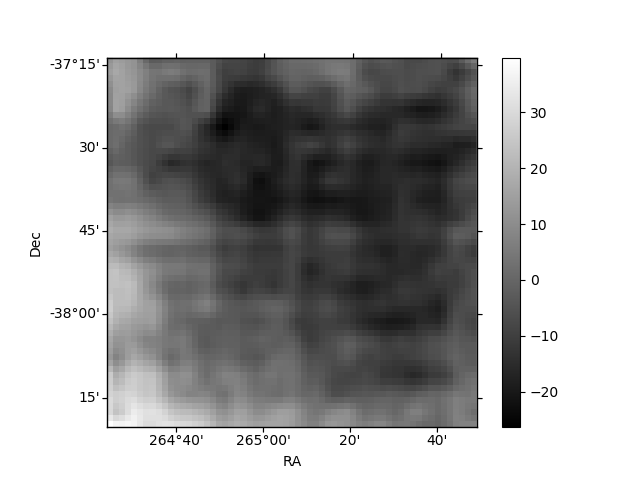
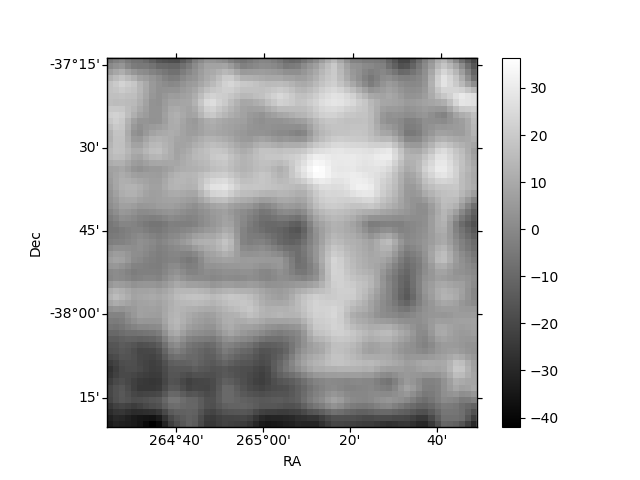
Histogram calculated using DETX and DETY for each event in the final _common_clean file
| Quadrant A | 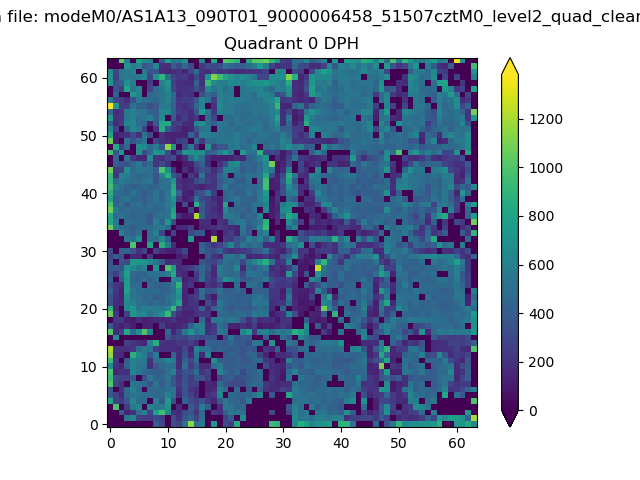 |
 |
Quadrant B |
|---|---|---|---|
| Quadrant D | 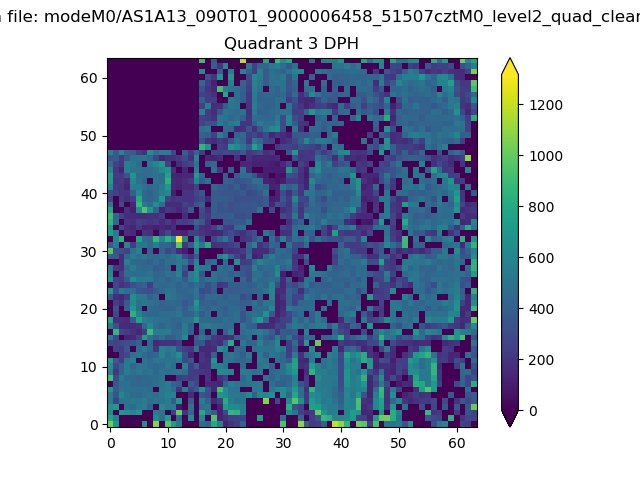 |
 |
Quadrant C |
| Plot type | Count rate plots | Images |
|---|---|---|
| Comparison with Poisson distribution Blue bars denote a histogram of data divided into 1 sec bins. Red curve is a Poisson curve with rate = median count rate of data. |
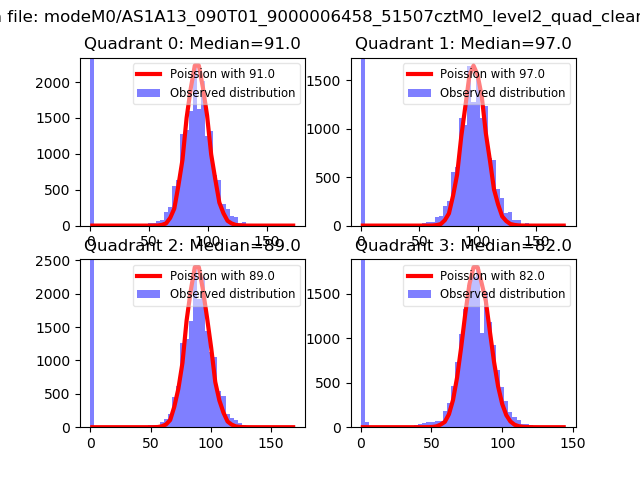 |
 |
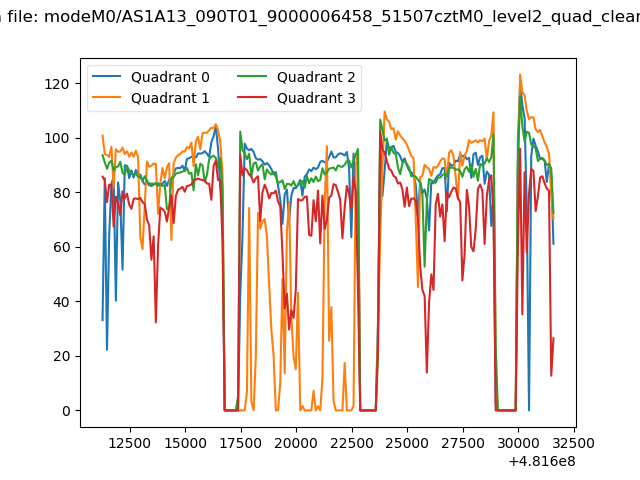
| Quadrant-wise count rates Data is divided into 100 sec bins |
 |
|
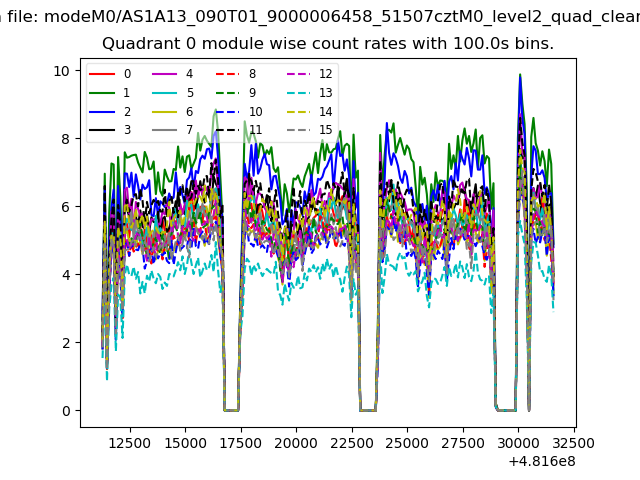
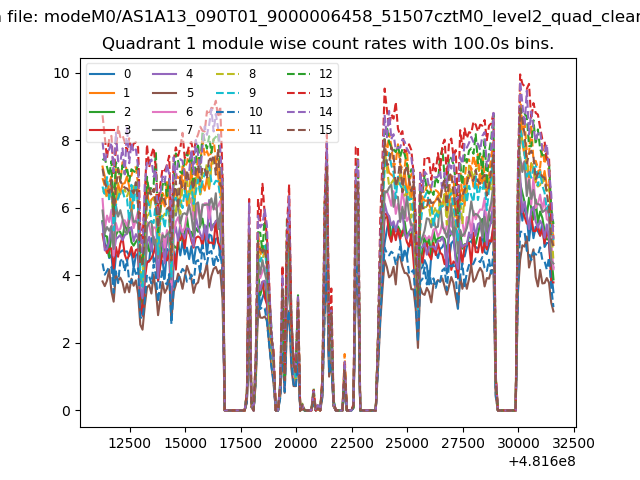
| Module-wise count rates for Quadrant A Data is divided into 100 sec bins |
 |
 |
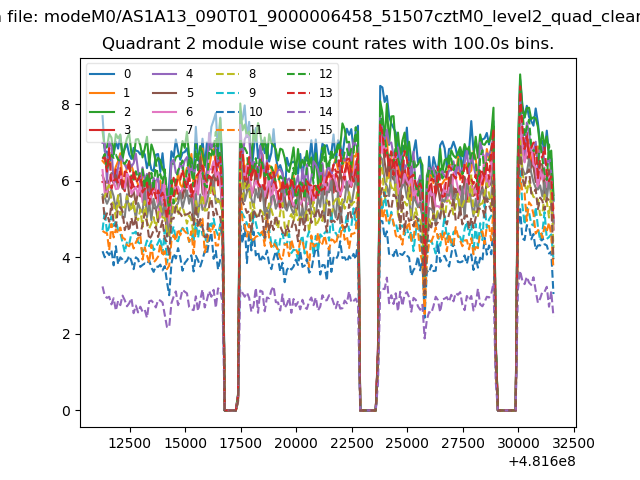
| Module-wise count rates for Quadrant B Data is divided into 100 sec bins |
 |
 |
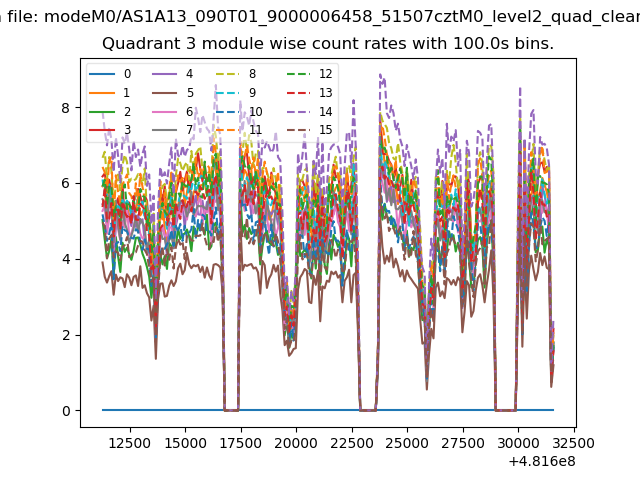
| Module-wise count rates for Quadrant C Data is divided into 100 sec bins |
 |
 |
| Module-wise count rates for Quadrant D Data is divided into 100 sec bins |
 |
 |
| Parameter | Plot |
|---|---|
| CZT HV Monitor | 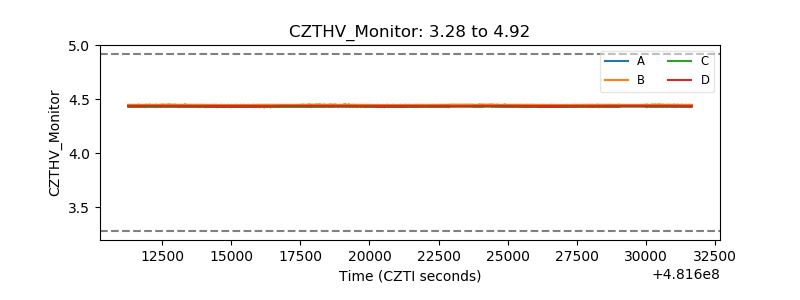 |
| D_VDD | 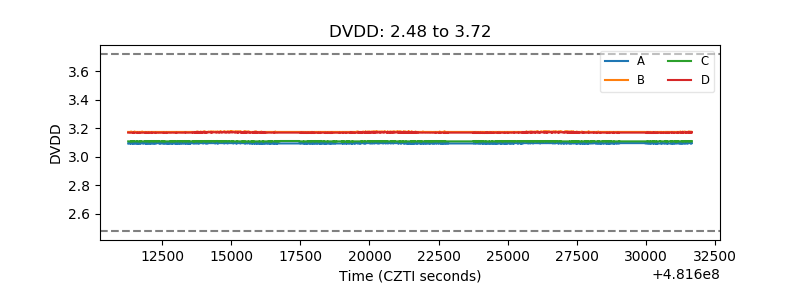 |
| Temperature 1 | 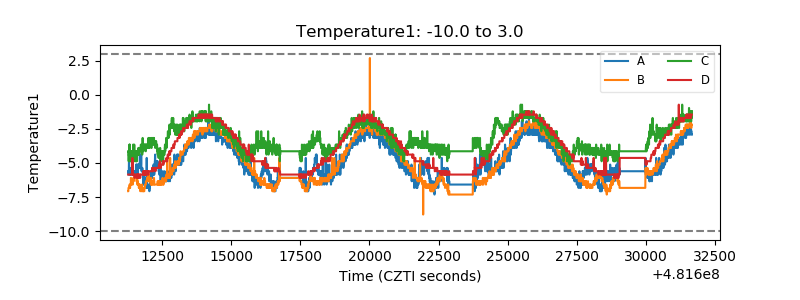 |
| Veto HV Monitor | 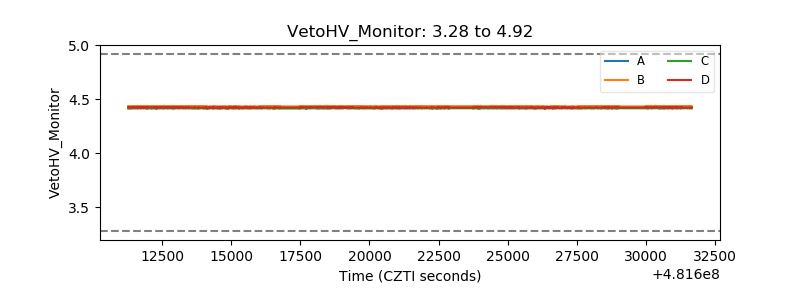 |
| Veto LLD | 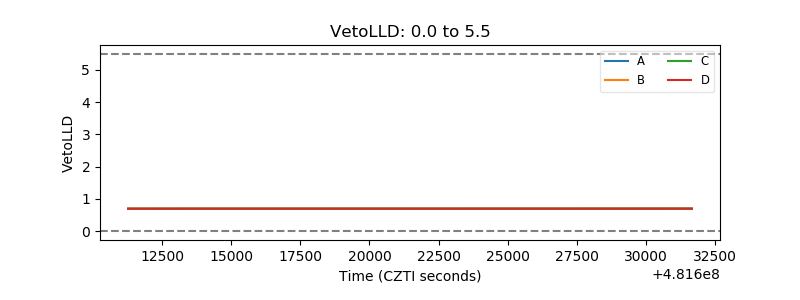 |
| Alpha Counter | 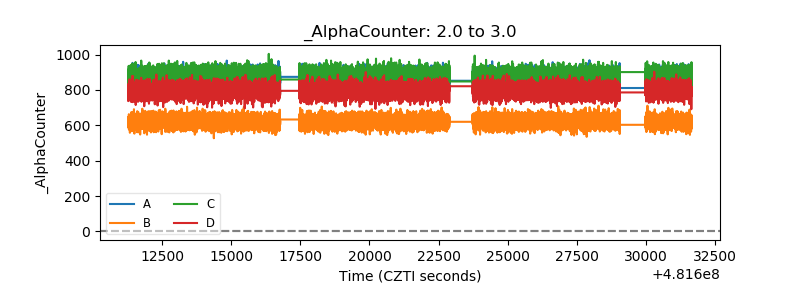 |
| _CPM_Rate | 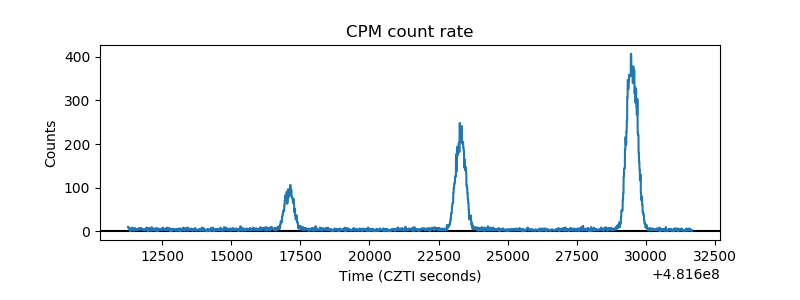 |
| CZT Counter |  |
| +2.5 Volts monitor | 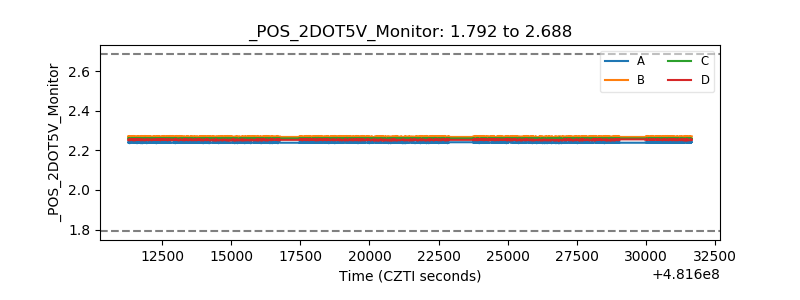 |
| +5 Volts monitor | 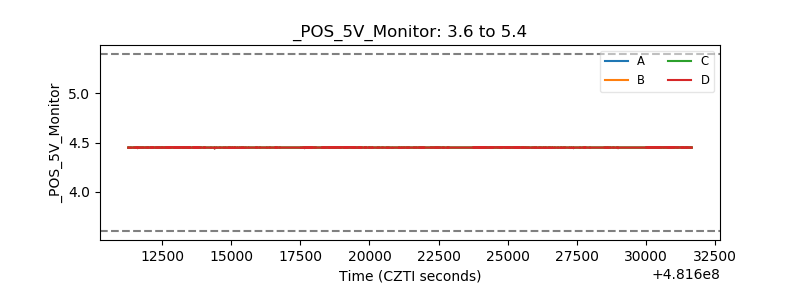 |
| _ROLL_ROT | 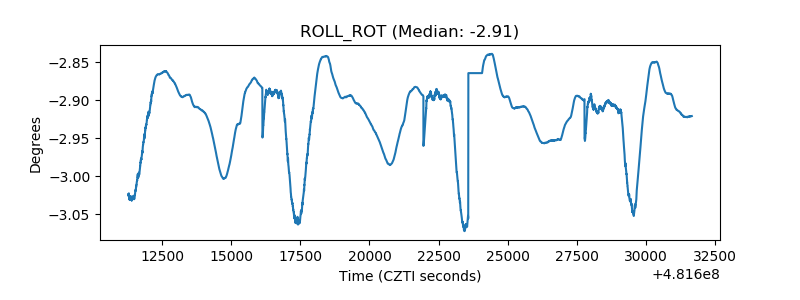 |
| _Roll_DEC | 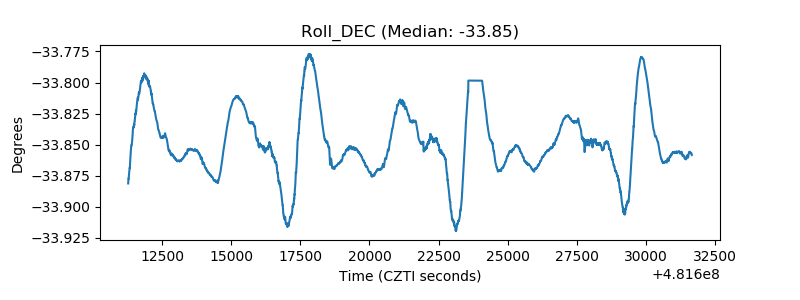 |
| _Roll_RA | 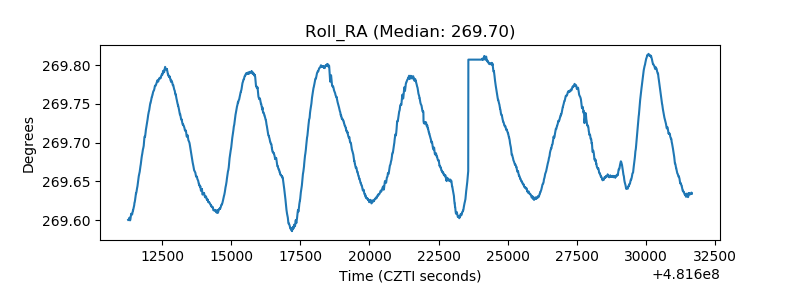 |
| Veto Counter | 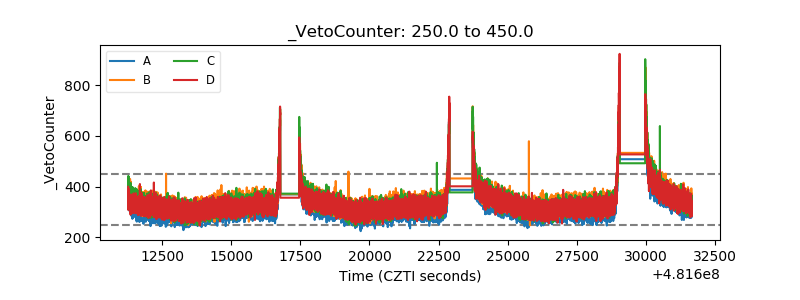 |