| Param | Original file | Final file |
|---|---|---|
| Filename | modeM0/AS1A13_090T01_9000006458_51508cztM0_level2.fits | modeM0/AS1A13_090T01_9000006458_51508cztM0_level2_quad_clean.evt |
| Size (bytes) | 672,664,320 | 87,880,320 |
| Size | 641.5 MB | 83.8 MB |
| Events in quadrant A | 5,091,739 | 572,355 |
| Events in quadrant B | 5,237,334 | 629,484 |
| Events in quadrant C | 4,039,248 | 578,392 |
| Events in quadrant D | 10,030,273 | 428,676 |
| Mode M0 | |||
|---|---|---|---|
| Quadrant | BADHDUFLAG | Total packets | Discarded packets |
| A | 0 | 19374 | 1 |
| B | 0 | 19989 | 1 |
| C | 0 | 16413 | 1 |
| D | 0 | 34312 | 9 |
| Mode M9 | |||
|---|---|---|---|
| Quadrant | BADHDUFLAG | Total packets | Discarded packets |
| A | 0 | 10 | 0 |
| B | 0 | 10 | 0 |
| C | 0 | 10 | 0 |
| D | 0 | 10 | 0 |
| Mode SS | |||
|---|---|---|---|
| Quadrant | BADHDUFLAG | Total packets | Discarded packets |
| A | 0 | 132 | 0 |
| B | 0 | 132 | 0 |
| C | 0 | 132 | 0 |
| D | 0 | 132 | 0 |
| Quadrant | Total seconds | Saturated seconds | Saturation percentage |
|---|---|---|---|
| A | 6475 | 631 | 9.745174% |
| B | 6476 | 561 | 8.662755% |
| C | 6476 | 383 | 5.914145% |
| D | 6475 | 1871 | 28.895753% |
Noise dominated data is calculated using 1-second bins in cleaned event files. If a bin has >2000 counts, and if more than 50% of those come from <1% of pixels, then it is considered to be noise-dominated and hence unusable.
| Quadrant | # 1 sec bins | Bins with >0 counts | Bins with >2000 counts | High rate bins dominated by noise | Noise dominated (total time) | Noise dominated (detector-on time) | Marked lightcurve |
|---|---|---|---|---|---|---|---|
| A | 7495 | 6476 | 504 | 504 | 6.72% | 7.78% | 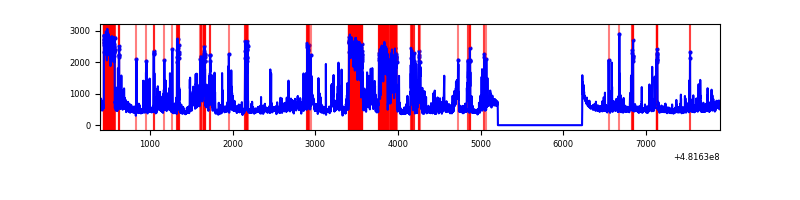 |
| B | 7496 | 6477 | 309 | 309 | 4.12% | 4.77% | 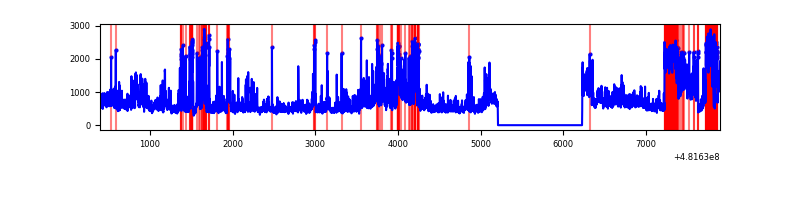 |
| C | 7496 | 6477 | 272 | 272 | 3.63% | 4.20% | 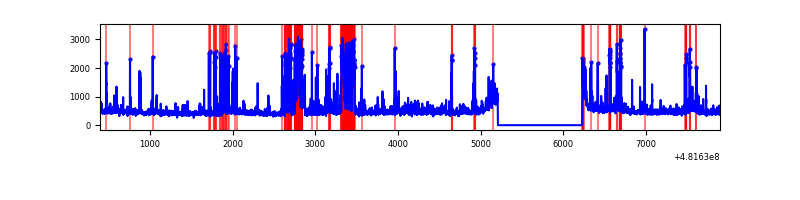 |
| D | 7495 | 6476 | 1987 | 1987 | 26.51% | 30.68% | 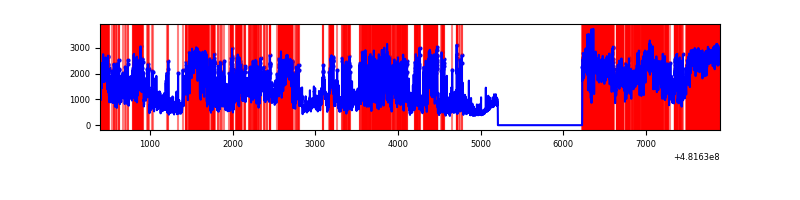 |
Top three noisy pixels from each quadrant. If the there are fewer than three noisy pixels in the level2.evt file, extra rows are filled as -1
| Pixel properties | Quadrant properties | ||||||
|---|---|---|---|---|---|---|---|
| Quadrant | DetID | PixID | Counts | Sigma | Mean | Median | Sigma |
| A | 12 | 250 | 970554 | 5702.21 | 695 | 678 | 170.1 |
| A | 8 | 43 | 405258 | 2378.65 | 695 | 678 | 170.1 |
| A | 7 | 64 | 402835 | 2364.41 | 695 | 678 | 170.1 |
| B | 2 | 208 | 938239 | 6292.31 | 692 | 669 | 149.0 |
| B | 5 | 172 | 726497 | 4871.25 | 692 | 669 | 149.0 |
| B | 15 | 52 | 308594 | 2066.58 | 692 | 669 | 149.0 |
| C | 12 | 252 | 461007 | 2471.05 | 681 | 673 | 186.3 |
| C | 15 | 1 | 418888 | 2244.96 | 681 | 673 | 186.3 |
| C | 13 | 3 | 153139 | 818.43 | 681 | 673 | 186.3 |
| D | 8 | 176 | 4155716 | 24366.22 | 613 | 594 | 170.5 |
| D | 11 | 176 | 2410157 | 14130.02 | 613 | 594 | 170.5 |
| D | 8 | 192 | 295346 | 1728.47 | 613 | 594 | 170.5 |
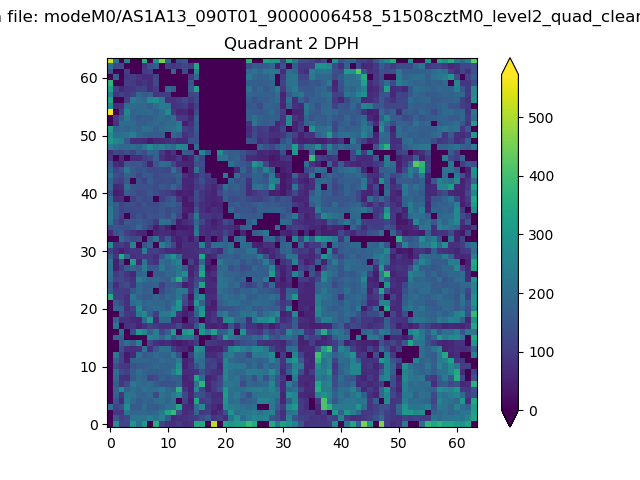
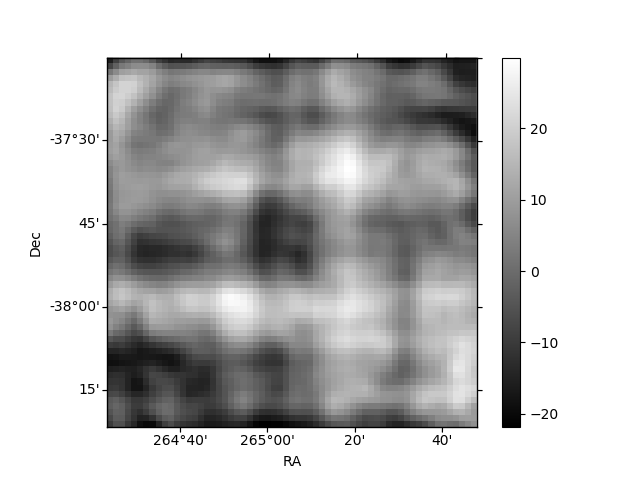
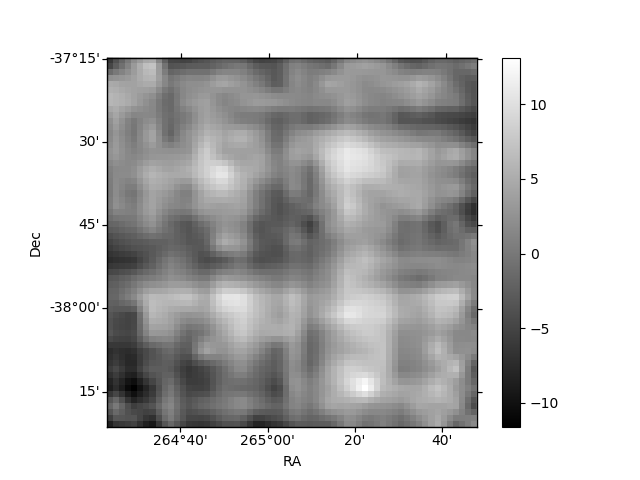
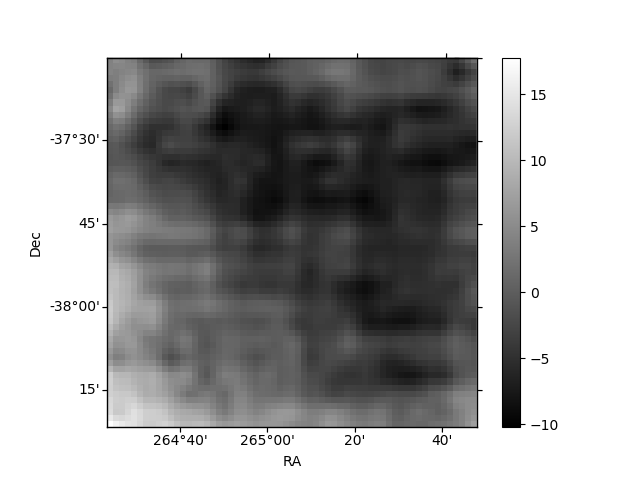
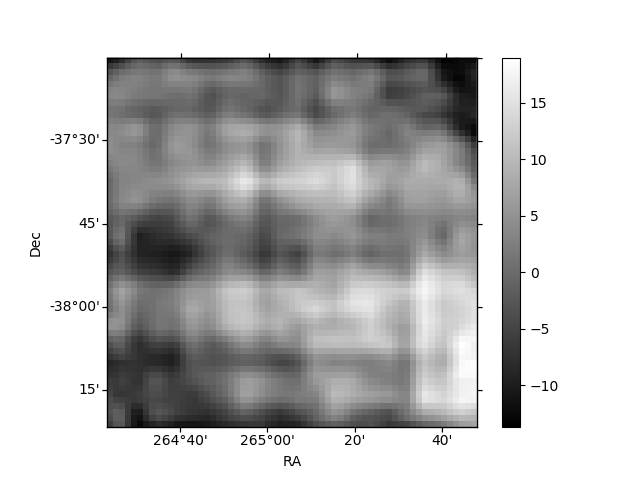
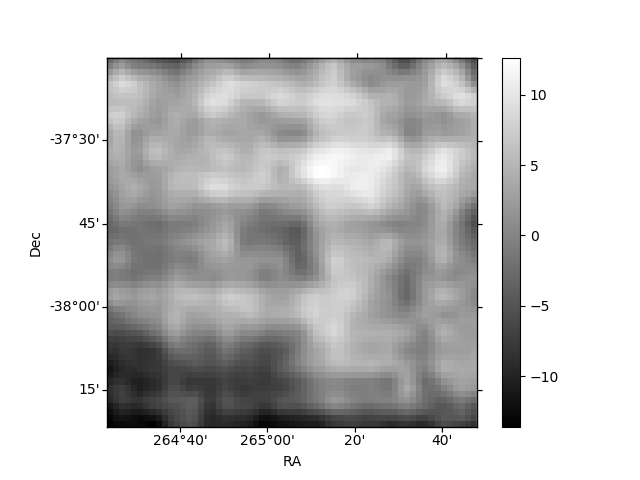
Histogram calculated using DETX and DETY for each event in the final _common_clean file
| Quadrant A | 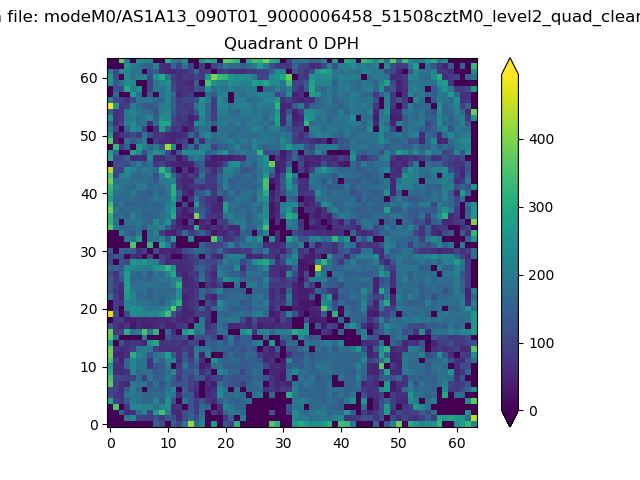 |
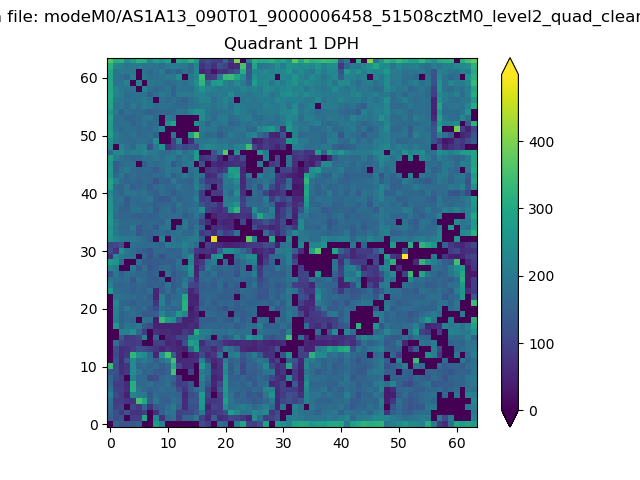 |
Quadrant B |
|---|---|---|---|
| Quadrant D | 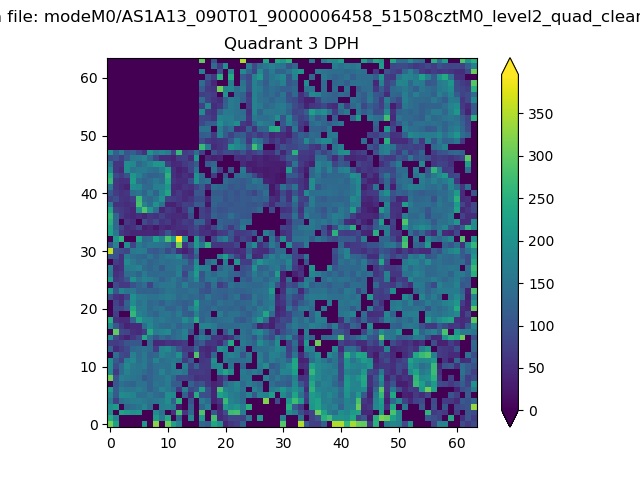 |
 |
Quadrant C |
| Plot type | Count rate plots | Images |
|---|---|---|
| Comparison with Poisson distribution Blue bars denote a histogram of data divided into 1 sec bins. Red curve is a Poisson curve with rate = median count rate of data. |
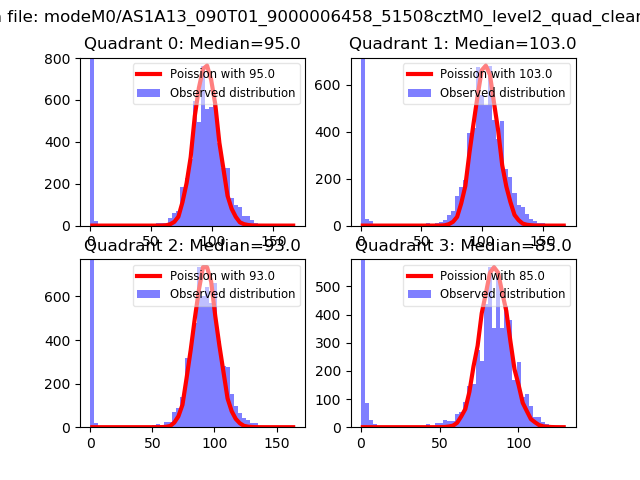 |
 |
| Quadrant-wise count rates Data is divided into 100 sec bins |
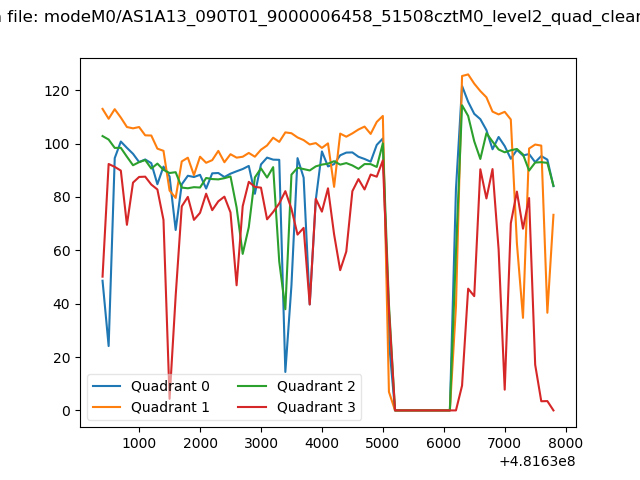 |
|
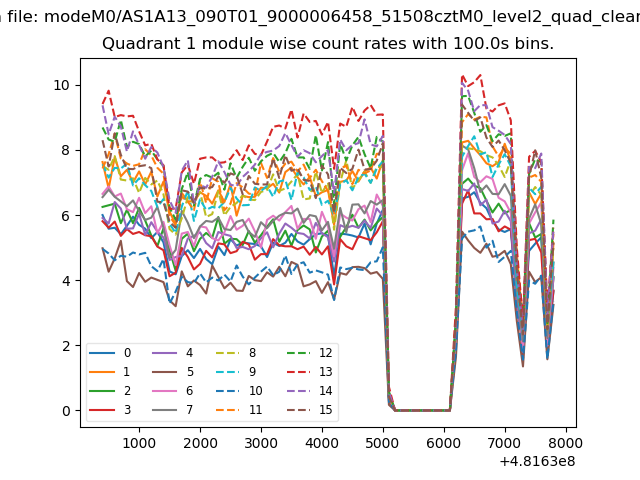
| Module-wise count rates for Quadrant A Data is divided into 100 sec bins |
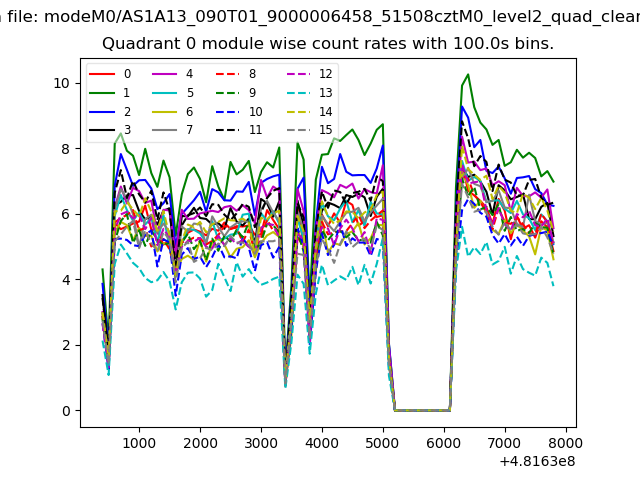 |
 |
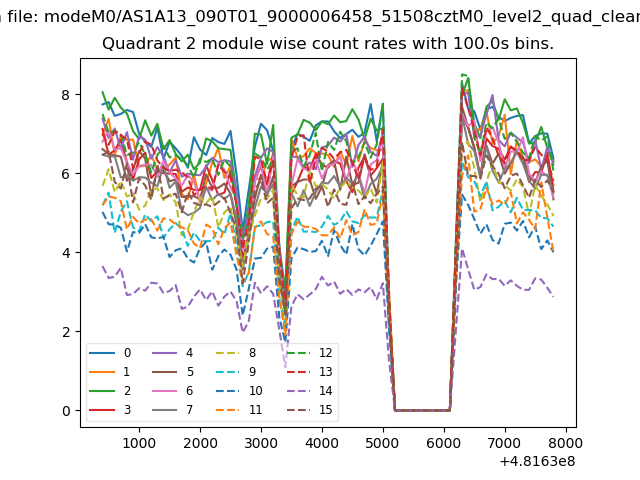
| Module-wise count rates for Quadrant B Data is divided into 100 sec bins |
 |
 |
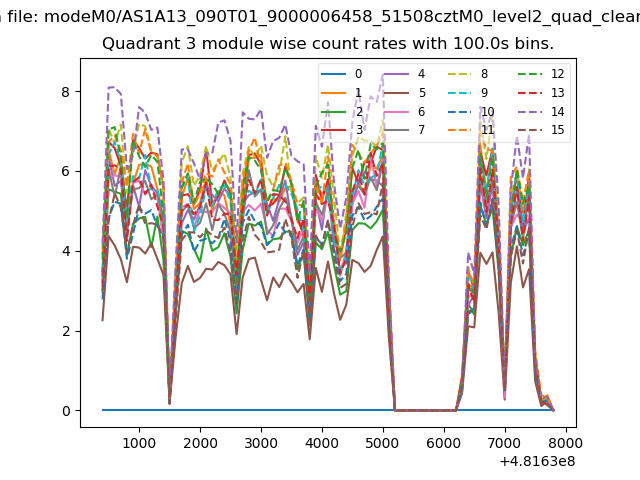
| Module-wise count rates for Quadrant C Data is divided into 100 sec bins |
 |
 |
| Module-wise count rates for Quadrant D Data is divided into 100 sec bins |
 |
 |
| Parameter | Plot |
|---|---|
| CZT HV Monitor | 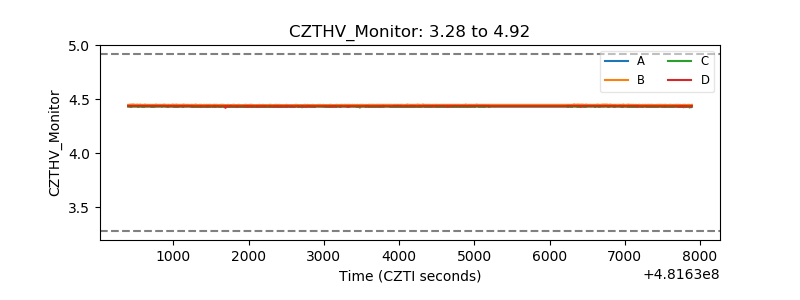 |
| D_VDD | 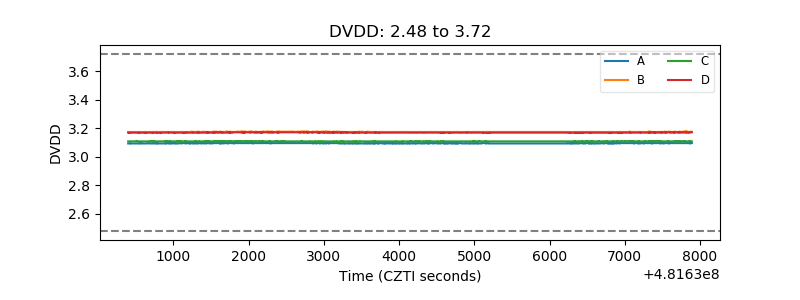 |
| Temperature 1 | 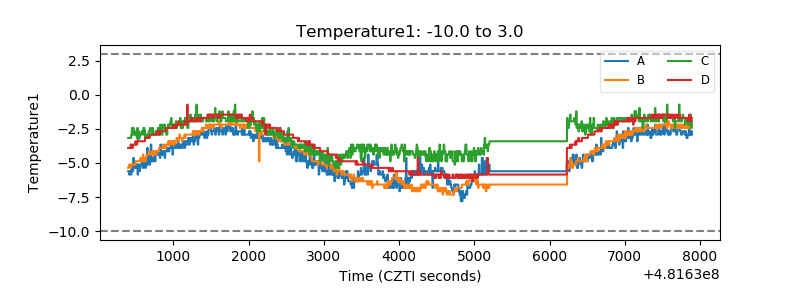 |
| Veto HV Monitor | 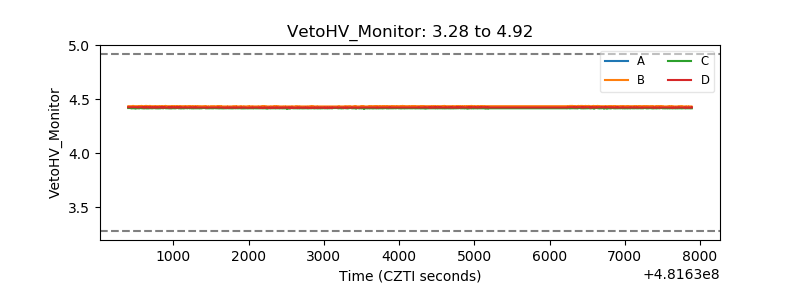 |
| Veto LLD | 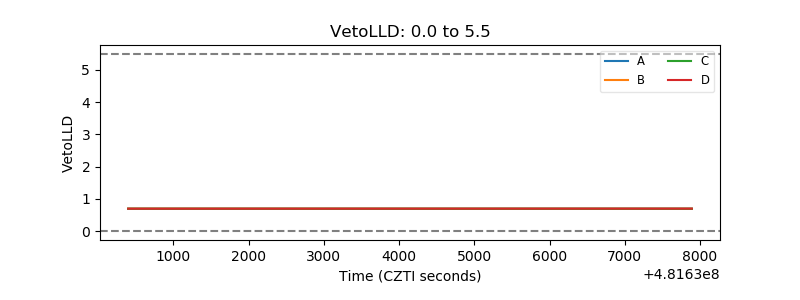 |
| Alpha Counter | 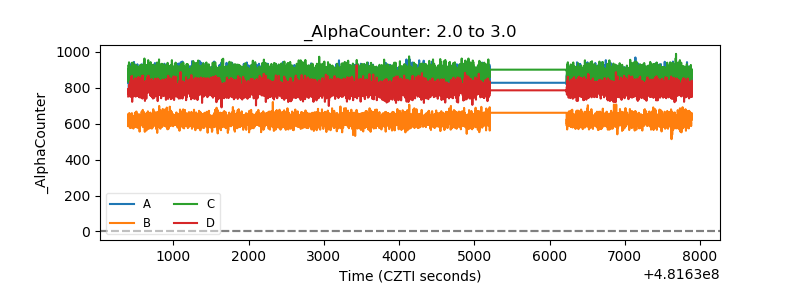 |
| _CPM_Rate | 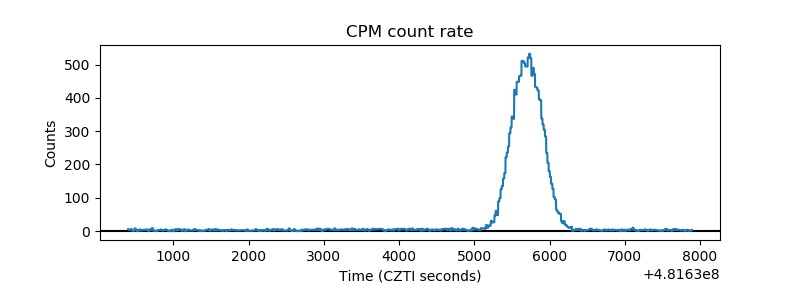 |
| CZT Counter | 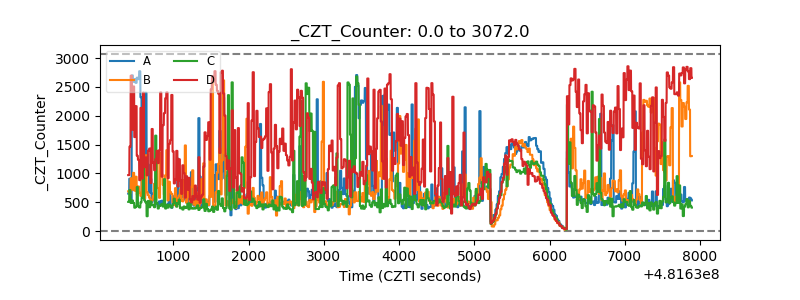 |
| +2.5 Volts monitor | 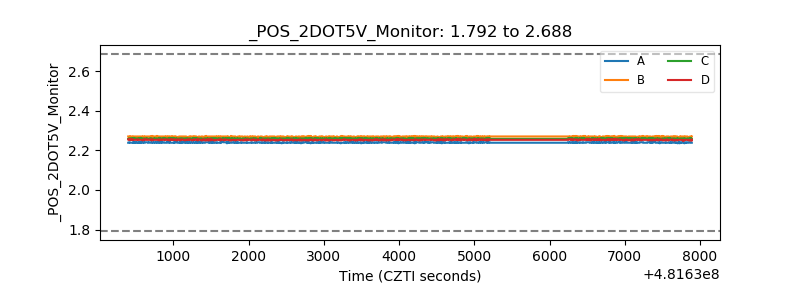 |
| +5 Volts monitor | 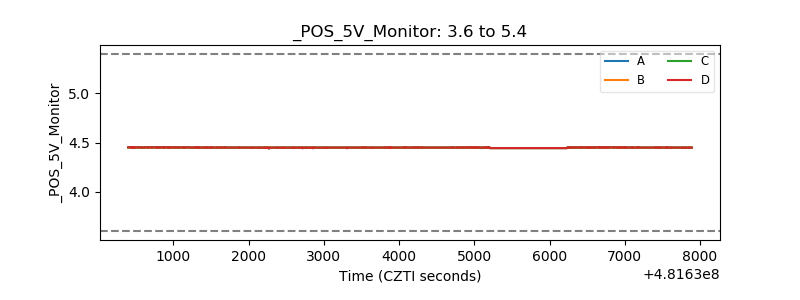 |
| _ROLL_ROT | 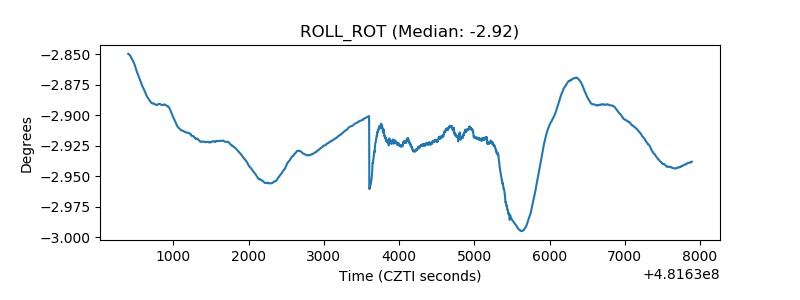 |
| _Roll_DEC | 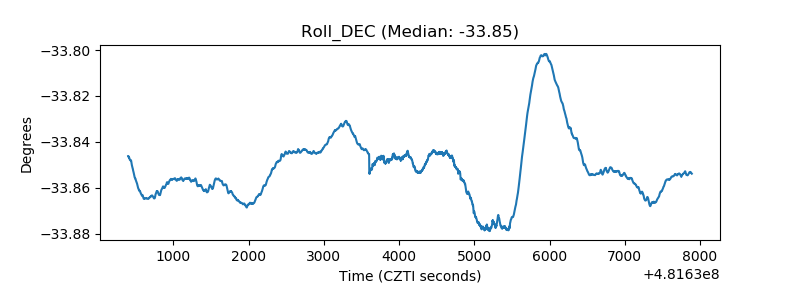 |
| _Roll_RA | 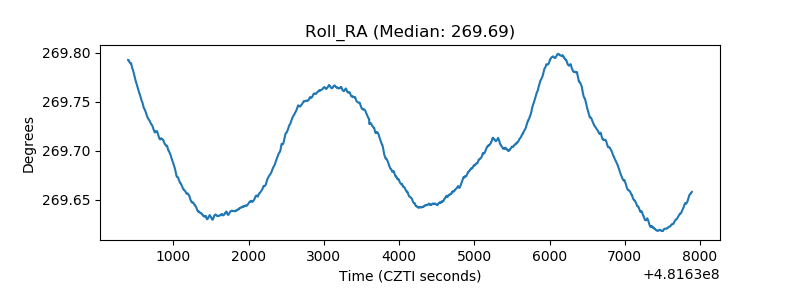 |
| Veto Counter | 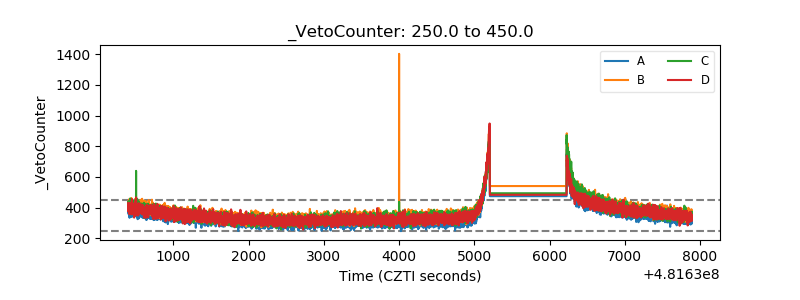 |