| Param | Original file | Final file |
|---|---|---|
| Filename | modeM0/AS1A13_090T01_9000006458_51509cztM0_level2.fits | modeM0/AS1A13_090T01_9000006458_51509cztM0_level2_quad_clean.evt |
| Size (bytes) | 814,259,520 | 84,813,120 |
| Size | 776.5 MB | 80.9 MB |
| Events in quadrant A | 6,052,571 | 583,491 |
| Events in quadrant B | 5,794,695 | 642,178 |
| Events in quadrant C | 4,115,753 | 619,978 |
| Events in quadrant D | 13,667,335 | 262,032 |
| Mode M0 | |||
|---|---|---|---|
| Quadrant | BADHDUFLAG | Total packets | Discarded packets |
| A | 0 | 22243 | 1 |
| B | 0 | 21690 | 1 |
| C | 0 | 16578 | 1 |
| D | 0 | 45208 | 1 |
| Mode M9 | |||
|---|---|---|---|
| Quadrant | BADHDUFLAG | Total packets | Discarded packets |
| A | 0 | 11 | 0 |
| B | 0 | 11 | 0 |
| C | 0 | 11 | 0 |
| D | 0 | 11 | 0 |
| Mode SS | |||
|---|---|---|---|
| Quadrant | BADHDUFLAG | Total packets | Discarded packets |
| A | 0 | 134 | 0 |
| B | 0 | 134 | 0 |
| C | 0 | 134 | 0 |
| D | 0 | 134 | 0 |
| Quadrant | Total seconds | Saturated seconds | Saturation percentage |
|---|---|---|---|
| A | 6598 | 867 | 13.140346% |
| B | 6599 | 806 | 12.213972% |
| C | 6599 | 228 | 3.455069% |
| D | 6599 | 3994 | 60.524322% |
Noise dominated data is calculated using 1-second bins in cleaned event files. If a bin has >2000 counts, and if more than 50% of those come from <1% of pixels, then it is considered to be noise-dominated and hence unusable.
| Quadrant | # 1 sec bins | Bins with >0 counts | Bins with >2000 counts | High rate bins dominated by noise | Noise dominated (total time) | Noise dominated (detector-on time) | Marked lightcurve |
|---|---|---|---|---|---|---|---|
| A | 7718 | 6599 | 685 | 685 | 8.88% | 10.38% | 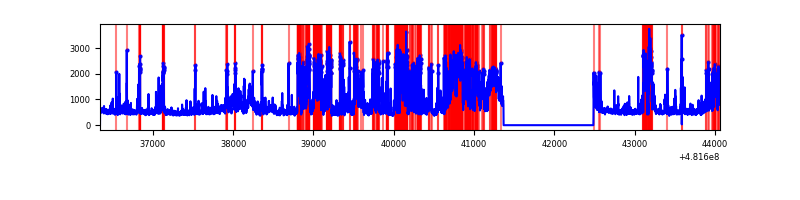 |
| B | 7719 | 6600 | 551 | 551 | 7.14% | 8.35% | 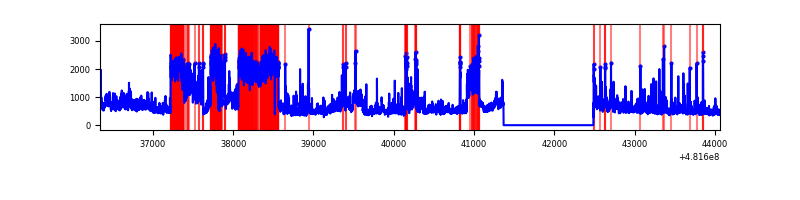 |
| C | 7719 | 6600 | 156 | 156 | 2.02% | 2.36% | 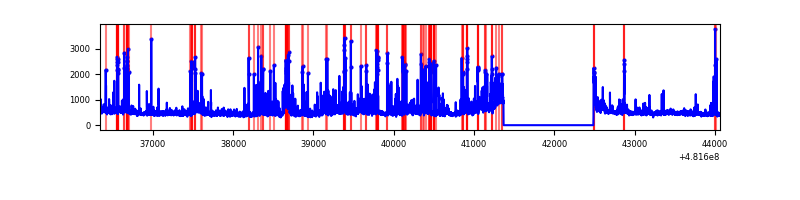 |
| D | 7719 | 6600 | 4017 | 4017 | 52.04% | 60.86% | 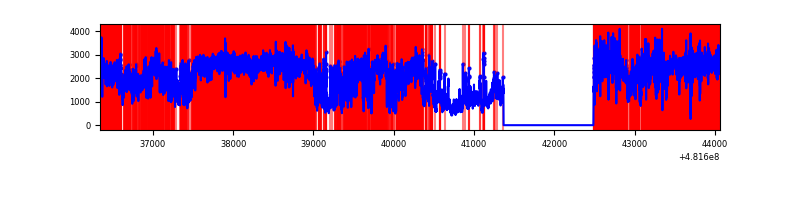 |
Top three noisy pixels from each quadrant. If the there are fewer than three noisy pixels in the level2.evt file, extra rows are filled as -1
| Pixel properties | Quadrant properties | ||||||
|---|---|---|---|---|---|---|---|
| Quadrant | DetID | PixID | Counts | Sigma | Mean | Median | Sigma |
| A | 15 | 174 | 1461541 | 8512.45 | 704 | 685 | 171.6 |
| A | 12 | 250 | 730459 | 4252.41 | 704 | 685 | 171.6 |
| A | 8 | 43 | 320618 | 1864.26 | 704 | 685 | 171.6 |
| B | 5 | 172 | 1898559 | 12464.24 | 711 | 686 | 152.3 |
| B | 2 | 208 | 288815 | 1892.28 | 711 | 686 | 152.3 |
| B | 15 | 52 | 269276 | 1763.96 | 711 | 686 | 152.3 |
| C | 15 | 1 | 297972 | 1536.82 | 712 | 705 | 193.4 |
| C | 12 | 252 | 202993 | 1045.79 | 712 | 705 | 193.4 |
| C | 12 | 249 | 184670 | 951.06 | 712 | 705 | 193.4 |
| D | 8 | 176 | 9605142 | 68217.17 | 504 | 484 | 140.8 |
| D | 11 | 176 | 678102 | 4812.79 | 504 | 484 | 140.8 |
| D | 8 | 192 | 508295 | 3606.73 | 504 | 484 | 140.8 |
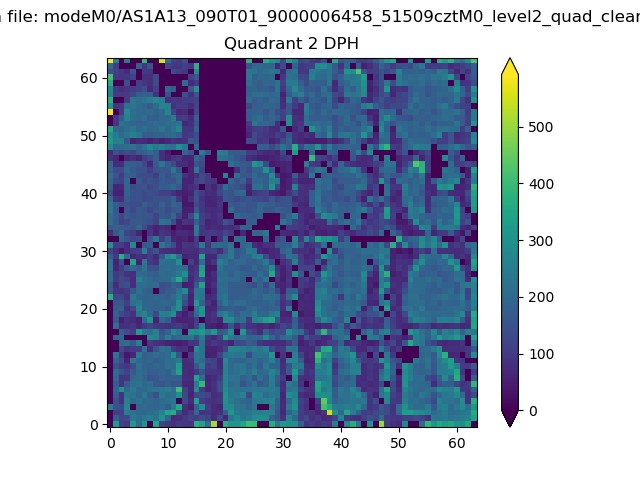
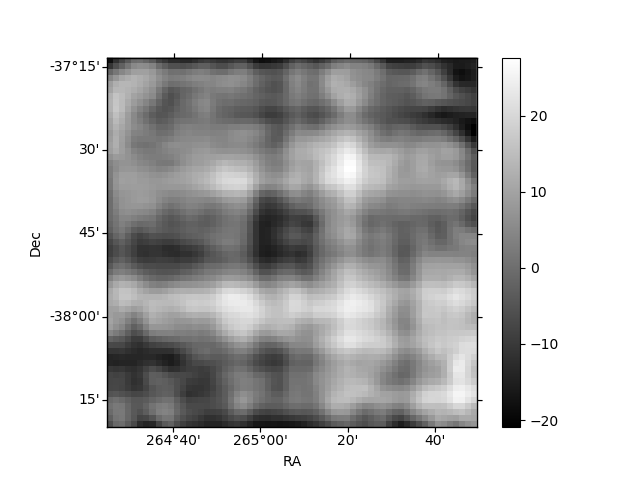
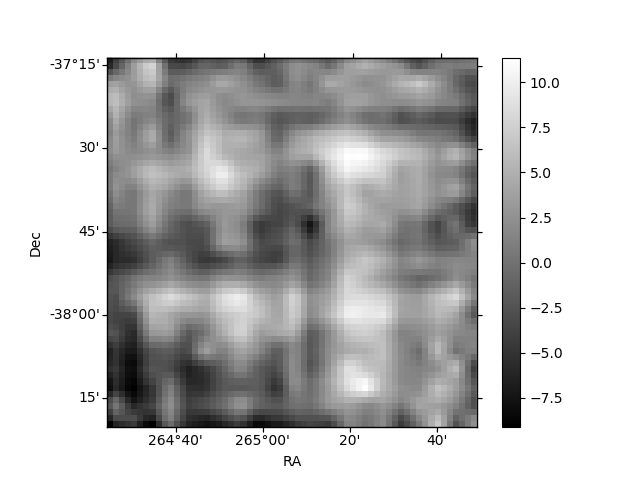
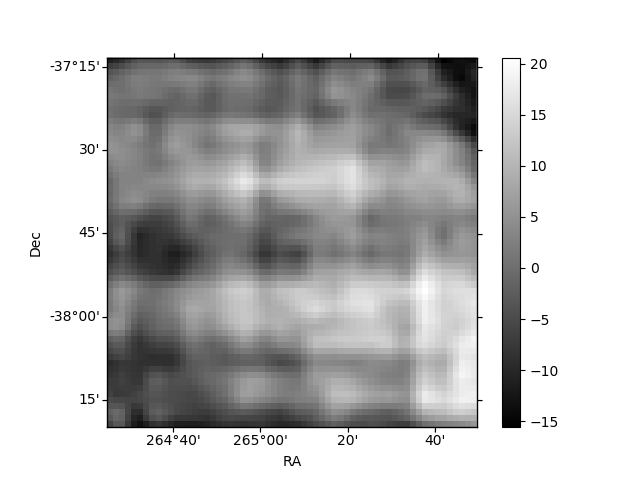
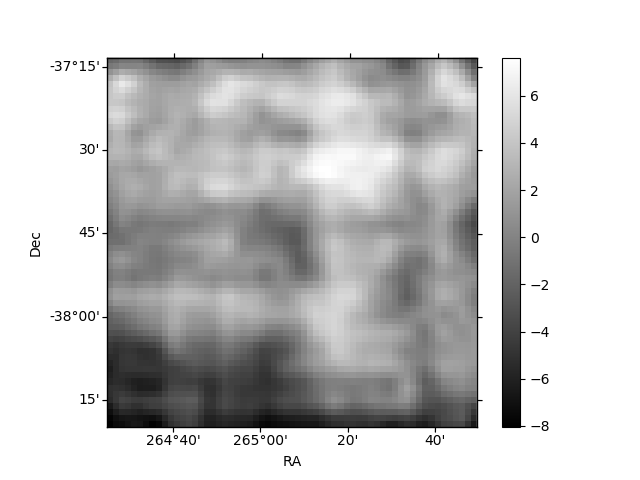
Histogram calculated using DETX and DETY for each event in the final _common_clean file
| Quadrant A | 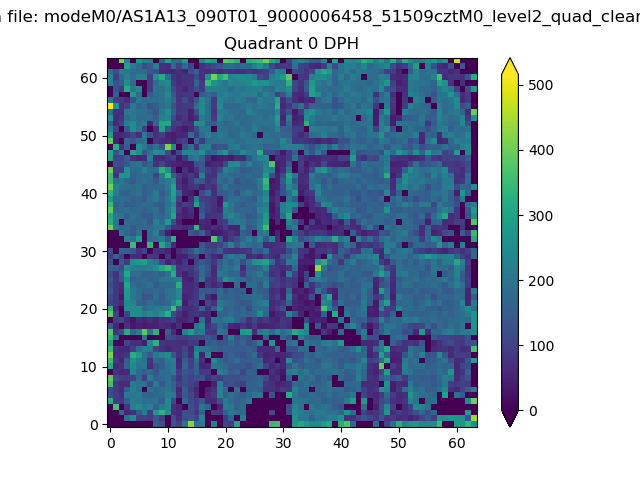 |
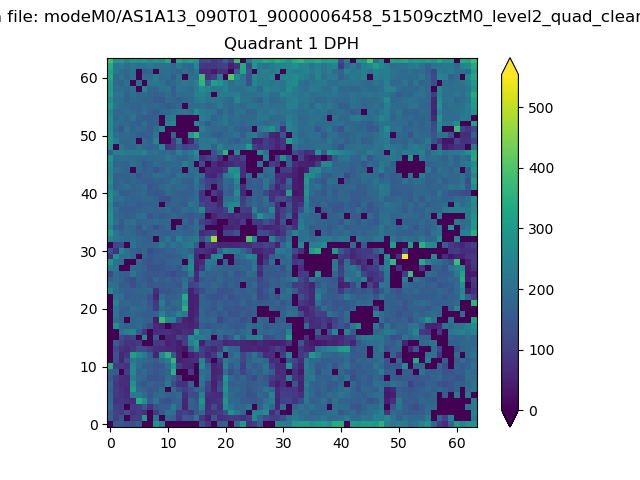 |
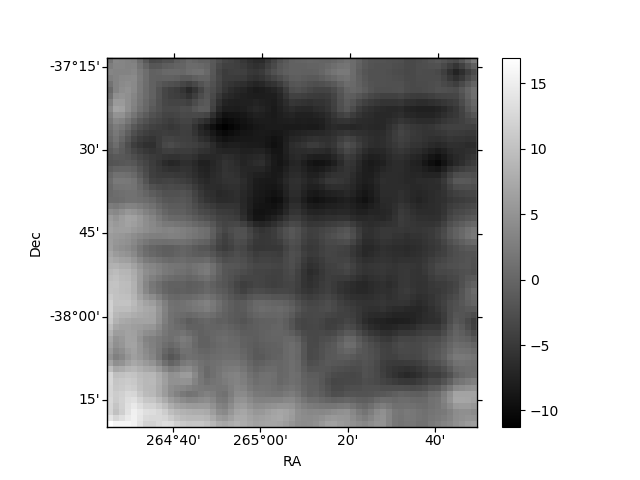
Quadrant B |
|---|---|---|---|
| Quadrant D | 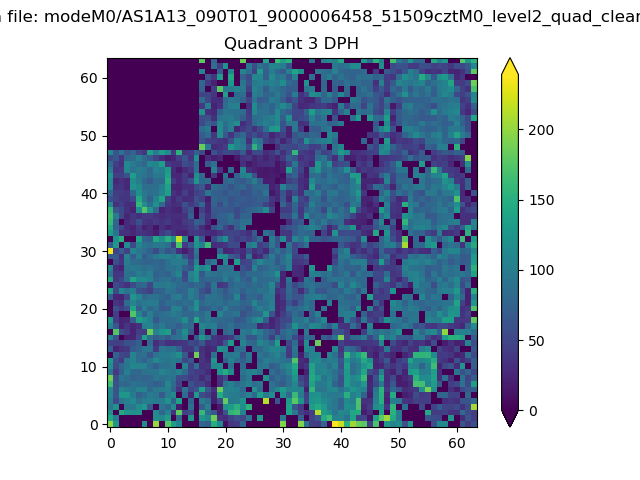 |
 |
Quadrant C |
| Plot type | Count rate plots | Images |
|---|---|---|
| Comparison with Poisson distribution Blue bars denote a histogram of data divided into 1 sec bins. Red curve is a Poisson curve with rate = median count rate of data. |
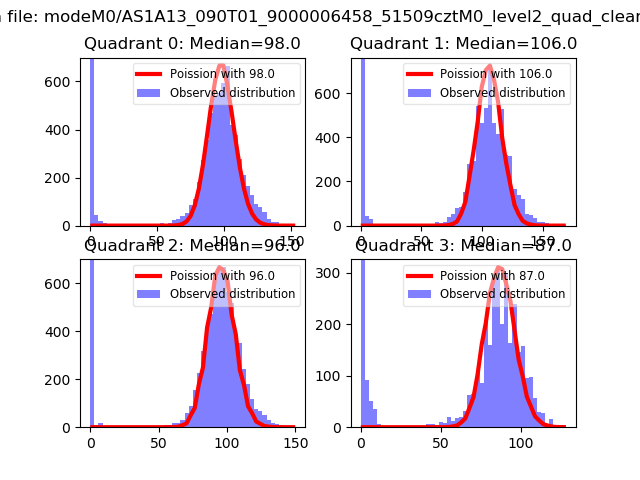 |
 |
| Quadrant-wise count rates Data is divided into 100 sec bins |
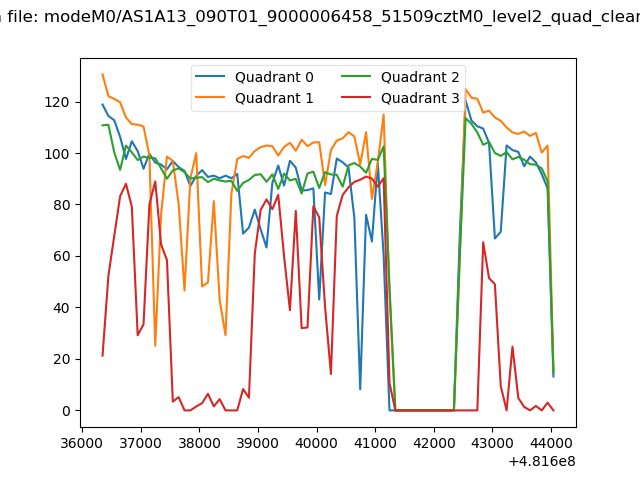 |
|
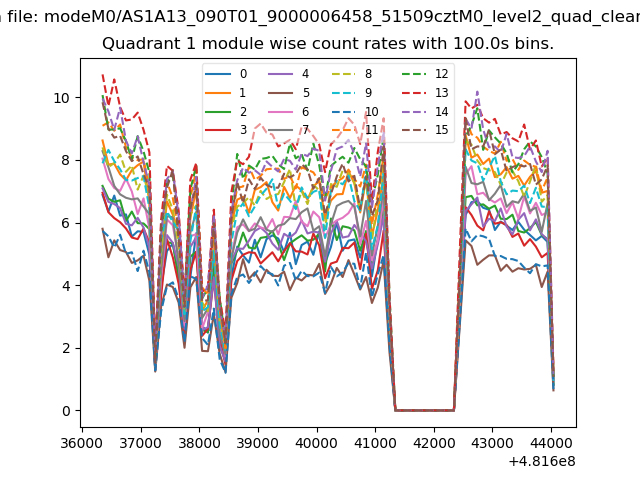
| Module-wise count rates for Quadrant A Data is divided into 100 sec bins |
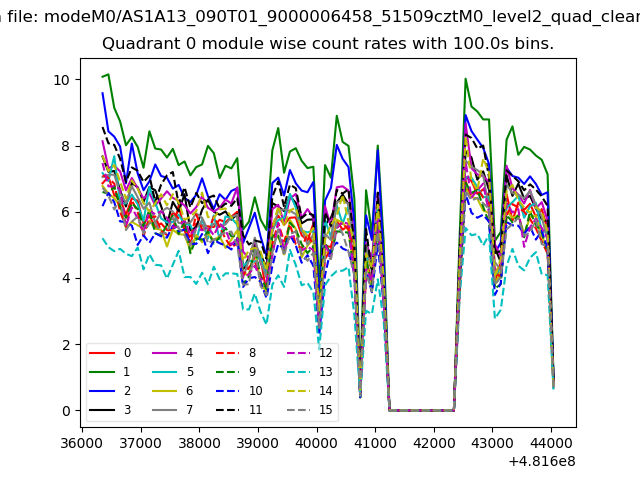 |
 |
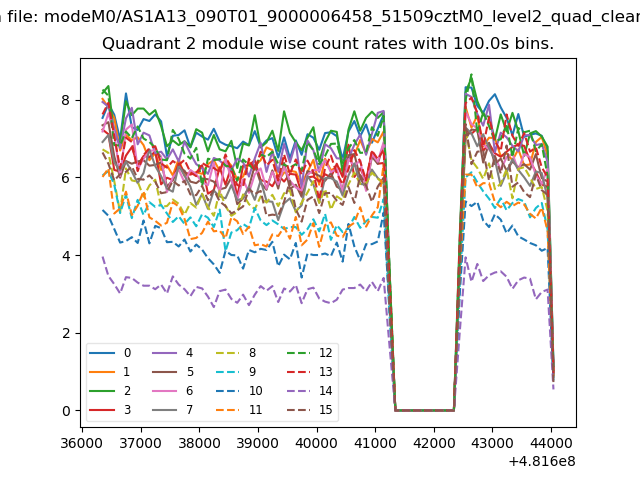
| Module-wise count rates for Quadrant B Data is divided into 100 sec bins |
 |
 |
| Module-wise count rates for Quadrant C Data is divided into 100 sec bins |
 |
 |
| Module-wise count rates for Quadrant D Data is divided into 100 sec bins |
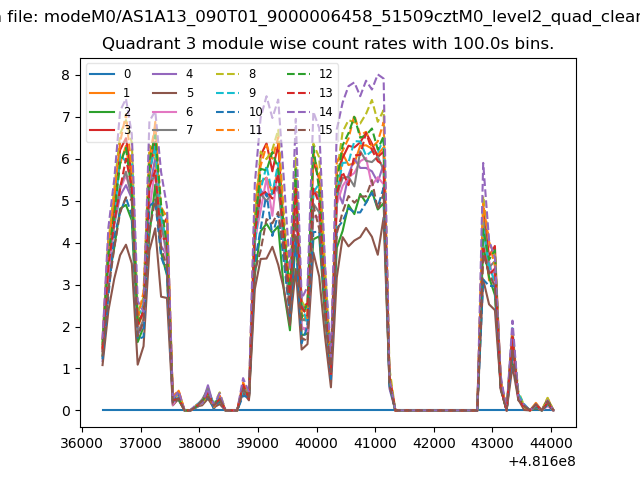 |
 |
| Parameter | Plot |
|---|---|
| CZT HV Monitor | 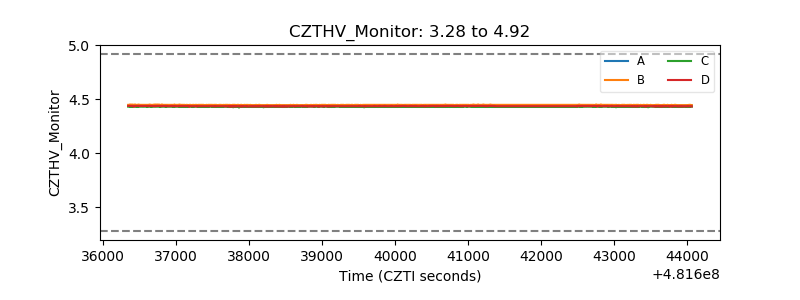 |
| D_VDD | 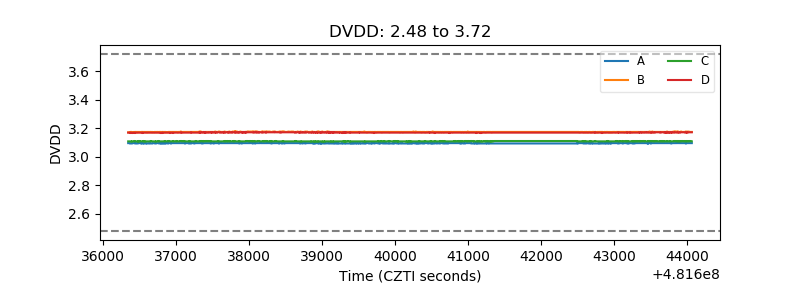 |
| Temperature 1 | 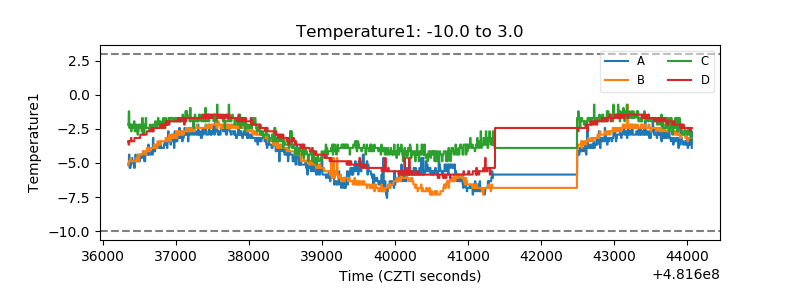 |
| Veto HV Monitor | 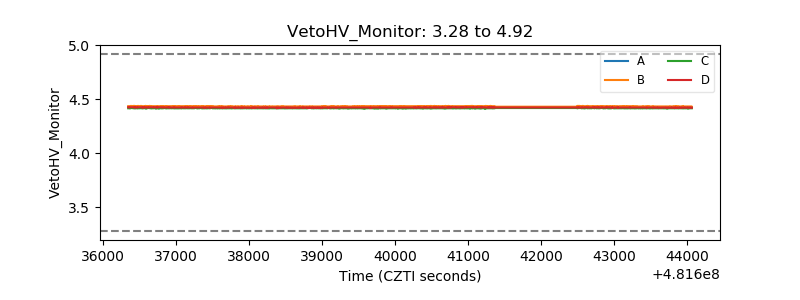 |
| Veto LLD | 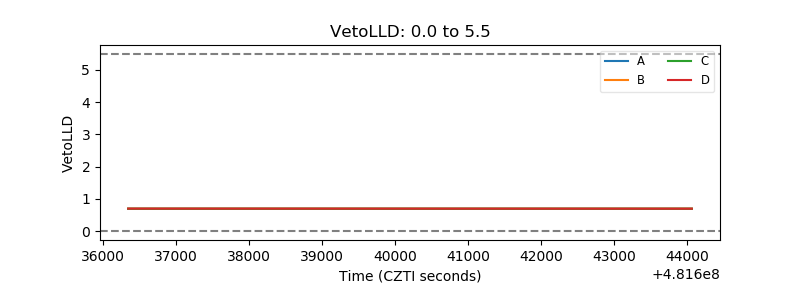 |
| Alpha Counter | 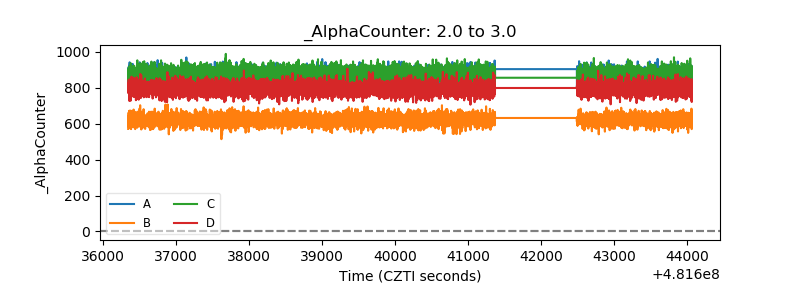 |
| _CPM_Rate | 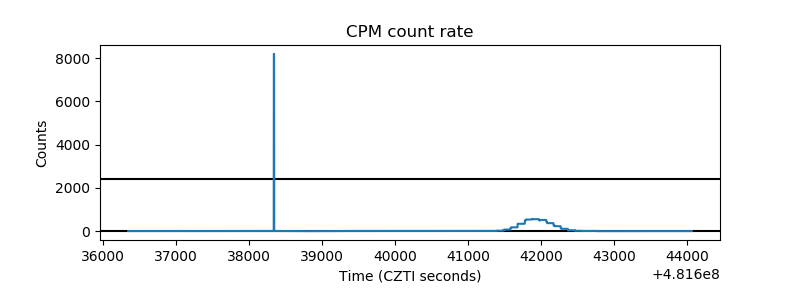 |
| CZT Counter | 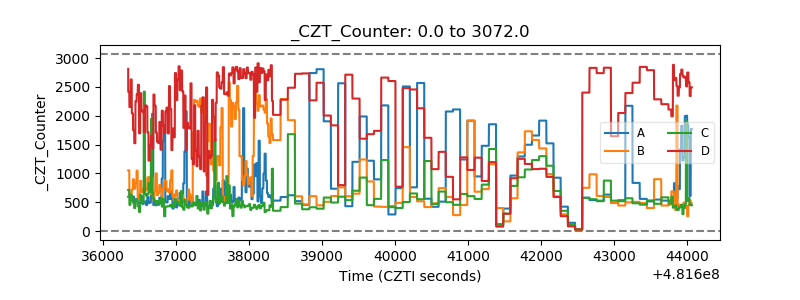 |
| +2.5 Volts monitor | 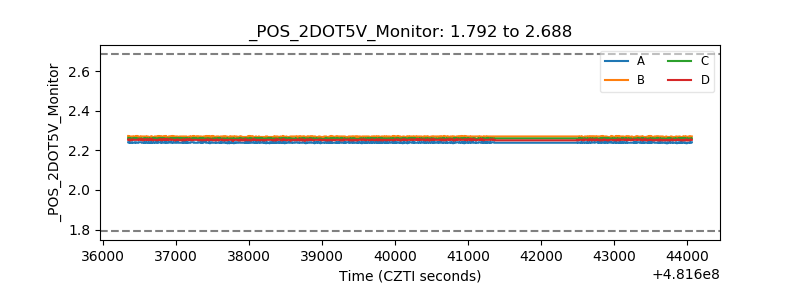 |
| +5 Volts monitor | 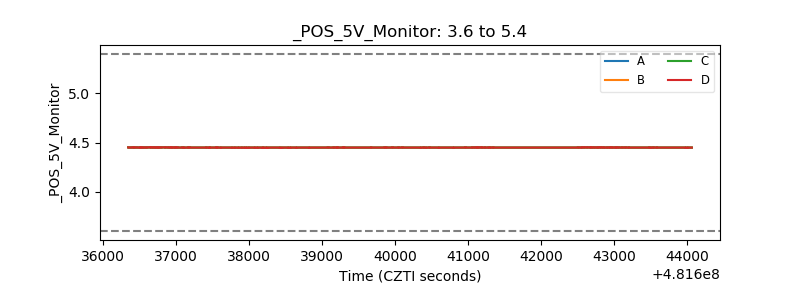 |
| _ROLL_ROT | 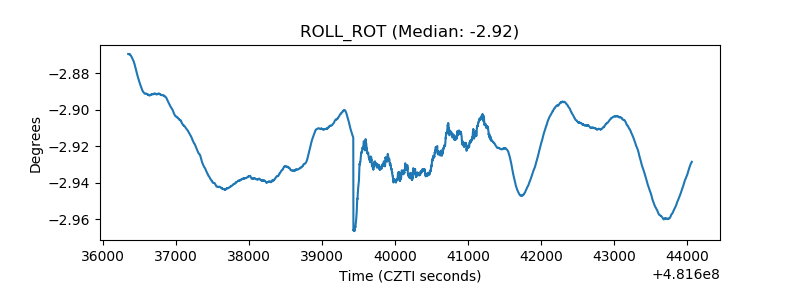 |
| _Roll_DEC | 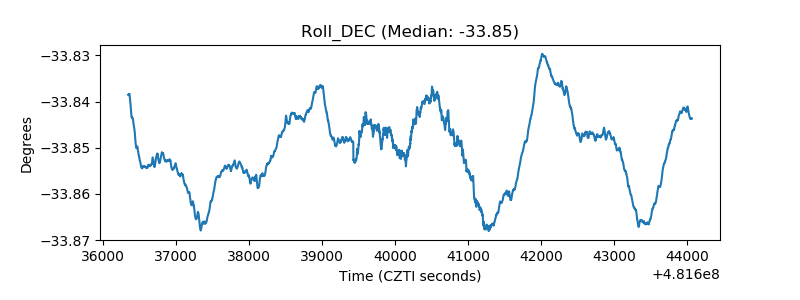 |
| _Roll_RA | 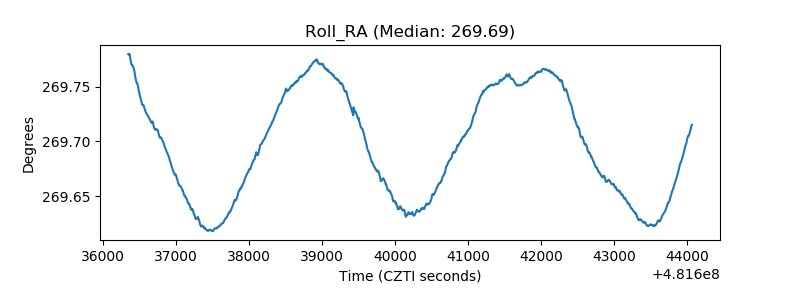 |
| Veto Counter | 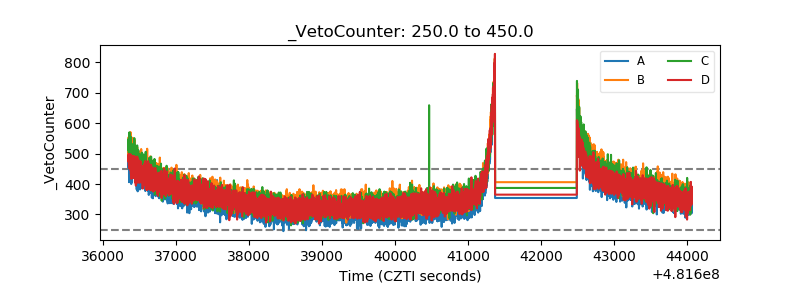 |