| Param | Original file | Final file |
|---|---|---|
| Filename | modeM0/AS1A13_090T01_9000006458_51510cztM0_level2.fits | modeM0/AS1A13_090T01_9000006458_51510cztM0_level2_quad_clean.evt |
| Size (bytes) | 789,431,040 | 81,938,880 |
| Size | 752.9 MB | 78.1 MB |
| Events in quadrant A | 5,914,340 | 573,855 |
| Events in quadrant B | 4,123,924 | 679,871 |
| Events in quadrant C | 3,789,905 | 612,630 |
| Events in quadrant D | 14,889,684 | 160,668 |
| Mode M0 | |||
|---|---|---|---|
| Quadrant | BADHDUFLAG | Total packets | Discarded packets |
| A | 0 | 21785 | 1 |
| B | 0 | 16594 | 2 |
| C | 0 | 15617 | 1 |
| D | 0 | 48753 | 1 |
| Mode M9 | |||
|---|---|---|---|
| Quadrant | BADHDUFLAG | Total packets | Discarded packets |
| A | 0 | 11 | 0 |
| B | 0 | 11 | 0 |
| C | 0 | 11 | 0 |
| D | 0 | 11 | 0 |
| Mode SS | |||
|---|---|---|---|
| Quadrant | BADHDUFLAG | Total packets | Discarded packets |
| A | 0 | 132 | 0 |
| B | 0 | 132 | 0 |
| C | 0 | 132 | 0 |
| D | 0 | 132 | 0 |
| Quadrant | Total seconds | Saturated seconds | Saturation percentage |
|---|---|---|---|
| A | 6506 | 820 | 12.603750% |
| B | 6506 | 294 | 4.518906% |
| C | 6506 | 186 | 2.858899% |
| D | 6506 | 5000 | 76.852136% |
Noise dominated data is calculated using 1-second bins in cleaned event files. If a bin has >2000 counts, and if more than 50% of those come from <1% of pixels, then it is considered to be noise-dominated and hence unusable.
| Quadrant | # 1 sec bins | Bins with >0 counts | Bins with >2000 counts | High rate bins dominated by noise | Noise dominated (total time) | Noise dominated (detector-on time) | Marked lightcurve |
|---|---|---|---|---|---|---|---|
| A | 7581 | 6507 | 589 | 589 | 7.77% | 9.05% | 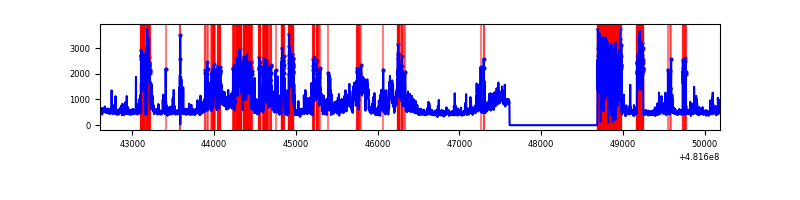 |
| B | 7581 | 6507 | 92 | 92 | 1.21% | 1.41% | 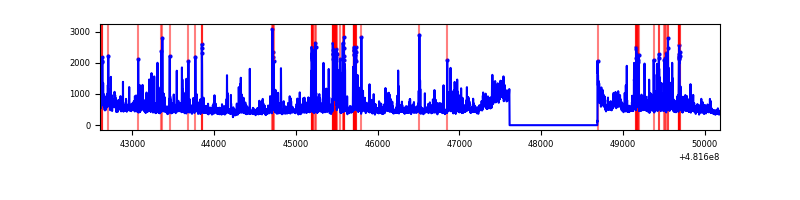 |
| C | 7581 | 6507 | 114 | 114 | 1.50% | 1.75% | 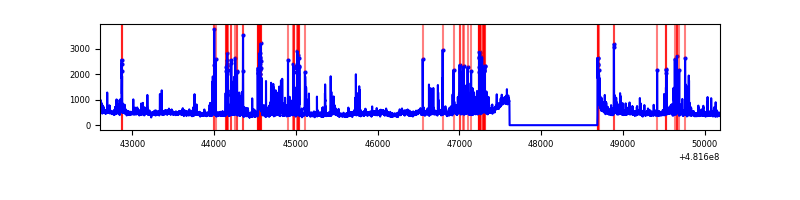 |
| D | 7581 | 6507 | 4930 | 4930 | 65.03% | 75.76% | 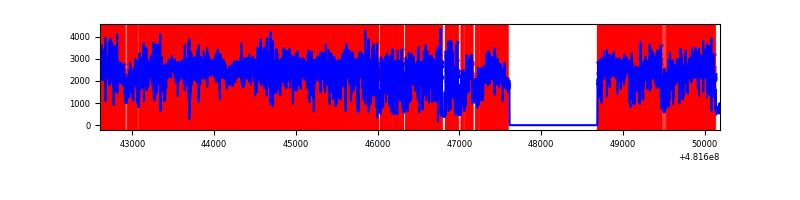 |
Top three noisy pixels from each quadrant. If the there are fewer than three noisy pixels in the level2.evt file, extra rows are filled as -1
| Pixel properties | Quadrant properties | ||||||
|---|---|---|---|---|---|---|---|
| Quadrant | DetID | PixID | Counts | Sigma | Mean | Median | Sigma |
| A | 7 | 64 | 751934 | 4477.67 | 689 | 671 | 167.8 |
| A | 4 | 175 | 543443 | 3235.02 | 689 | 671 | 167.8 |
| A | 12 | 3 | 454090 | 2702.46 | 689 | 671 | 167.8 |
| B | 7 | 252 | 279455 | 1823.3 | 721 | 695 | 152.9 |
| B | 0 | 171 | 202167 | 1317.78 | 721 | 695 | 152.9 |
| B | 15 | 52 | 184727 | 1203.71 | 721 | 695 | 152.9 |
| C | 13 | 3 | 277912 | 1406.22 | 713 | 706 | 197.1 |
| C | 15 | 1 | 206953 | 1046.25 | 713 | 706 | 197.1 |
| C | 12 | 247 | 146284 | 738.49 | 713 | 706 | 197.1 |
| D | 8 | 176 | 12133771 | 102180.31 | 424 | 409 | 118.7 |
| D | 8 | 192 | 362790 | 3051.77 | 424 | 409 | 118.7 |
| D | 13 | 84 | 279758 | 2352.52 | 424 | 409 | 118.7 |
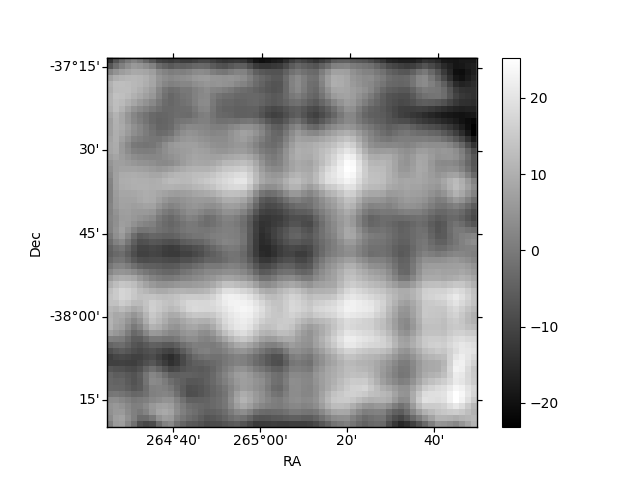
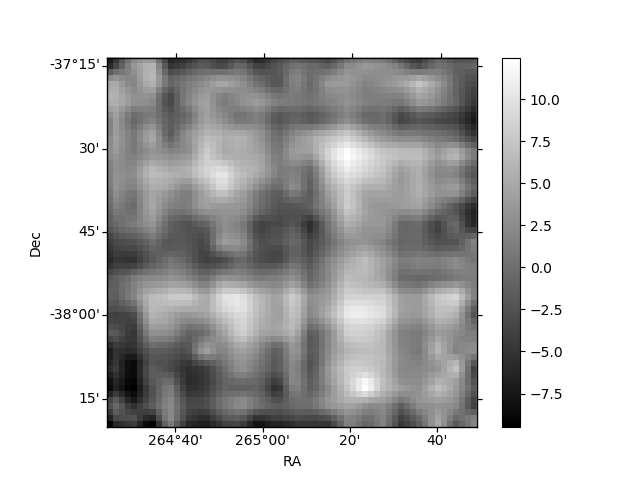
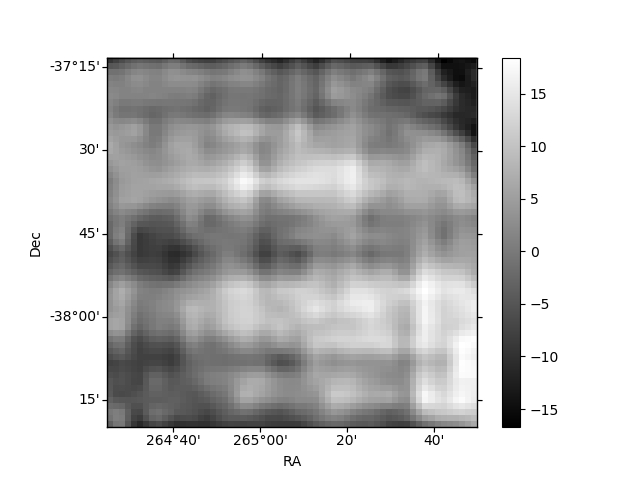
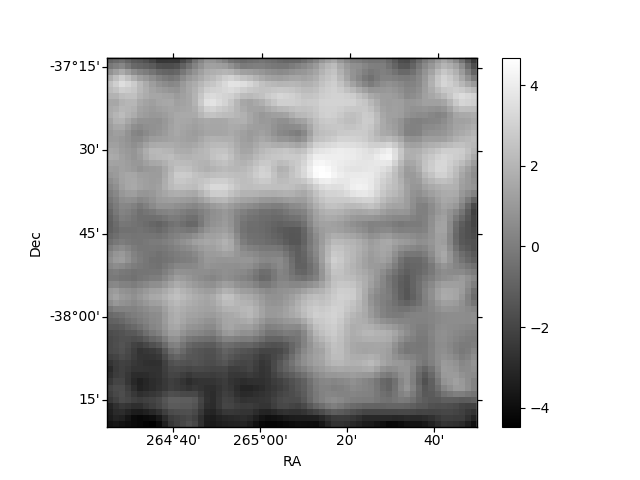
Histogram calculated using DETX and DETY for each event in the final _common_clean file
| Quadrant A | 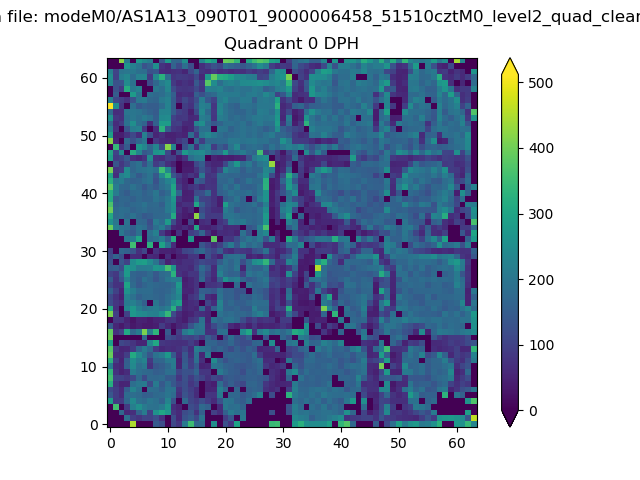 |
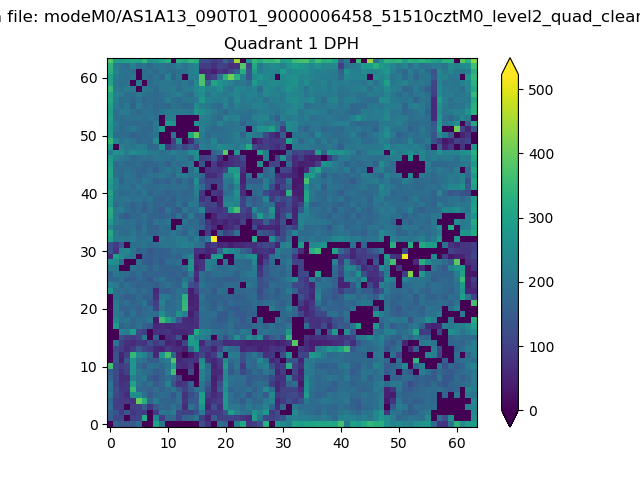 |
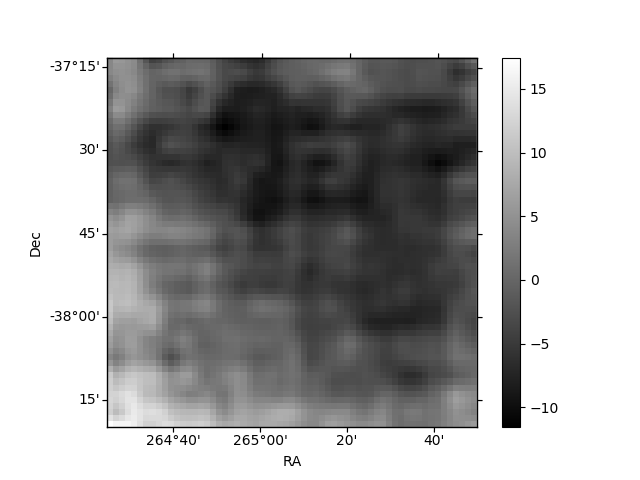
Quadrant B |
|---|---|---|---|
| Quadrant D | 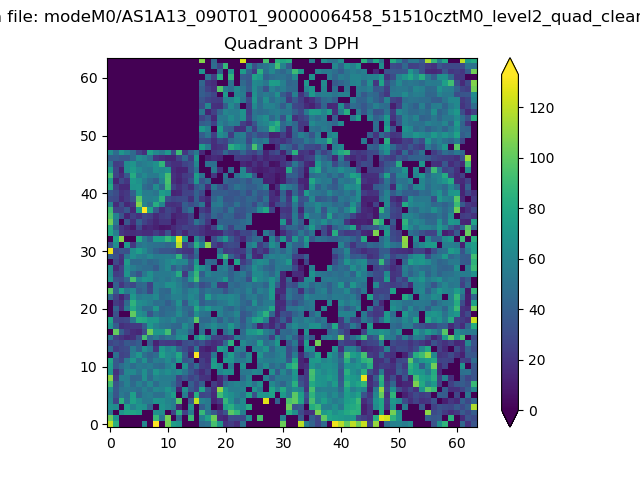 |
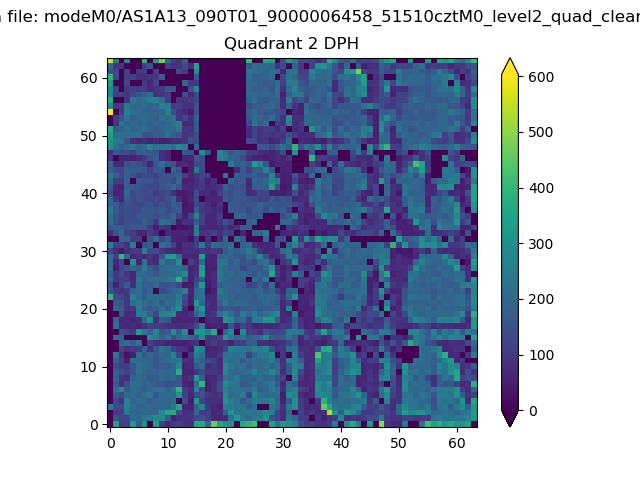 |
Quadrant C |
| Plot type | Count rate plots | Images |
|---|---|---|
| Comparison with Poisson distribution Blue bars denote a histogram of data divided into 1 sec bins. Red curve is a Poisson curve with rate = median count rate of data. |
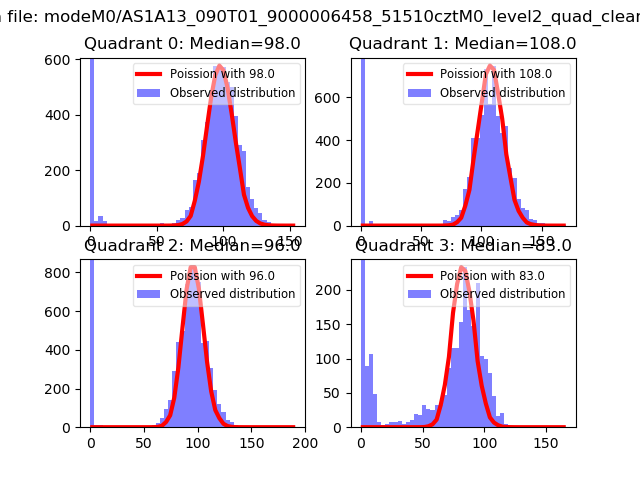 |
 |
| Quadrant-wise count rates Data is divided into 100 sec bins |
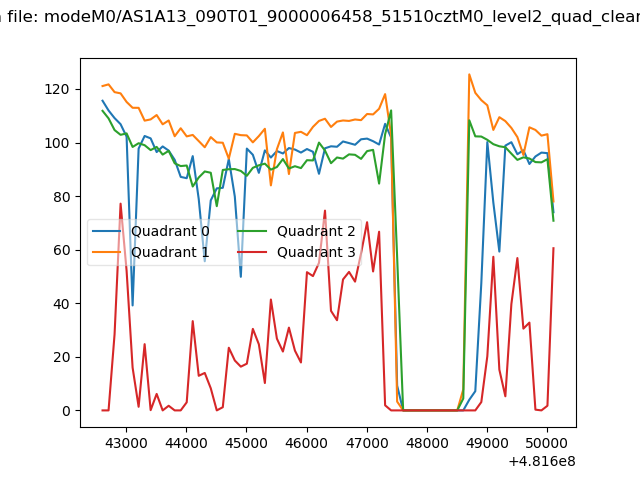 |
|
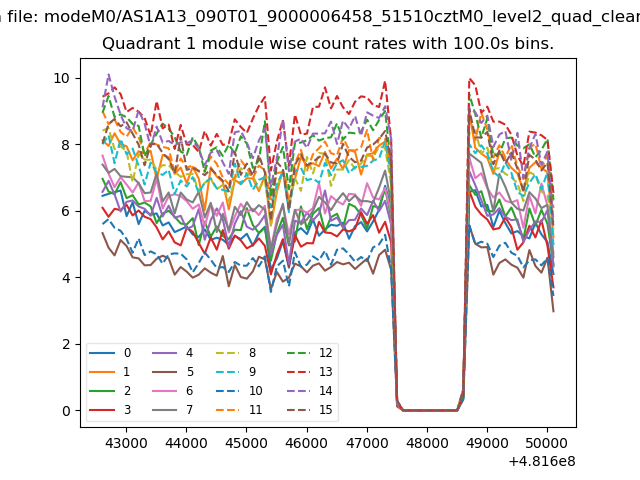
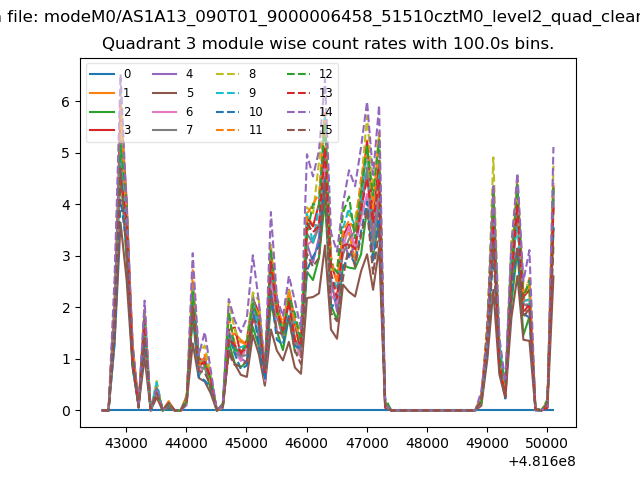
| Module-wise count rates for Quadrant A Data is divided into 100 sec bins |
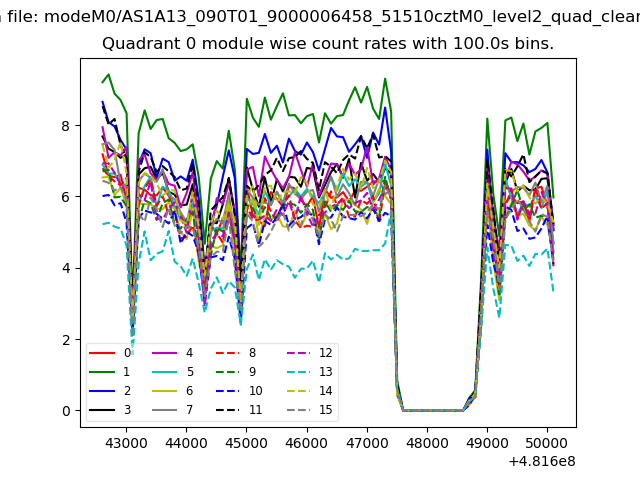 |
 |
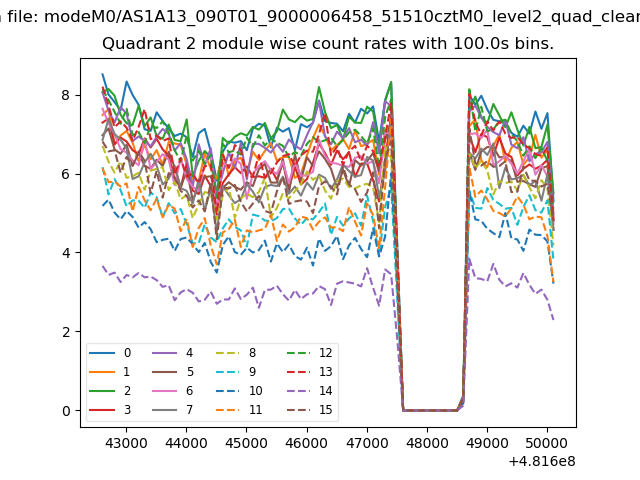
| Module-wise count rates for Quadrant B Data is divided into 100 sec bins |
 |
 |
| Module-wise count rates for Quadrant C Data is divided into 100 sec bins |
 |
 |
| Module-wise count rates for Quadrant D Data is divided into 100 sec bins |
 |
 |
| Parameter | Plot |
|---|---|
| CZT HV Monitor | 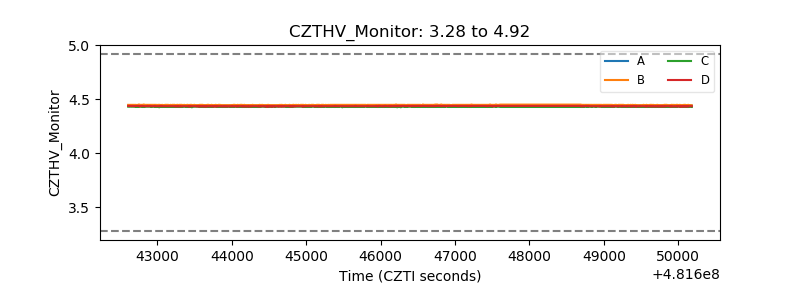 |
| D_VDD | 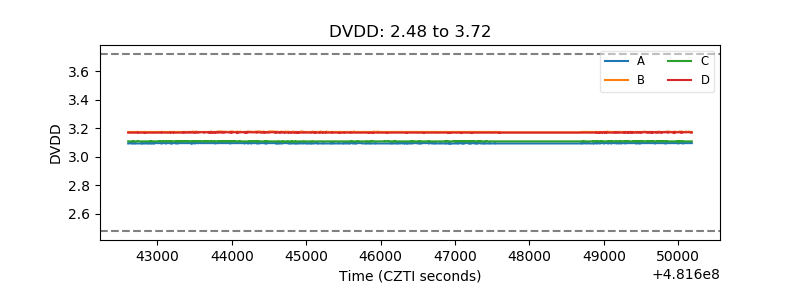 |
| Temperature 1 | 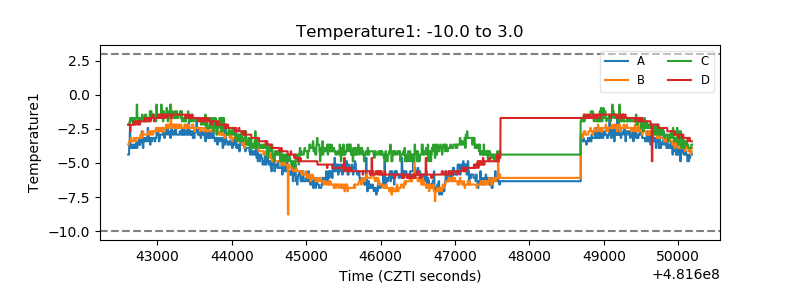 |
| Veto HV Monitor | 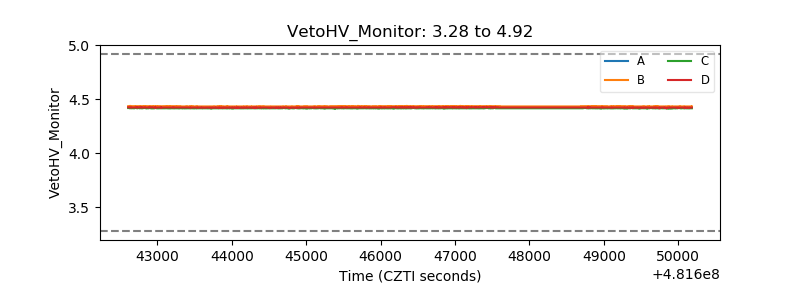 |
| Veto LLD | 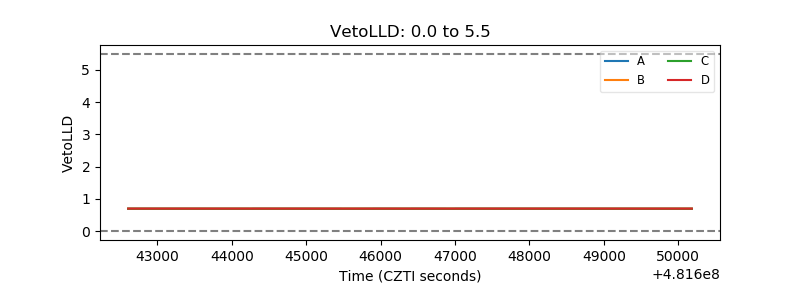 |
| Alpha Counter | 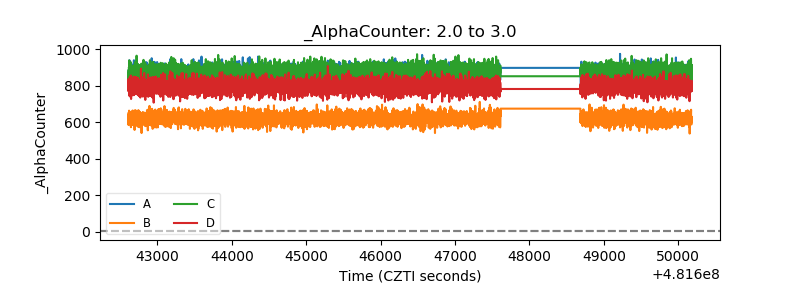 |
| _CPM_Rate | 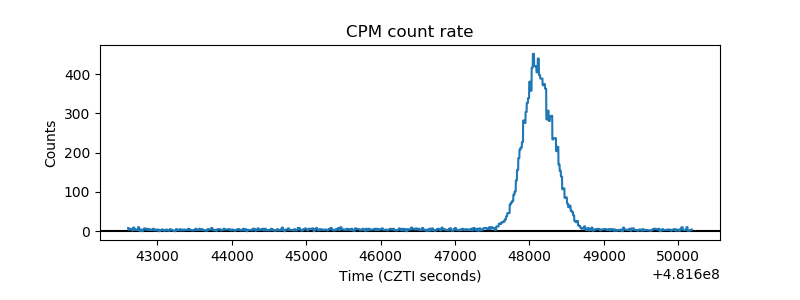 |
| CZT Counter | 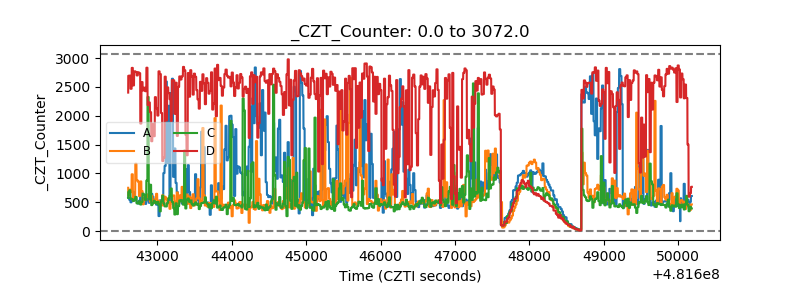 |
| +2.5 Volts monitor | 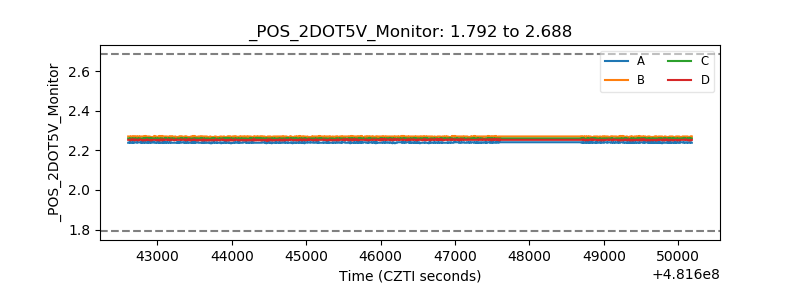 |
| +5 Volts monitor | 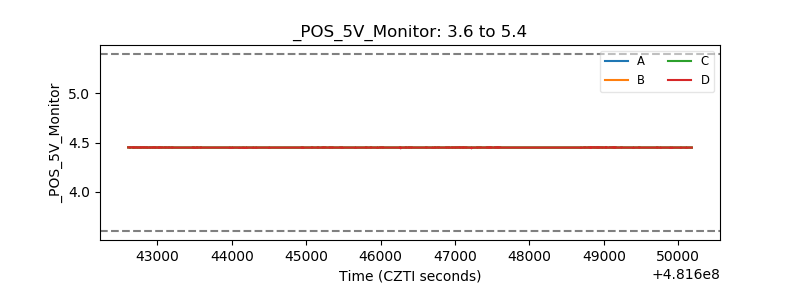 |
| _ROLL_ROT | 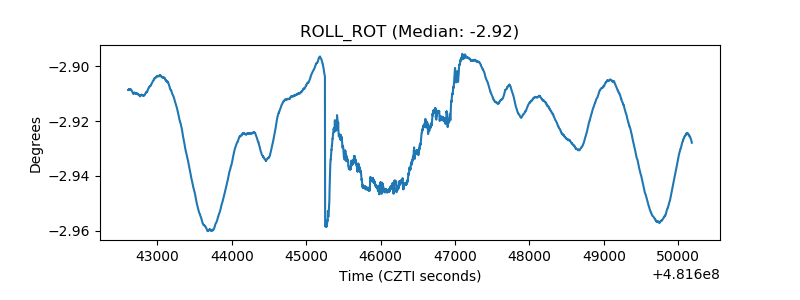 |
| _Roll_DEC | 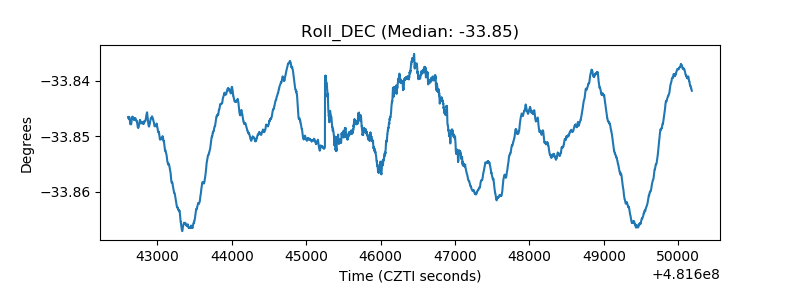 |
| _Roll_RA | 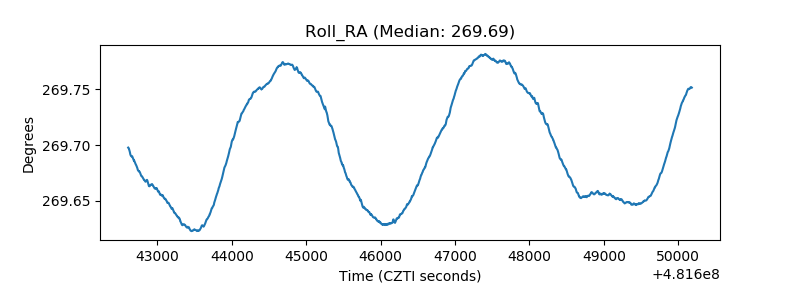 |
| Veto Counter | 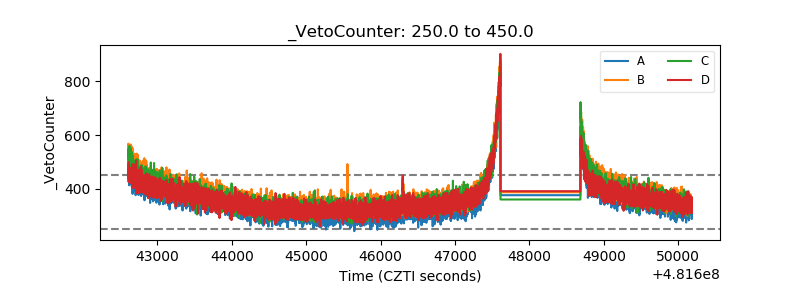 |