| Param | Original file | Final file |
|---|---|---|
| Filename | modeM0/AS1A13_090T01_9000006458_51512cztM0_level2.fits | modeM0/AS1A13_090T01_9000006458_51512cztM0_level2_quad_clean.evt |
| Size (bytes) | 571,155,840 | 87,739,200 |
| Size | 544.7 MB | 83.7 MB |
| Events in quadrant A | 4,889,783 | 588,003 |
| Events in quadrant B | 3,826,125 | 653,678 |
| Events in quadrant C | 3,800,250 | 581,687 |
| Events in quadrant D | 8,126,886 | 384,798 |
| Mode M0 | |||
|---|---|---|---|
| Quadrant | BADHDUFLAG | Total packets | Discarded packets |
| A | 0 | 18903 | 1 |
| B | 0 | 15756 | 1 |
| C | 0 | 15676 | 1 |
| D | 0 | 28697 | 1 |
| Mode M9 | |||
|---|---|---|---|
| Quadrant | BADHDUFLAG | Total packets | Discarded packets |
| A | 0 | 8 | 0 |
| B | 0 | 8 | 0 |
| C | 0 | 8 | 0 |
| D | 0 | 8 | 0 |
| Mode SS | |||
|---|---|---|---|
| Quadrant | BADHDUFLAG | Total packets | Discarded packets |
| A | 0 | 130 | 0 |
| B | 0 | 130 | 0 |
| C | 0 | 130 | 0 |
| D | 0 | 130 | 0 |
| Quadrant | Total seconds | Saturated seconds | Saturation percentage |
|---|---|---|---|
| A | 6431 | 371 | 5.768932% |
| B | 6430 | 158 | 2.457232% |
| C | 6430 | 124 | 1.928460% |
| D | 6431 | 2043 | 31.767999% |
Noise dominated data is calculated using 1-second bins in cleaned event files. If a bin has >2000 counts, and if more than 50% of those come from <1% of pixels, then it is considered to be noise-dominated and hence unusable.
| Quadrant | # 1 sec bins | Bins with >0 counts | Bins with >2000 counts | High rate bins dominated by noise | Noise dominated (total time) | Noise dominated (detector-on time) | Marked lightcurve |
|---|---|---|---|---|---|---|---|
| A | 7216 | 6432 | 215 | 215 | 2.98% | 3.34% | 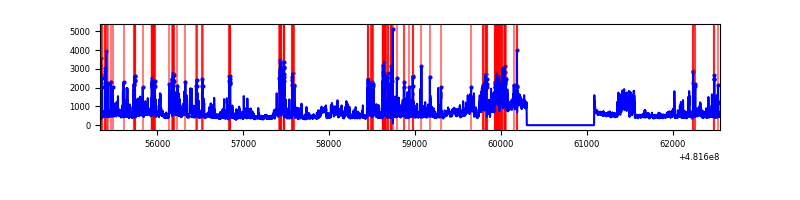 |
| B | 7215 | 6431 | 21 | 21 | 0.29% | 0.33% | 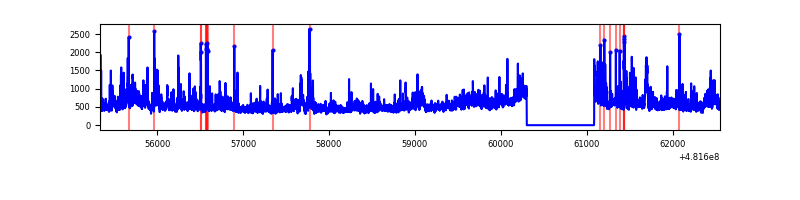 |
| C | 7215 | 6431 | 87 | 87 | 1.21% | 1.35% | 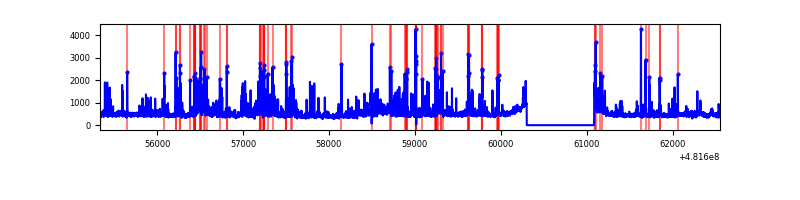 |
| D | 7216 | 6432 | 2002 | 2002 | 27.74% | 31.13% | 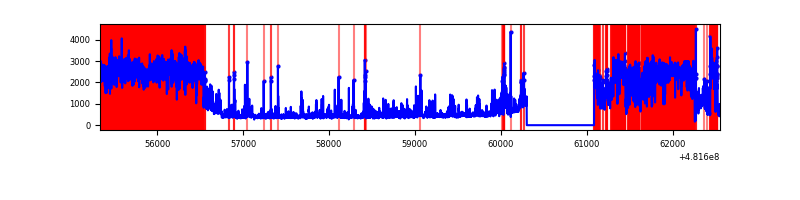 |
Top three noisy pixels from each quadrant. If the there are fewer than three noisy pixels in the level2.evt file, extra rows are filled as -1
| Pixel properties | Quadrant properties | ||||||
|---|---|---|---|---|---|---|---|
| Quadrant | DetID | PixID | Counts | Sigma | Mean | Median | Sigma |
| A | 12 | 3 | 537482 | 3207.85 | 683 | 667 | 167.3 |
| A | 8 | 43 | 244958 | 1459.81 | 683 | 667 | 167.3 |
| A | 7 | 235 | 243483 | 1451.0 | 683 | 667 | 167.3 |
| B | 15 | 52 | 299832 | 2015.57 | 691 | 669 | 148.4 |
| B | 2 | 208 | 117380 | 786.33 | 691 | 669 | 148.4 |
| B | 8 | 128 | 104781 | 701.44 | 691 | 669 | 148.4 |
| C | 15 | 1 | 301446 | 1614.57 | 676 | 670 | 186.3 |
| C | 12 | 252 | 249342 | 1334.88 | 676 | 670 | 186.3 |
| C | 13 | 3 | 211260 | 1130.45 | 676 | 670 | 186.3 |
| D | 8 | 176 | 4555640 | 27883.45 | 580 | 560 | 163.4 |
| D | 6 | 228 | 475040 | 2904.48 | 580 | 560 | 163.4 |
| D | 8 | 192 | 255956 | 1563.38 | 580 | 560 | 163.4 |
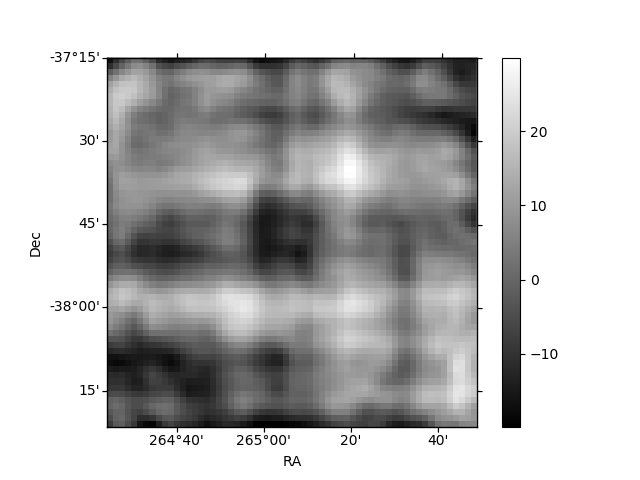
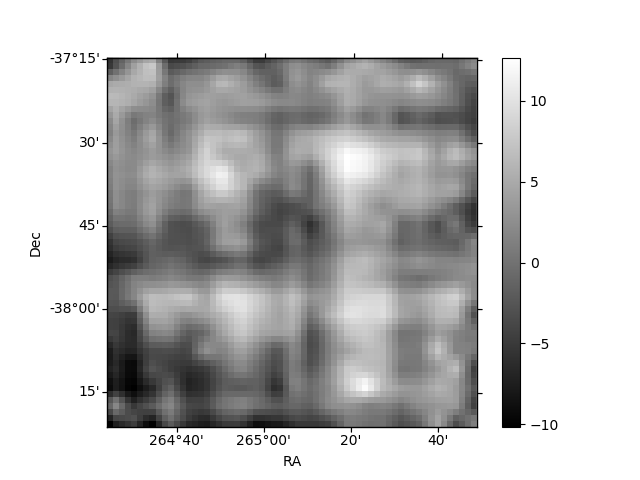
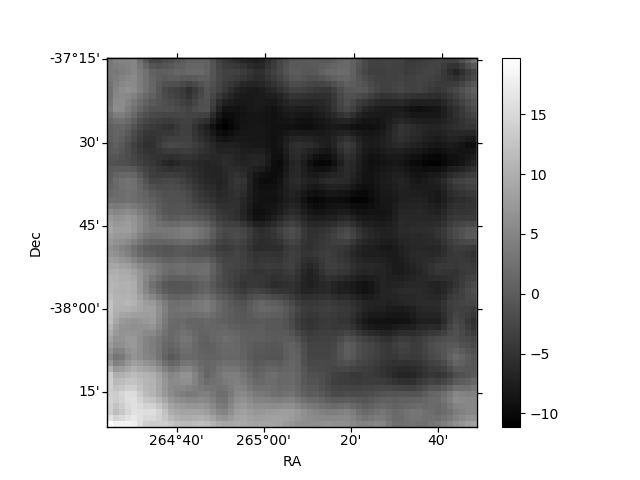
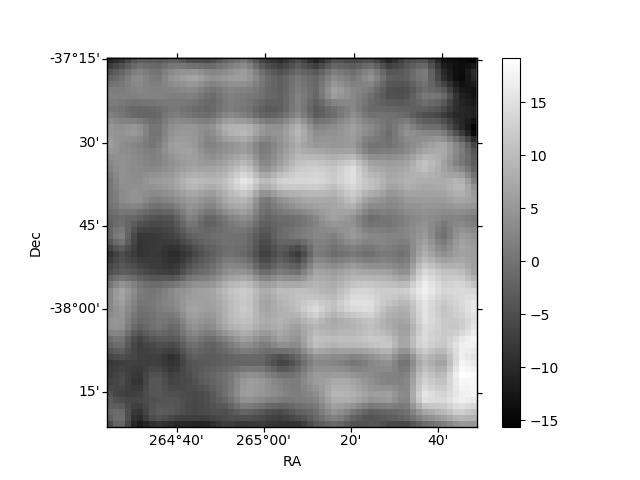
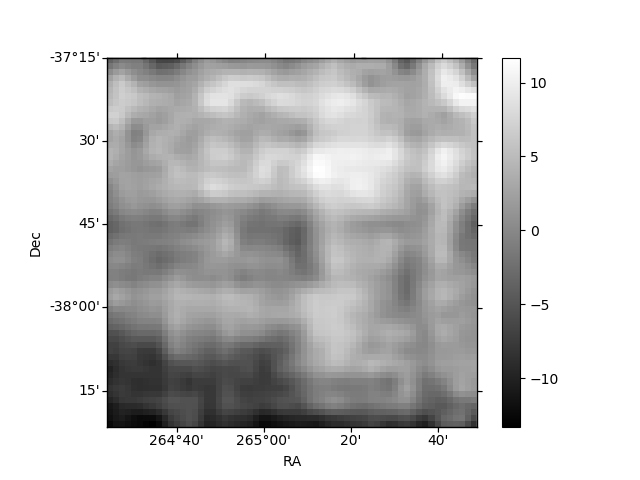
Histogram calculated using DETX and DETY for each event in the final _common_clean file
| Quadrant A | 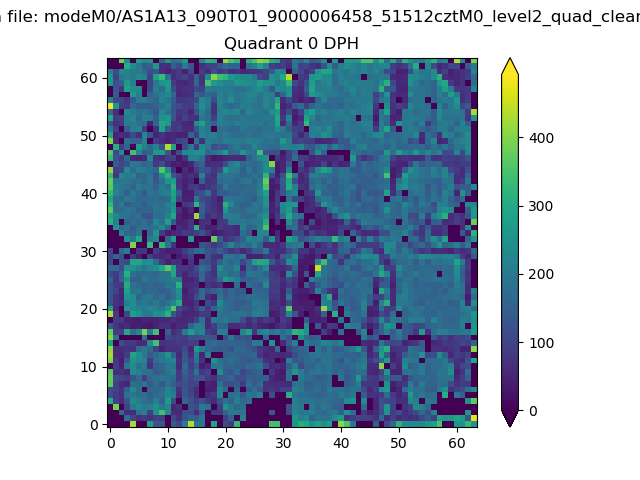 |
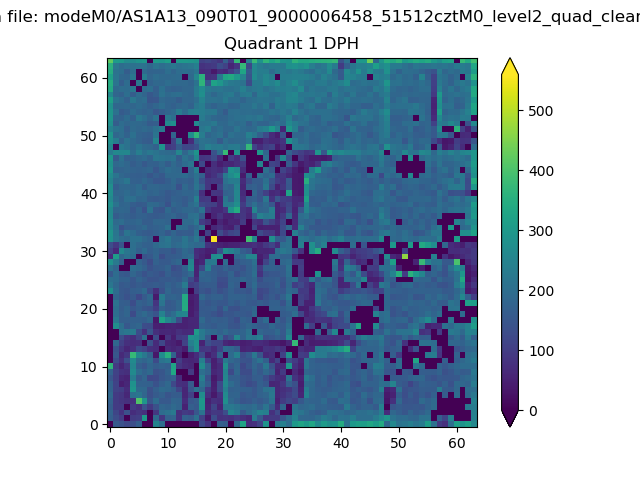 |
Quadrant B |
|---|---|---|---|
| Quadrant D | 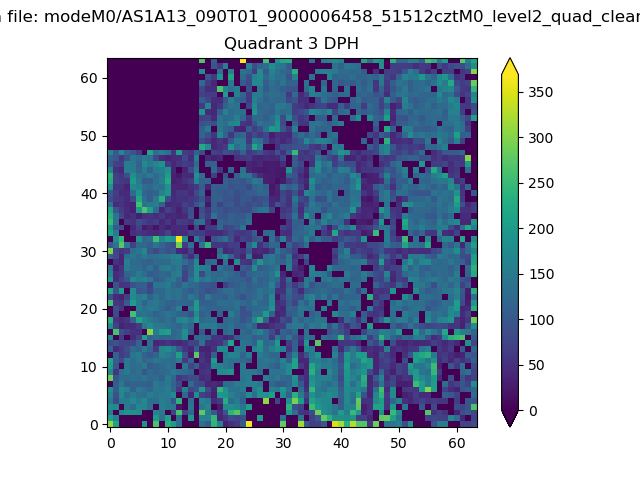 |
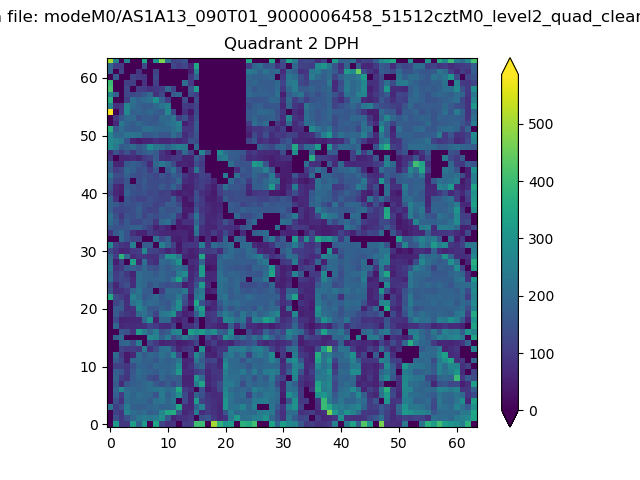 |
Quadrant C |
| Plot type | Count rate plots | Images |
|---|---|---|
| Comparison with Poisson distribution Blue bars denote a histogram of data divided into 1 sec bins. Red curve is a Poisson curve with rate = median count rate of data. |
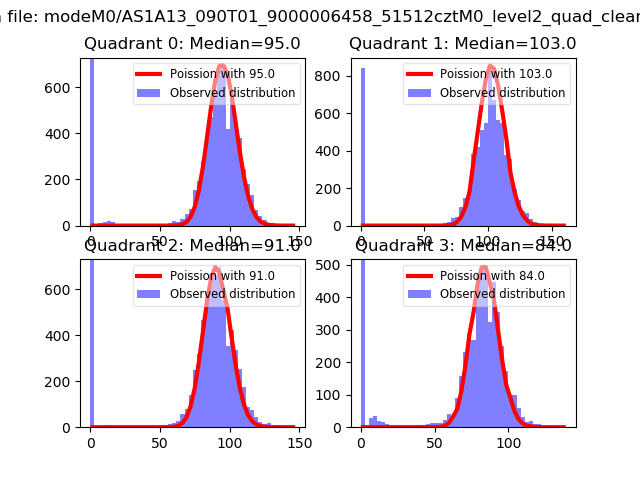 |
 |
| Quadrant-wise count rates Data is divided into 100 sec bins |
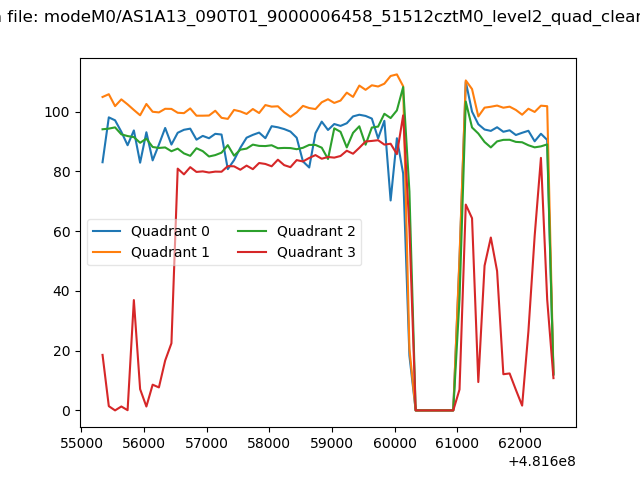 |
|
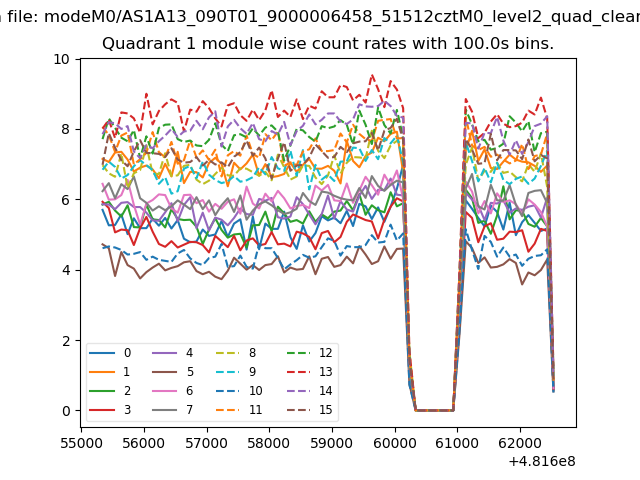
| Module-wise count rates for Quadrant A Data is divided into 100 sec bins |
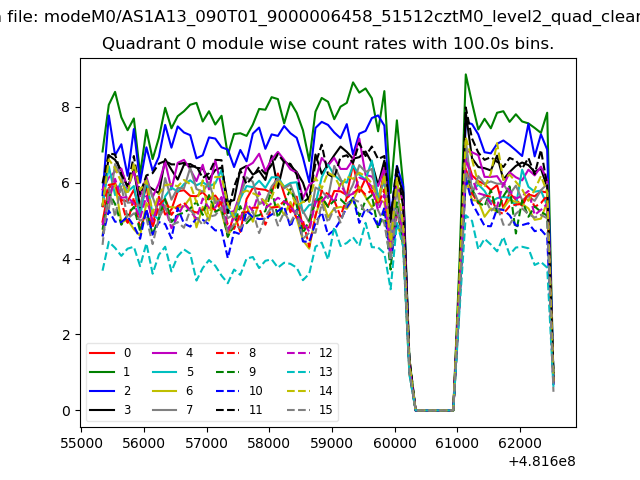 |
 |
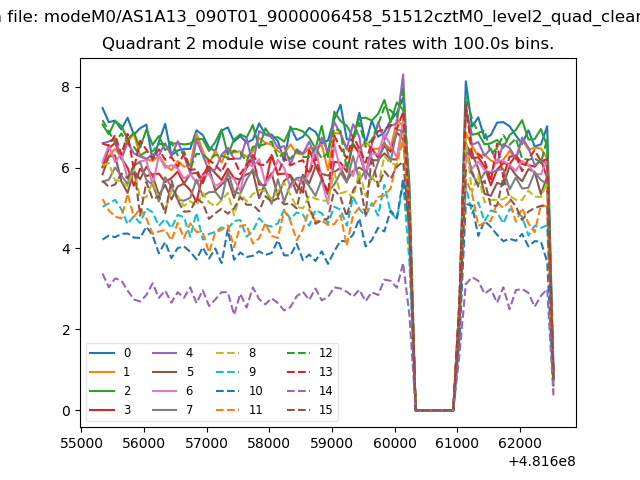
| Module-wise count rates for Quadrant B Data is divided into 100 sec bins |
 |
 |
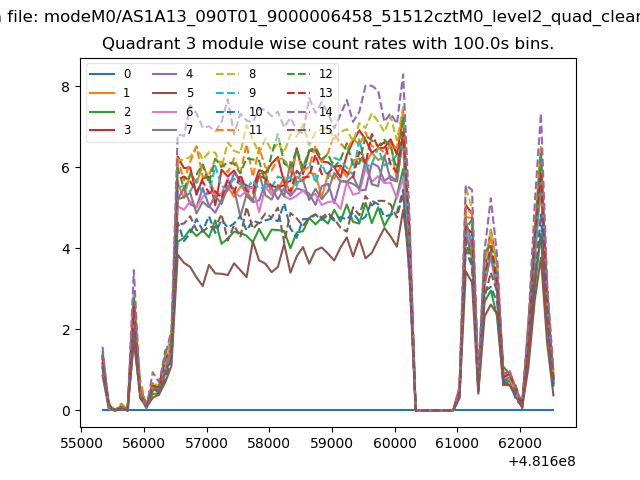
| Module-wise count rates for Quadrant C Data is divided into 100 sec bins |
 |
 |
| Module-wise count rates for Quadrant D Data is divided into 100 sec bins |
 |
 |
| Parameter | Plot |
|---|---|
| CZT HV Monitor | 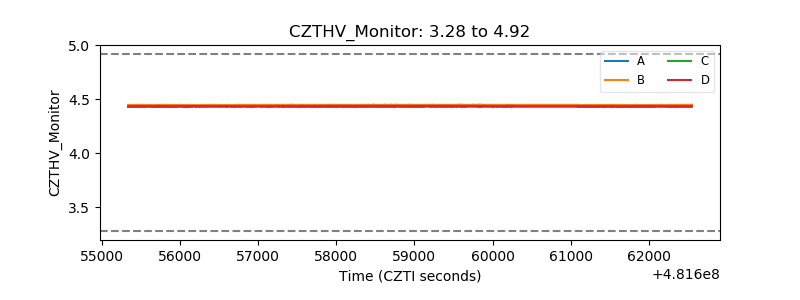 |
| D_VDD | 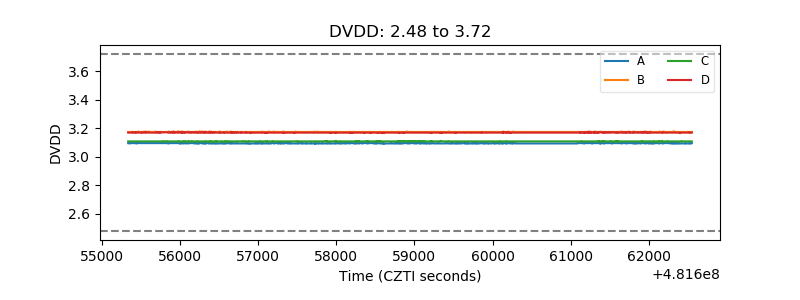 |
| Temperature 1 | 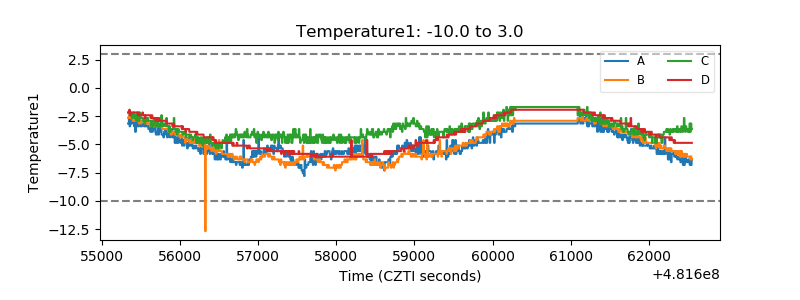 |
| Veto HV Monitor | 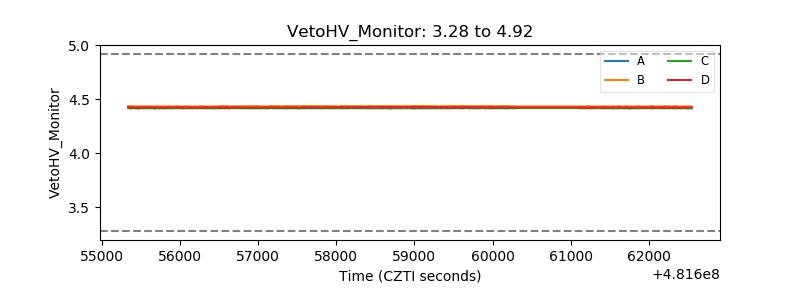 |
| Veto LLD | 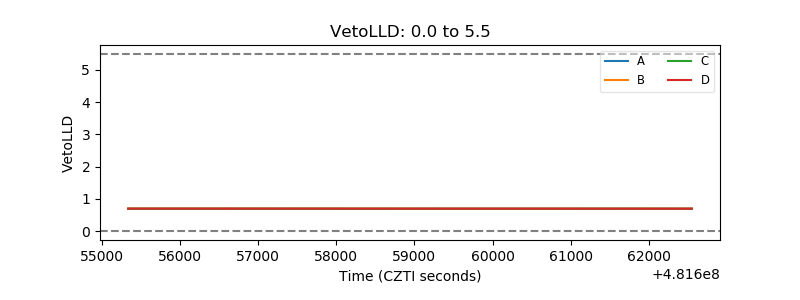 |
| Alpha Counter | 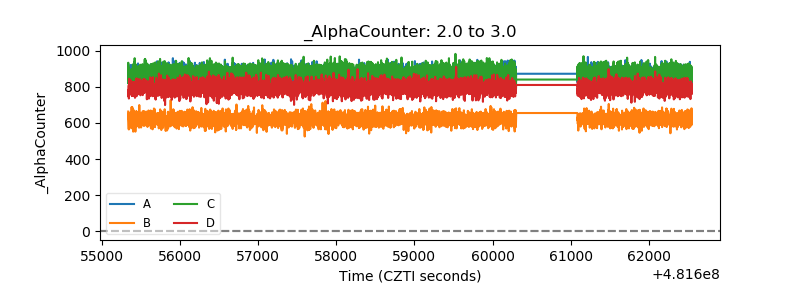 |
| _CPM_Rate | 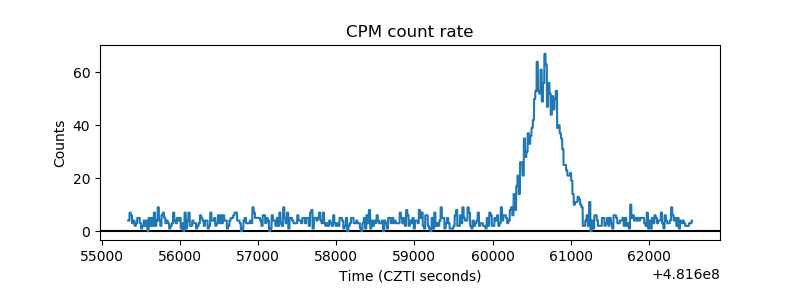 |
| CZT Counter | 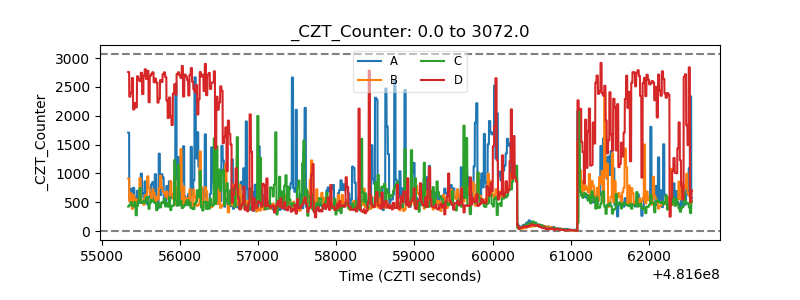 |
| +2.5 Volts monitor | 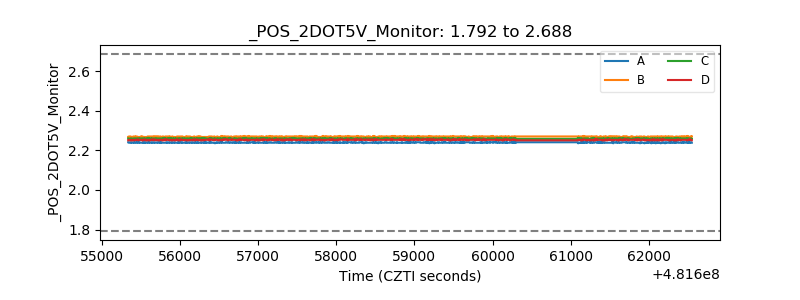 |
| +5 Volts monitor |  |
| _ROLL_ROT | 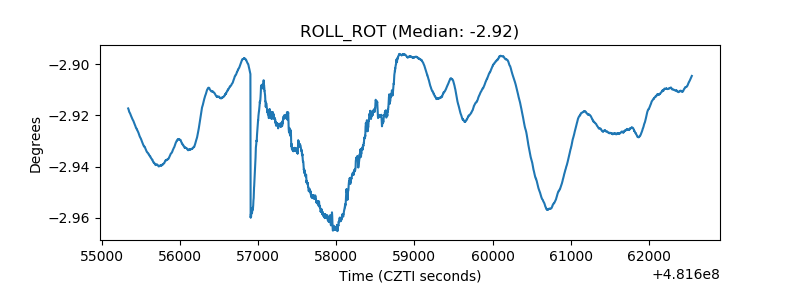 |
| _Roll_DEC | 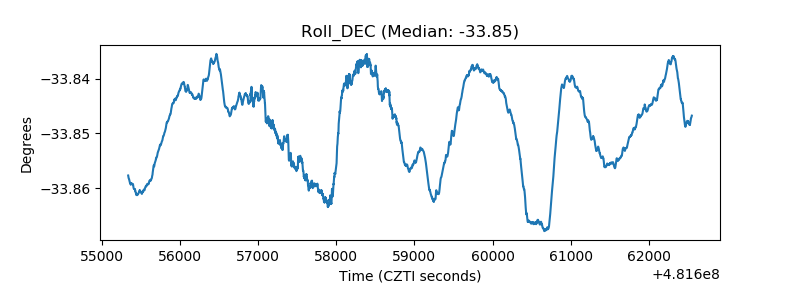 |
| _Roll_RA | 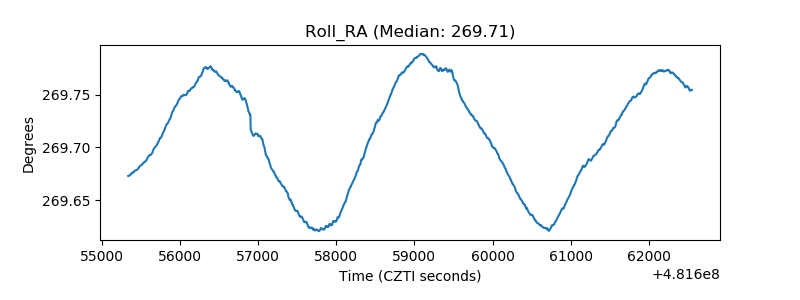 |
| Veto Counter | 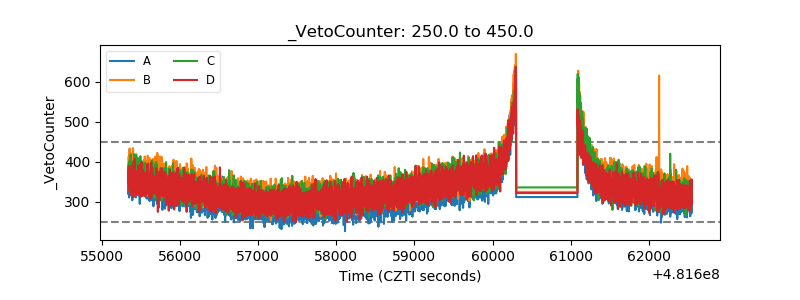 |