| Param | Original file | Final file |
|---|---|---|
| Filename | modeM0/AS1A13_090T01_9000006458_51513cztM0_level2.fits | modeM0/AS1A13_090T01_9000006458_51513cztM0_level2_quad_clean.evt |
| Size (bytes) | 663,549,120 | 99,115,200 |
| Size | 632.8 MB | 94.5 MB |
| Events in quadrant A | 5,451,117 | 680,504 |
| Events in quadrant B | 4,222,226 | 741,955 |
| Events in quadrant C | 4,684,307 | 650,439 |
| Events in quadrant D | 9,638,110 | 419,596 |
| Mode M0 | |||
|---|---|---|---|
| Quadrant | BADHDUFLAG | Total packets | Discarded packets |
| A | 0 | 21127 | 1 |
| B | 0 | 17402 | 1 |
| C | 0 | 19044 | 1 |
| D | 0 | 33748 | 1 |
| Mode M9 | |||
|---|---|---|---|
| Quadrant | BADHDUFLAG | Total packets | Discarded packets |
| A | 0 | 2 | 0 |
| B | 0 | 2 | 0 |
| C | 0 | 2 | 0 |
| D | 0 | 2 | 0 |
| Mode SS | |||
|---|---|---|---|
| Quadrant | BADHDUFLAG | Total packets | Discarded packets |
| A | 0 | 150 | 0 |
| B | 0 | 150 | 0 |
| C | 0 | 150 | 0 |
| D | 0 | 150 | 0 |
| Quadrant | Total seconds | Saturated seconds | Saturation percentage |
|---|---|---|---|
| A | 7305 | 275 | 3.764545% |
| B | 7306 | 167 | 2.285792% |
| C | 7306 | 240 | 3.284971% |
| D | 7306 | 2512 | 34.382699% |
Noise dominated data is calculated using 1-second bins in cleaned event files. If a bin has >2000 counts, and if more than 50% of those come from <1% of pixels, then it is considered to be noise-dominated and hence unusable.
| Quadrant | # 1 sec bins | Bins with >0 counts | Bins with >2000 counts | High rate bins dominated by noise | Noise dominated (total time) | Noise dominated (detector-on time) | Marked lightcurve |
|---|---|---|---|---|---|---|---|
| A | 7460 | 7307 | 155 | 155 | 2.08% | 2.12% | 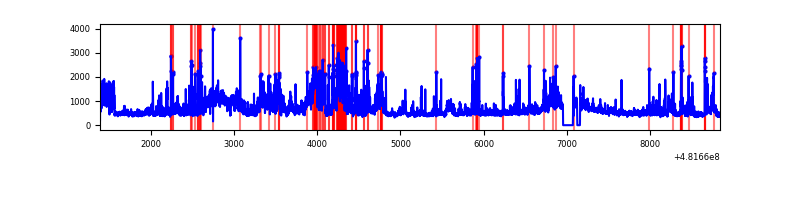 |
| B | 7461 | 7308 | 20 | 20 | 0.27% | 0.27% | 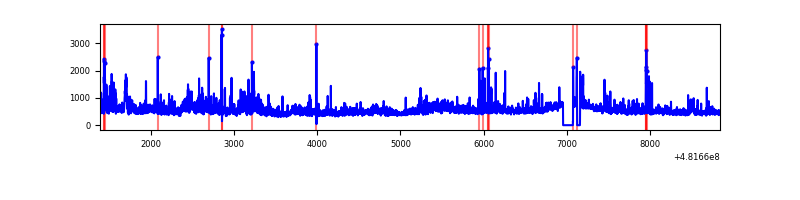 |
| C | 7461 | 7308 | 172 | 172 | 2.31% | 2.35% | 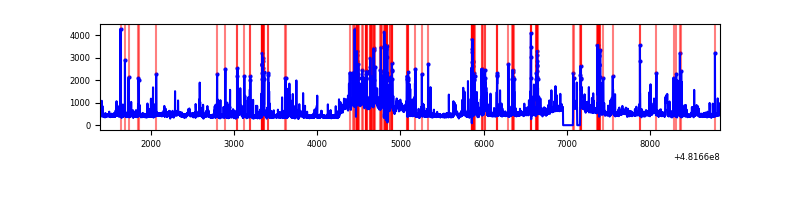 |
| D | 7460 | 7306 | 2201 | 2201 | 29.50% | 30.13% | 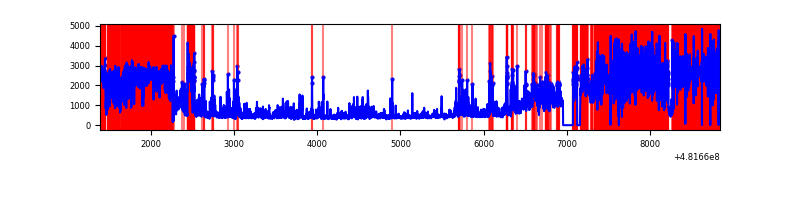 |
Top three noisy pixels from each quadrant. If the there are fewer than three noisy pixels in the level2.evt file, extra rows are filled as -1
| Pixel properties | Quadrant properties | ||||||
|---|---|---|---|---|---|---|---|
| Quadrant | DetID | PixID | Counts | Sigma | Mean | Median | Sigma |
| A | 12 | 250 | 668950 | 3404.62 | 790 | 768 | 196.3 |
| A | 12 | 3 | 658694 | 3352.37 | 790 | 768 | 196.3 |
| A | 15 | 174 | 240001 | 1218.98 | 790 | 768 | 196.3 |
| B | 15 | 52 | 388184 | 2287.17 | 790 | 762 | 169.4 |
| B | 8 | 128 | 100965 | 591.55 | 790 | 762 | 169.4 |
| B | 5 | 172 | 91172 | 533.74 | 790 | 762 | 169.4 |
| C | 15 | 1 | 606718 | 2865.97 | 767 | 760 | 211.4 |
| C | 13 | 3 | 414069 | 1954.8 | 767 | 760 | 211.4 |
| C | 12 | 252 | 132110 | 621.24 | 767 | 760 | 211.4 |
| D | 8 | 176 | 5735511 | 34567.46 | 594 | 573 | 165.9 |
| D | 6 | 228 | 595634 | 3586.74 | 594 | 573 | 165.9 |
| D | 11 | 176 | 363366 | 2186.74 | 594 | 573 | 165.9 |
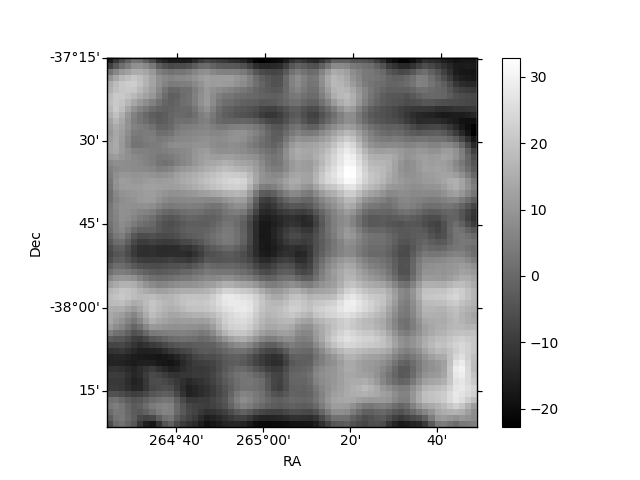
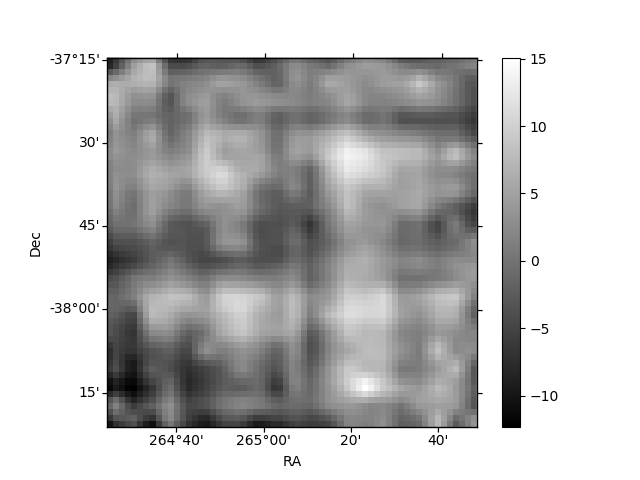
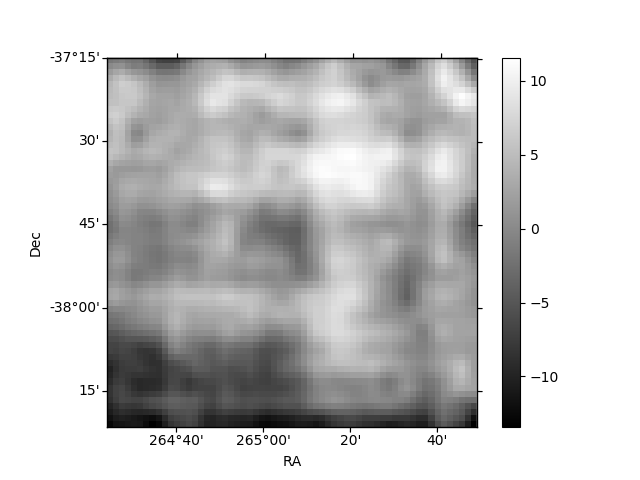
Histogram calculated using DETX and DETY for each event in the final _common_clean file
| Quadrant A | 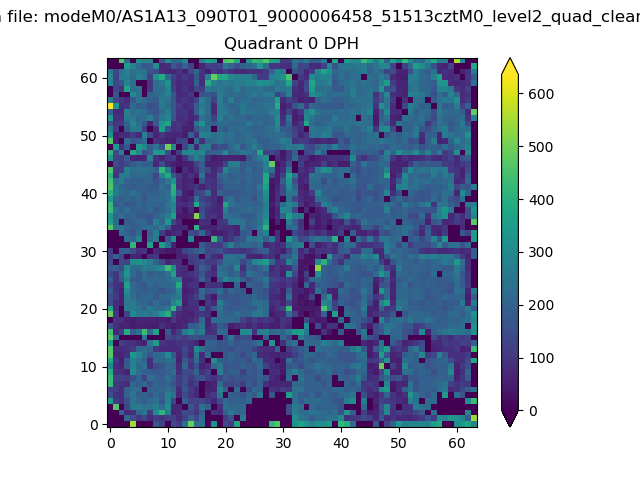 |
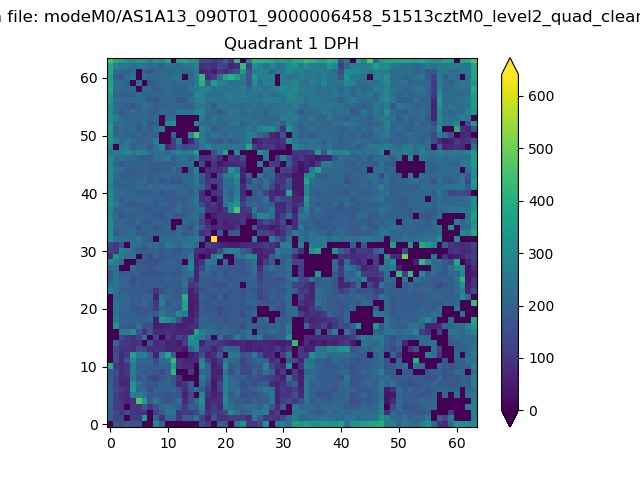 |
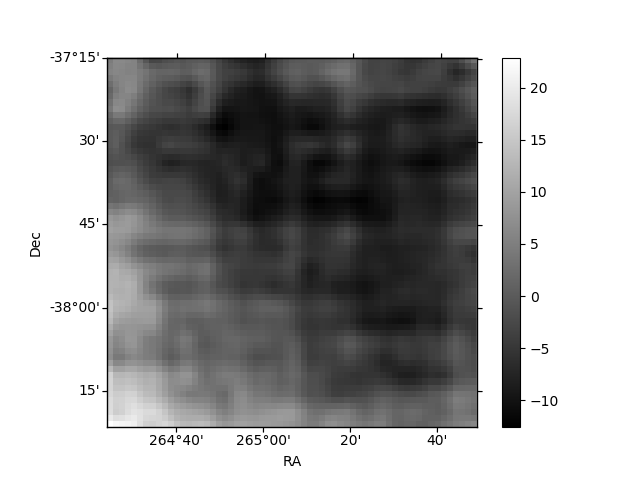
Quadrant B |
|---|---|---|---|
| Quadrant D | 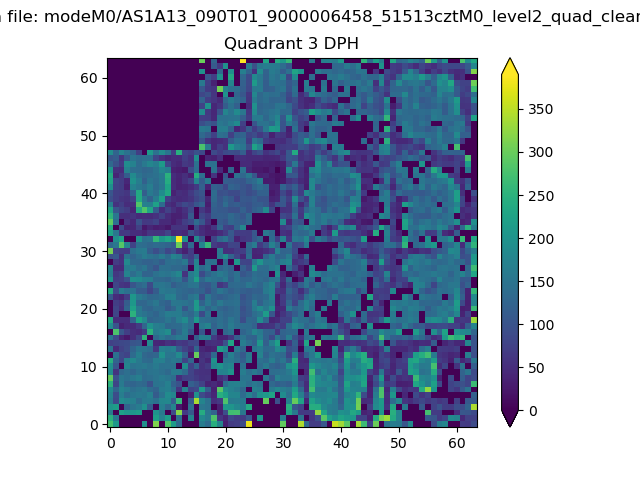 |
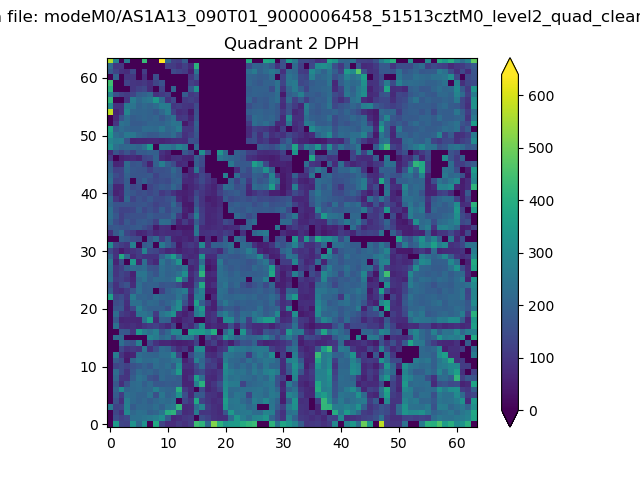 |
Quadrant C |
| Plot type | Count rate plots | Images |
|---|---|---|
| Comparison with Poisson distribution Blue bars denote a histogram of data divided into 1 sec bins. Red curve is a Poisson curve with rate = median count rate of data. |
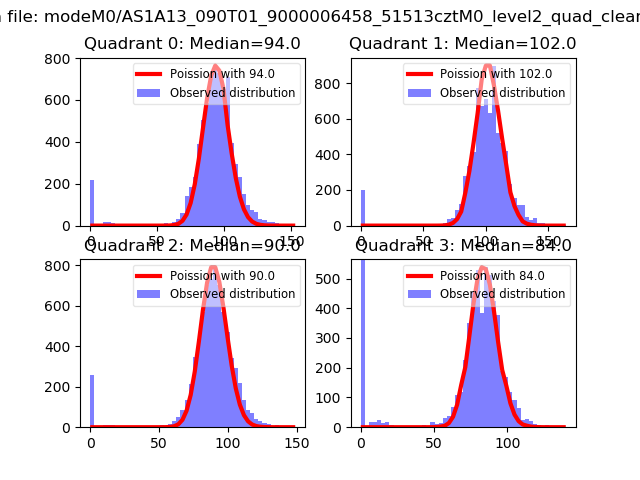 |
 |
| Quadrant-wise count rates Data is divided into 100 sec bins |
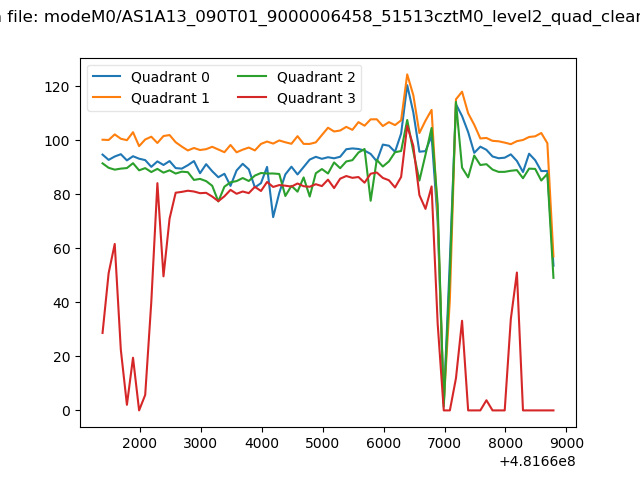 |
|
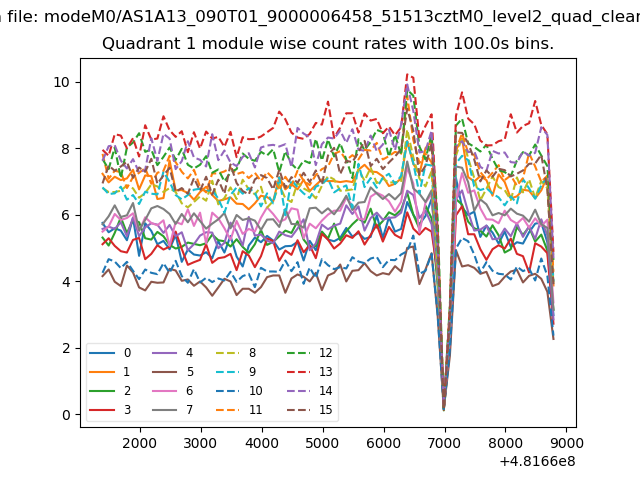
| Module-wise count rates for Quadrant A Data is divided into 100 sec bins |
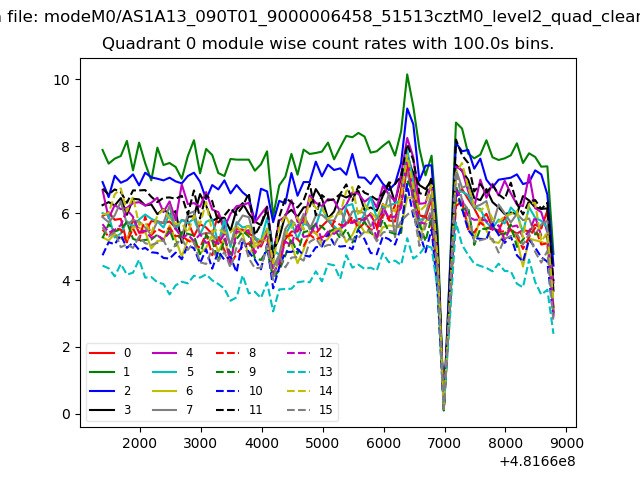 |
 |
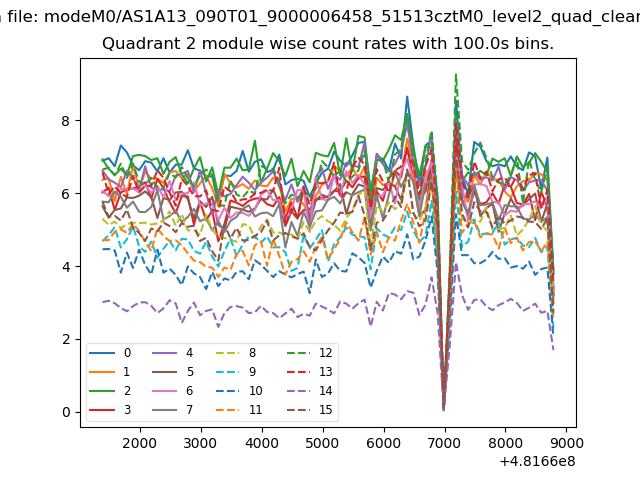
| Module-wise count rates for Quadrant B Data is divided into 100 sec bins |
 |
 |
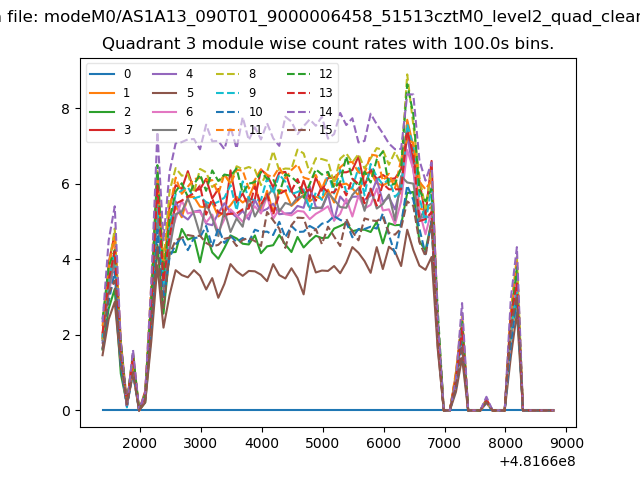
| Module-wise count rates for Quadrant C Data is divided into 100 sec bins |
 |
 |
| Module-wise count rates for Quadrant D Data is divided into 100 sec bins |
 |
 |
| Parameter | Plot |
|---|---|
| CZT HV Monitor | 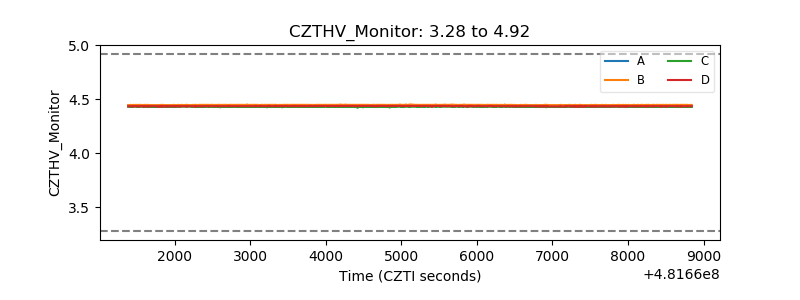 |
| D_VDD | 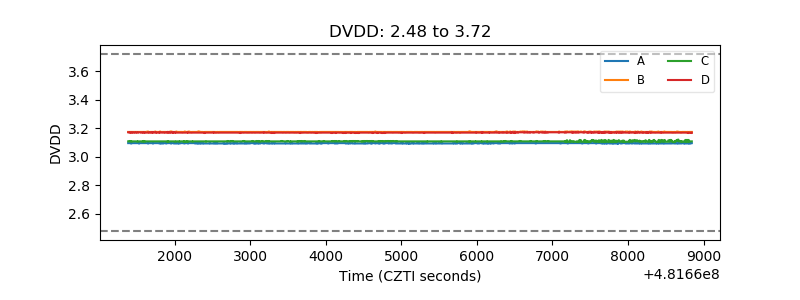 |
| Temperature 1 | 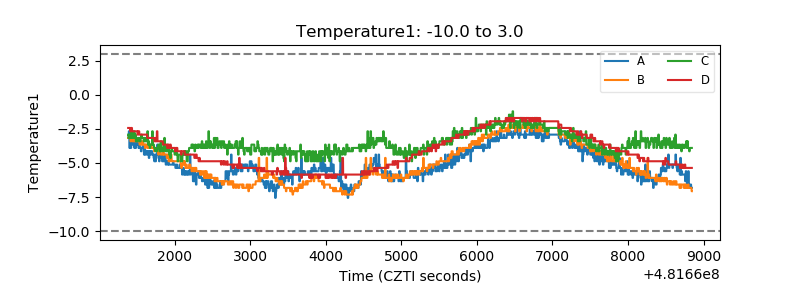 |
| Veto HV Monitor | 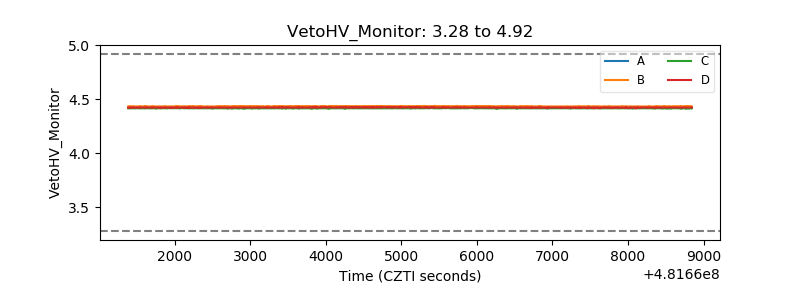 |
| Veto LLD | 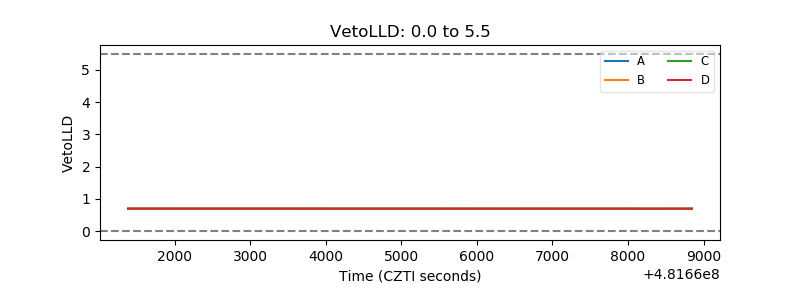 |
| Alpha Counter | 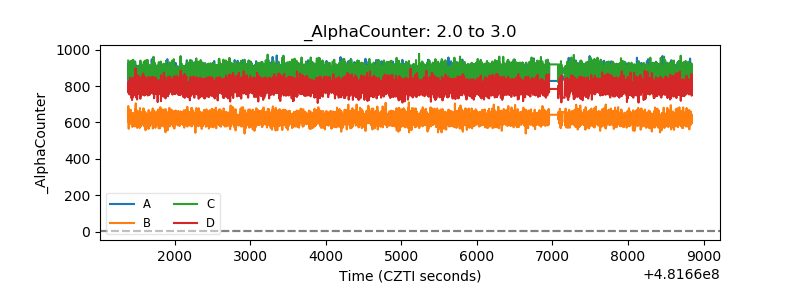 |
| _CPM_Rate | 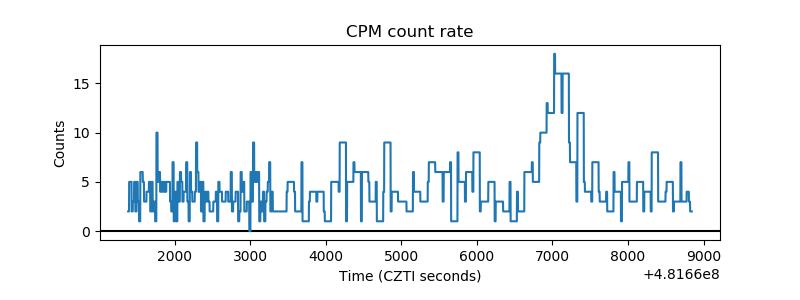 |
| CZT Counter | 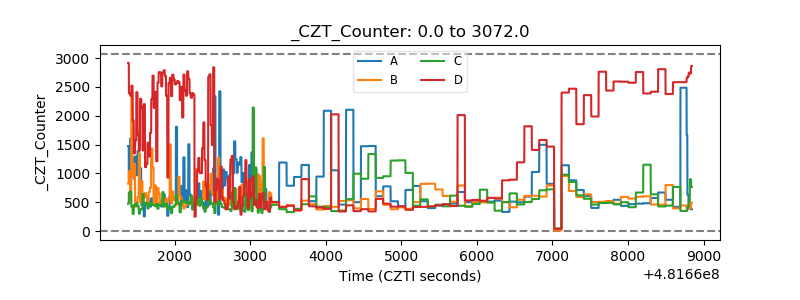 |
| +2.5 Volts monitor | 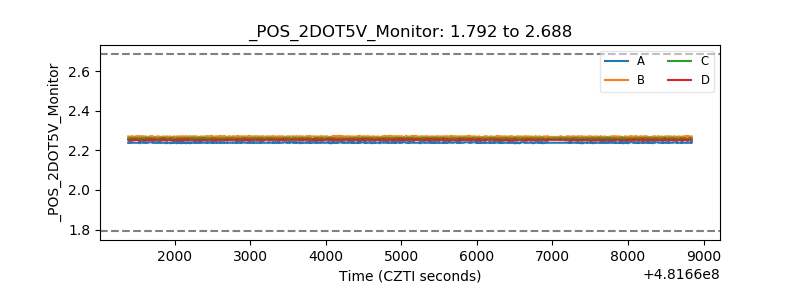 |
| +5 Volts monitor | 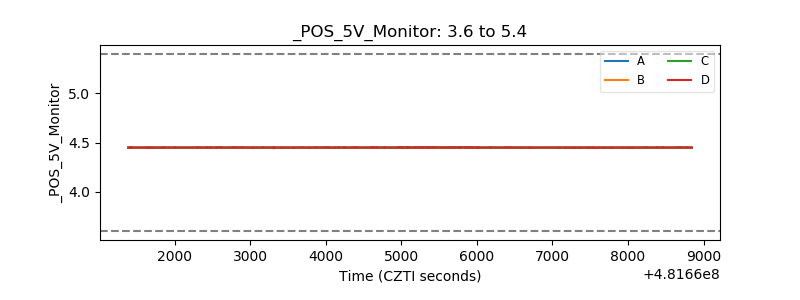 |
| _ROLL_ROT | 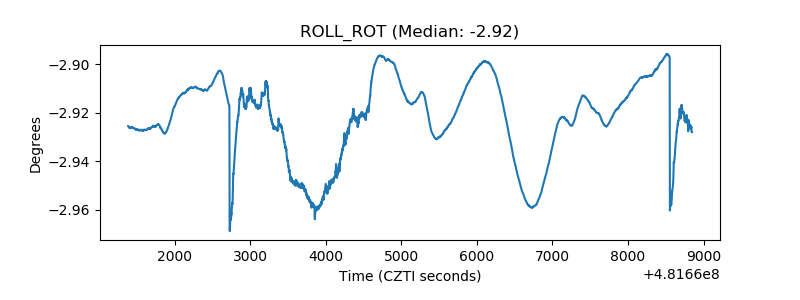 |
| _Roll_DEC | 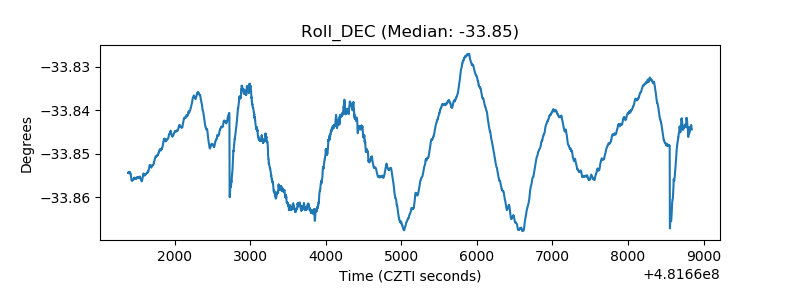 |
| _Roll_RA | 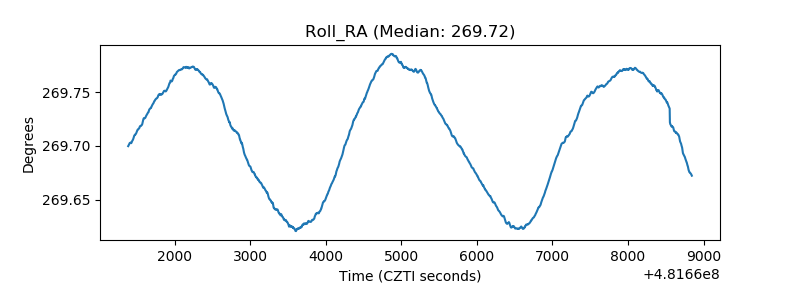 |
| Veto Counter | 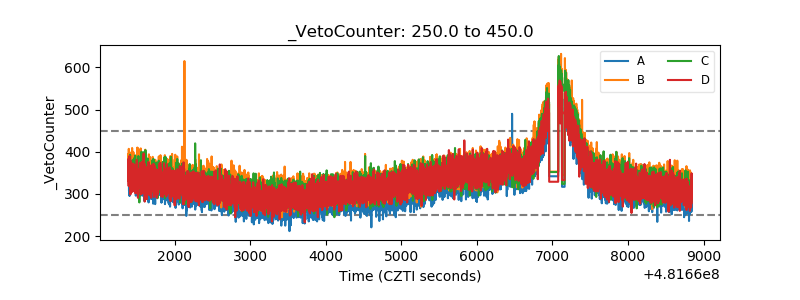 |