| Param | Original file | Final file |
|---|---|---|
| Filename | modeM0/AS1A13_090T01_9000006458_51519cztM0_level2.fits | modeM0/AS1A13_090T01_9000006458_51519cztM0_level2_quad_clean.evt |
| Size (bytes) | 34,937,280 | 4,317,120 |
| Size | 33.3 MB | 4.1 MB |
| Events in quadrant A | 310,502 | 20,412 |
| Events in quadrant B | 314,670 | 26,241 |
| Events in quadrant C | 302,519 | 22,033 |
| Events in quadrant D | 322,174 | 18,102 |
| Mode M0 | |||
|---|---|---|---|
| Quadrant | BADHDUFLAG | Total packets | Discarded packets |
| A | 0 | 13328 | 12094 |
| B | 0 | 10116 | 8818 |
| C | 0 | 10228 | 9008 |
| D | 0 | 14416 | 13154 |
| Mode M9 | |||
|---|---|---|---|
| Quadrant | BADHDUFLAG | Total packets | Discarded packets |
| A | 0 | 8 | 8 |
| B | 0 | 6 | 6 |
| C | 0 | 9 | 9 |
| D | 0 | 9 | 9 |
| Mode SS | |||
|---|---|---|---|
| Quadrant | BADHDUFLAG | Total packets | Discarded packets |
| A | 0 | 88 | 69 |
| B | 0 | 80 | 62 |
| C | 0 | 86 | 75 |
| D | 0 | 90 | 75 |
| Quadrant | Total seconds | Saturated seconds | Saturation percentage |
|---|---|---|---|
| A | 471 | 11 | 2.335456% |
| B | 570 | 2 | 0.350877% |
| C | 540 | 3 | 0.555556% |
| D | 442 | 16 | 3.619910% |
Noise dominated data is calculated using 1-second bins in cleaned event files. If a bin has >2000 counts, and if more than 50% of those come from <1% of pixels, then it is considered to be noise-dominated and hence unusable.
| Quadrant | # 1 sec bins | Bins with >0 counts | Bins with >2000 counts | High rate bins dominated by noise | Noise dominated (total time) | Noise dominated (detector-on time) | Marked lightcurve |
|---|---|---|---|---|---|---|---|
| A | 5195 | 745 | 1 | 1 | 0.02% | 0.13% | 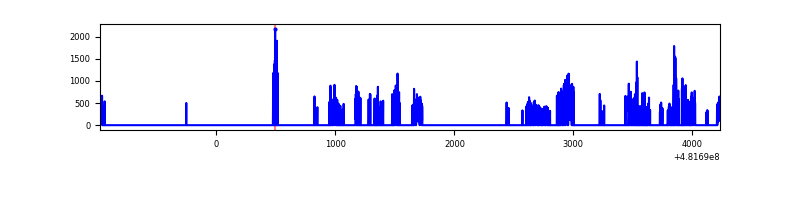 |
| B | 5211 | 863 | 1 | 1 | 0.02% | 0.12% | 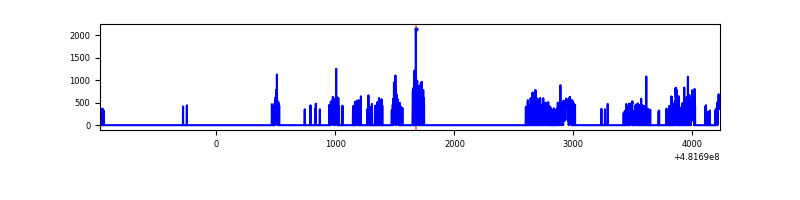 |
| C | 5212 | 836 | 2 | 2 | 0.04% | 0.24% | 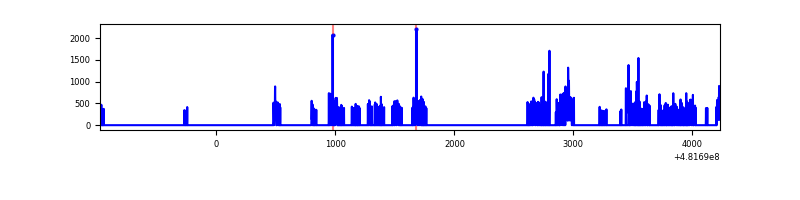 |
| D | 5206 | 690 | 8 | 8 | 0.15% | 1.16% | 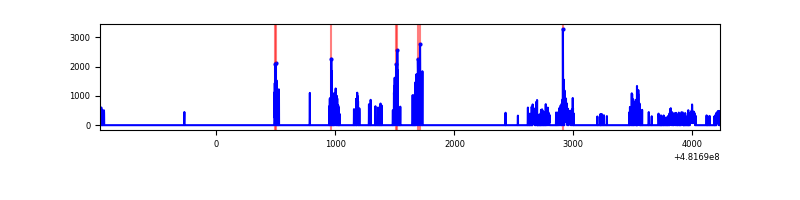 |
Top three noisy pixels from each quadrant. If the there are fewer than three noisy pixels in the level2.evt file, extra rows are filled as -1
| Pixel properties | Quadrant properties | ||||||
|---|---|---|---|---|---|---|---|
| Quadrant | DetID | PixID | Counts | Sigma | Mean | Median | Sigma |
| A | 12 | 3 | 39797 | 2777.12 | 49 | 47 | 14.3 |
| A | 12 | 250 | 31068 | 2167.27 | 49 | 47 | 14.3 |
| A | 15 | 174 | 21190 | 1477.15 | 49 | 47 | 14.3 |
| B | 5 | 185 | 20480 | 1349.68 | 60 | 59 | 15.1 |
| B | 15 | 52 | 12536 | 824.64 | 60 | 59 | 15.1 |
| B | 0 | 171 | 10183 | 669.12 | 60 | 59 | 15.1 |
| C | 3 | 233 | 41077 | 2427.2 | 55 | 54 | 16.9 |
| C | 13 | 3 | 19441 | 1147.07 | 55 | 54 | 16.9 |
| C | 15 | 205 | 5853 | 343.11 | 55 | 54 | 16.9 |
| D | 8 | 176 | 34563 | 2555.88 | 43 | 41 | 13.5 |
| D | 11 | 176 | 31218 | 2308.22 | 43 | 41 | 13.5 |
| D | 7 | 60 | 29775 | 2201.39 | 43 | 41 | 13.5 |
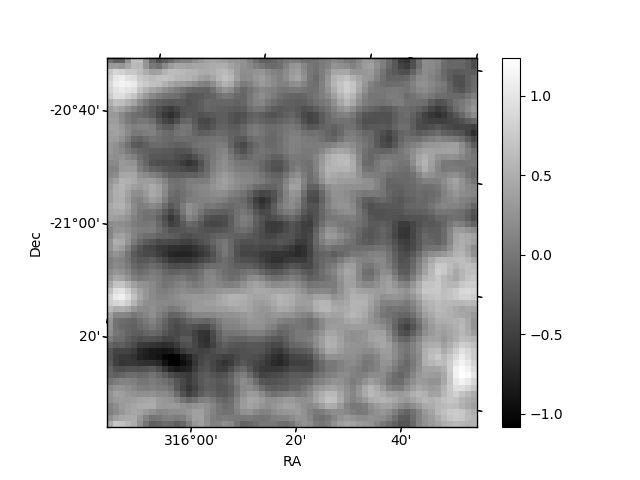
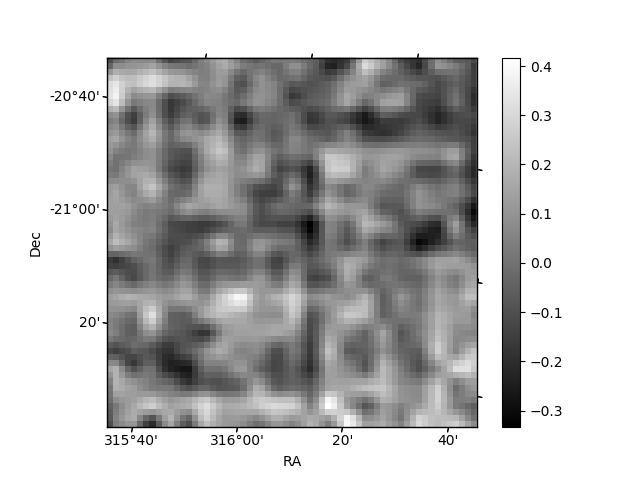
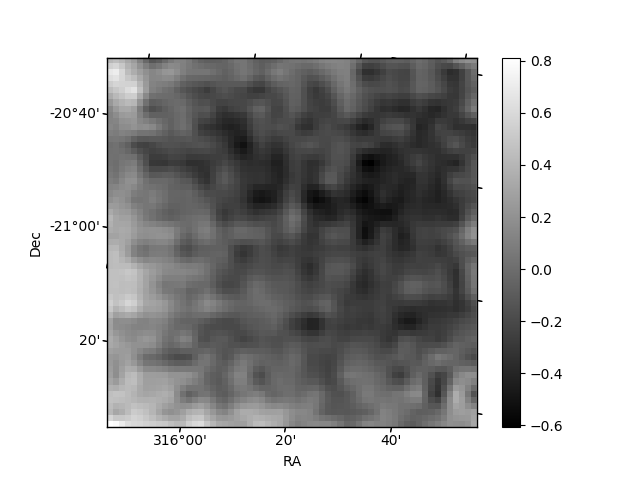
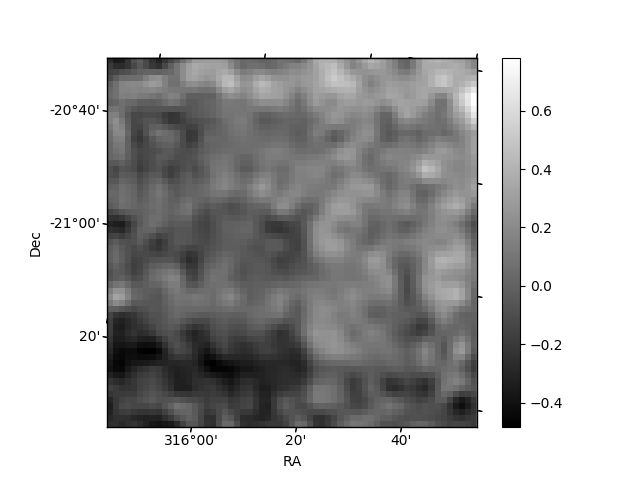
Histogram calculated using DETX and DETY for each event in the final _common_clean file
| Quadrant A | 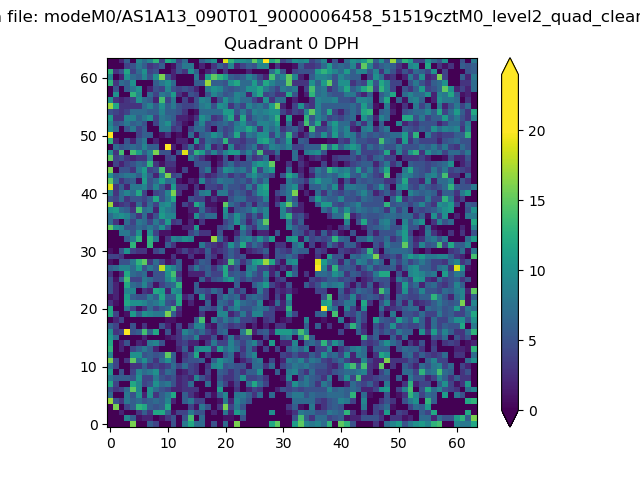 |
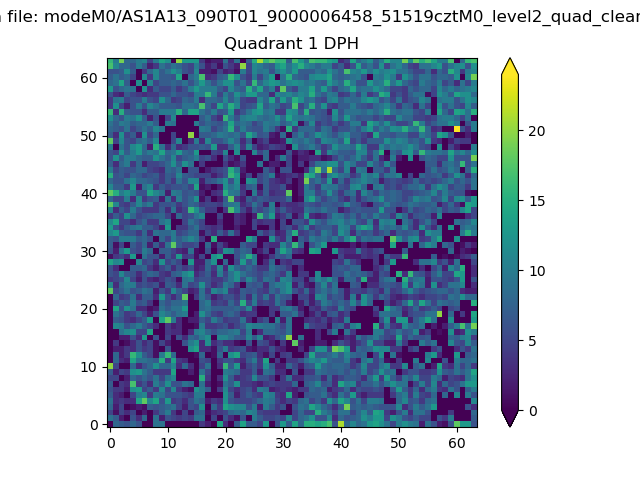 |
Quadrant B |
|---|---|---|---|
| Quadrant D |  |
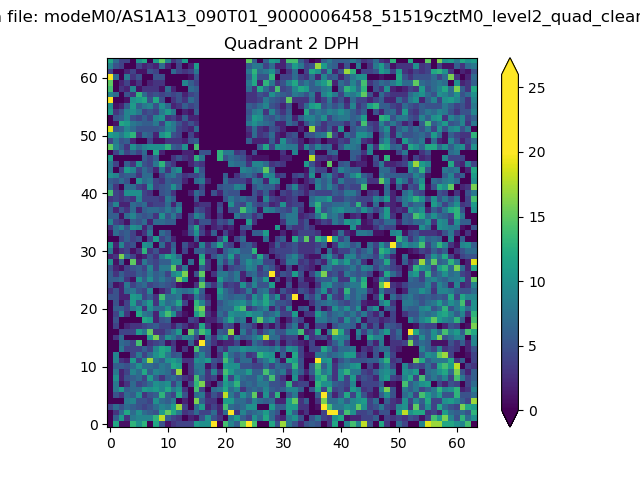 |
Quadrant C |
| Plot type | Count rate plots | Images |
|---|---|---|
| Comparison with Poisson distribution Blue bars denote a histogram of data divided into 1 sec bins. Red curve is a Poisson curve with rate = median count rate of data. |
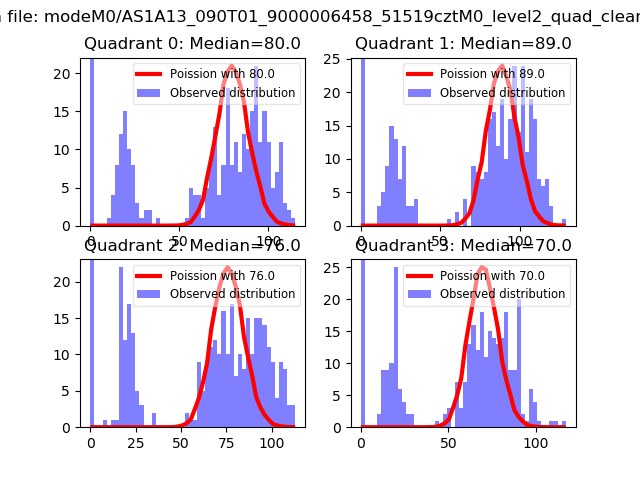 |
 |
| Quadrant-wise count rates Data is divided into 100 sec bins |
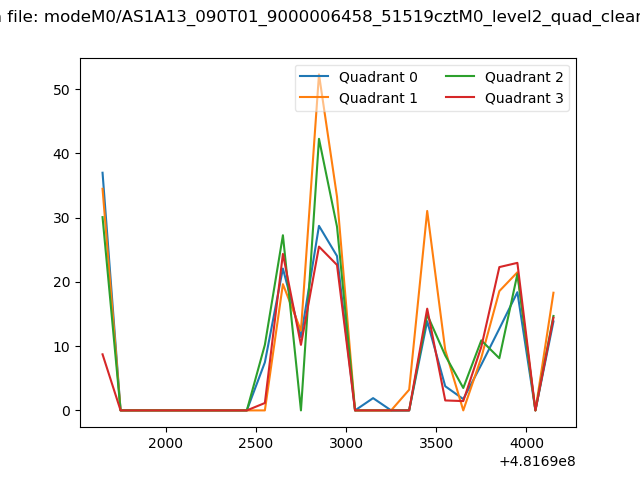 |
|
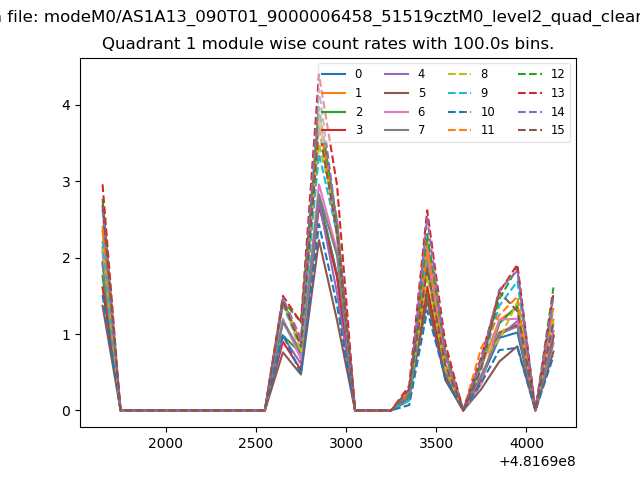
| Module-wise count rates for Quadrant A Data is divided into 100 sec bins |
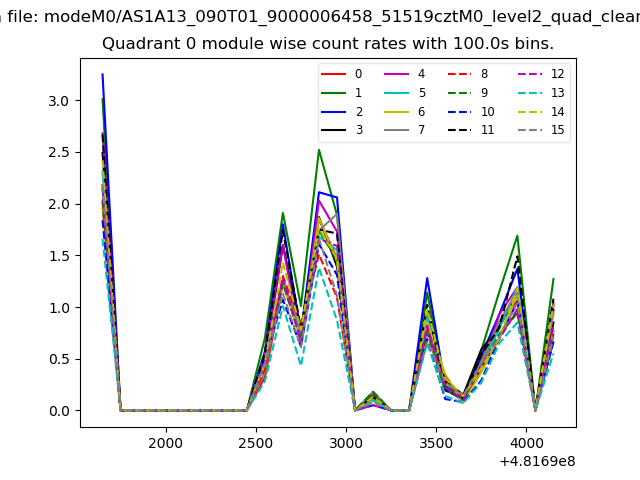 |
 |
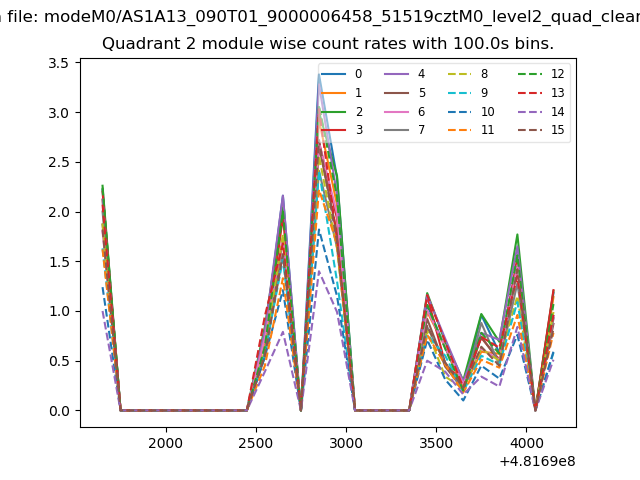
| Module-wise count rates for Quadrant B Data is divided into 100 sec bins |
 |
 |
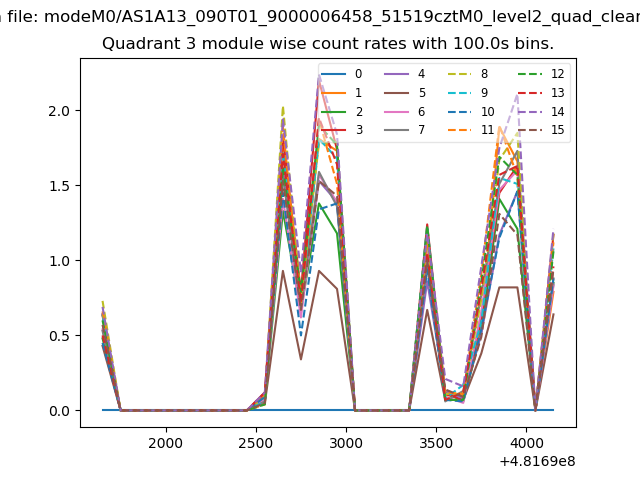
| Module-wise count rates for Quadrant C Data is divided into 100 sec bins |
 |
 |
| Module-wise count rates for Quadrant D Data is divided into 100 sec bins |
 |
 |
| Parameter | Plot |
|---|---|
| CZT HV Monitor | 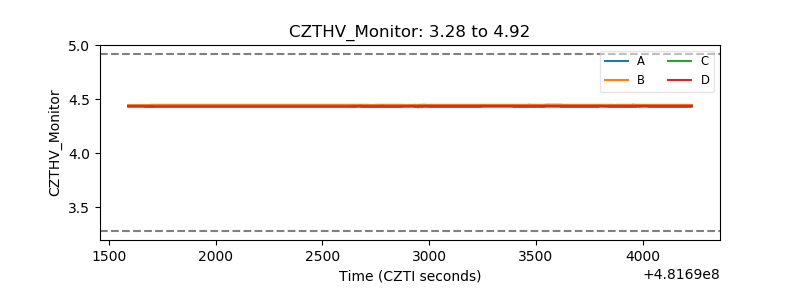 |
| D_VDD | 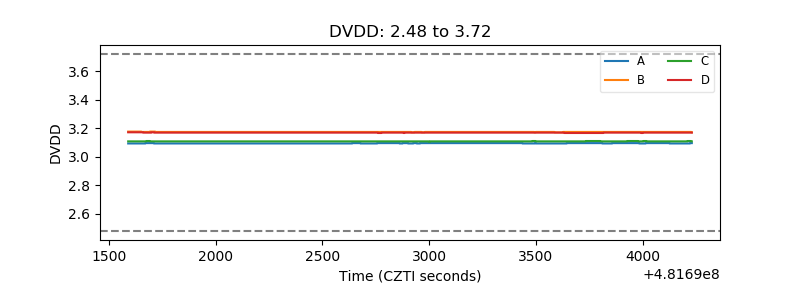 |
| Temperature 1 | 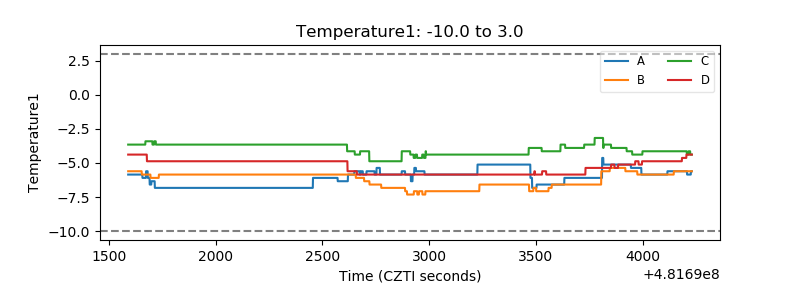 |
| Veto HV Monitor | 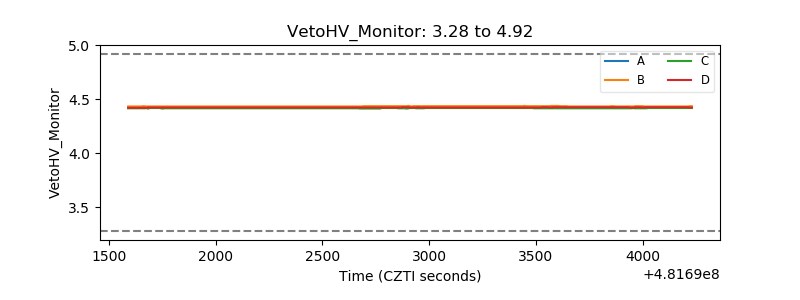 |
| Veto LLD | 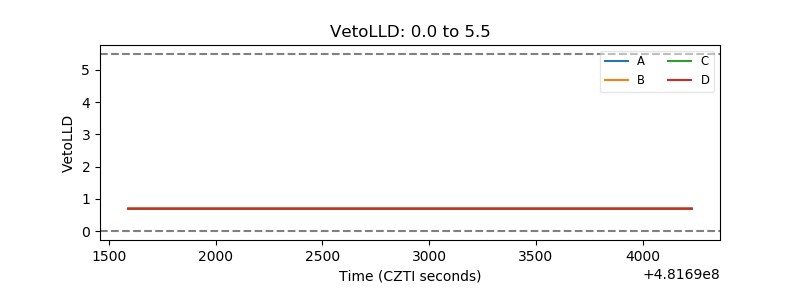 |
| Alpha Counter | 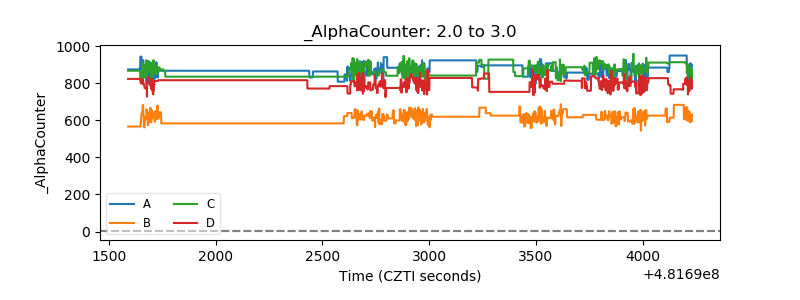 |
| _CPM_Rate | 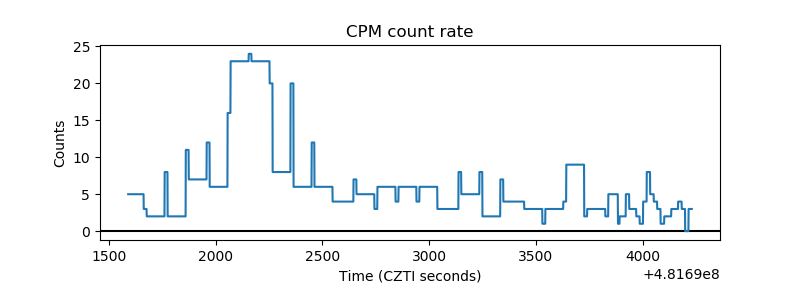 |
| CZT Counter | 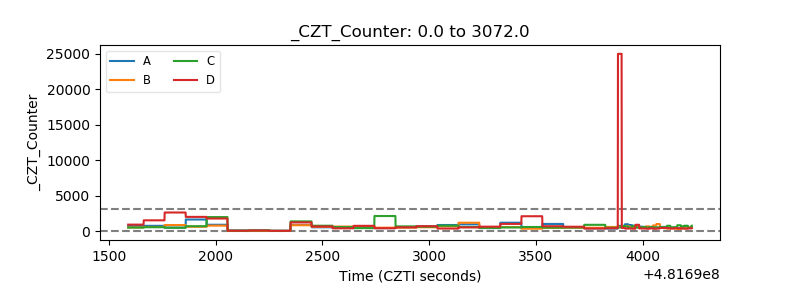 |
| +2.5 Volts monitor | 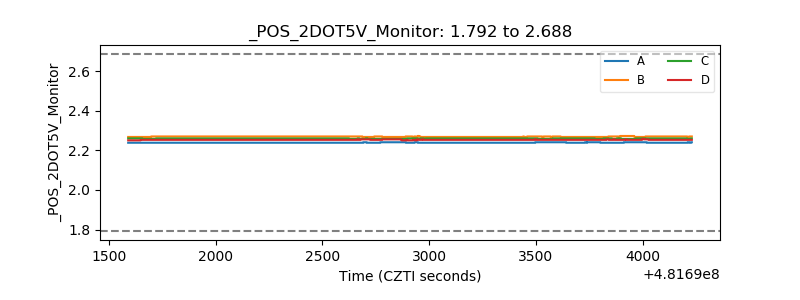 |
| +5 Volts monitor | 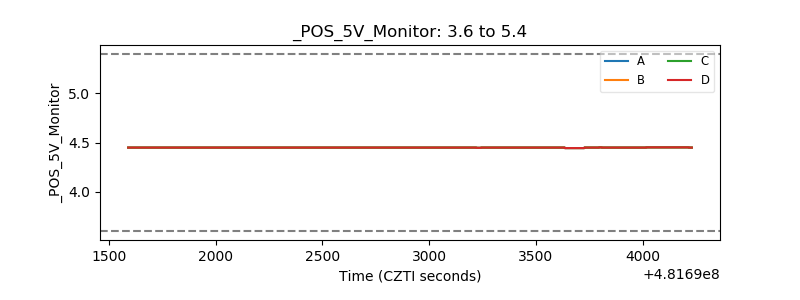 |
| _ROLL_ROT | 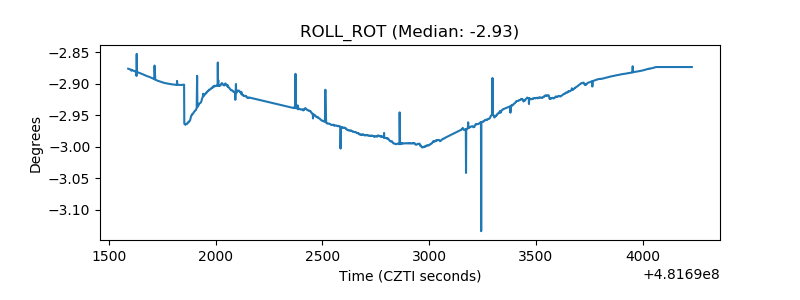 |
| _Roll_DEC | 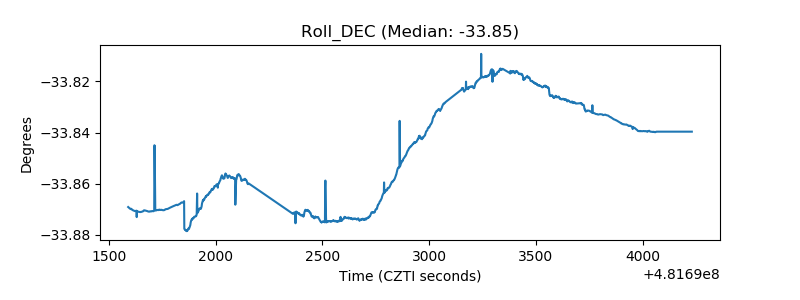 |
| _Roll_RA | 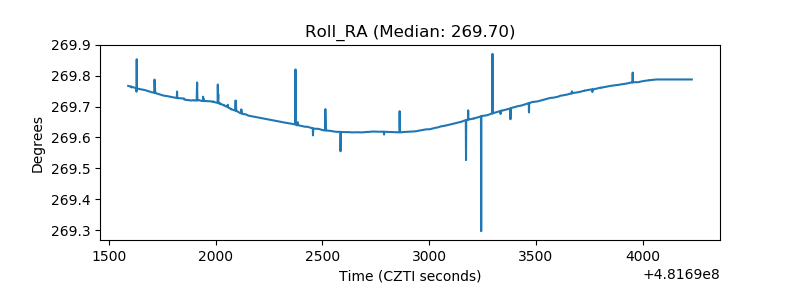 |
| Veto Counter | 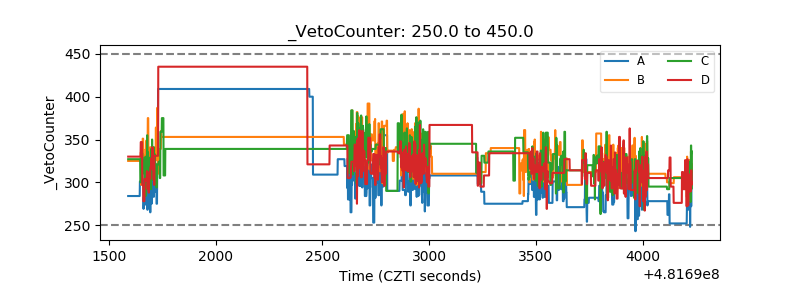 |