| Param | Original file | Final file |
|---|---|---|
| Filename | modeM0/AS1A13_090T01_9000006458_51534cztM0_level2.fits | modeM0/AS1A13_090T01_9000006458_51534cztM0_level2_quad_clean.evt |
| Size (bytes) | 752,500,800 | 72,132,480 |
| Size | 717.6 MB | 68.8 MB |
| Events in quadrant A | 7,658,241 | 406,399 |
| Events in quadrant B | 3,918,380 | 543,266 |
| Events in quadrant C | 9,378,615 | 372,212 |
| Events in quadrant D | 6,405,344 | 405,732 |
| Mode M0 | |||
|---|---|---|---|
| Quadrant | BADHDUFLAG | Total packets | Discarded packets |
| A | 0 | 41532 | 14380 |
| B | 0 | 22553 | 6129 |
| C | 0 | 48274 | 16123 |
| D | 0 | 35638 | 11935 |
| Mode M9 | |||
|---|---|---|---|
| Quadrant | BADHDUFLAG | Total packets | Discarded packets |
| A | 0 | 2 | 1 |
| B | 0 | 2 | 1 |
| C | 0 | 1 | 0 |
| D | 0 | 1 | 0 |
| Mode SS | |||
|---|---|---|---|
| Quadrant | BADHDUFLAG | Total packets | Discarded packets |
| A | 0 | 140598351751208 | 140595754434606 |
| B | 0 | -1 | -1 |
| C | 0 | -1 | -1 |
| D | 0 | -1 | -1 |
| Quadrant | Total seconds | Saturated seconds | Saturation percentage |
|---|---|---|---|
| A | 6217 | 1003 | 16.133183% |
| B | 6760 | 283 | 4.186391% |
| C | 6124 | 1263 | 20.623775% |
| D | 6466 | 847 | 13.099289% |
Noise dominated data is calculated using 1-second bins in cleaned event files. If a bin has >2000 counts, and if more than 50% of those come from <1% of pixels, then it is considered to be noise-dominated and hence unusable.
| Quadrant | # 1 sec bins | Bins with >0 counts | Bins with >2000 counts | High rate bins dominated by noise | Noise dominated (total time) | Noise dominated (detector-on time) | Marked lightcurve |
|---|---|---|---|---|---|---|---|
| A | 9419 | 6899 | 541 | 541 | 5.74% | 7.84% | 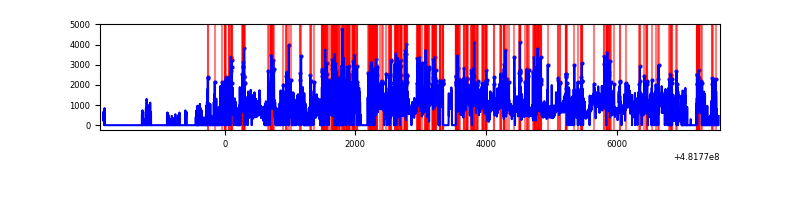 |
| B | 9491 | 7394 | 85 | 85 | 0.90% | 1.15% | 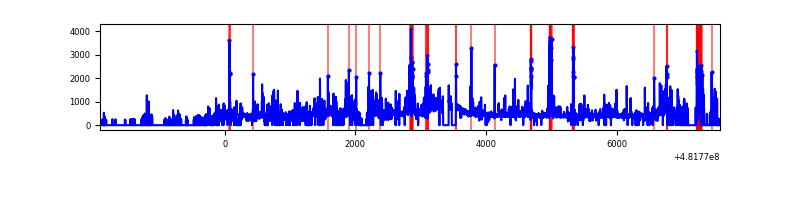 |
| C | 9416 | 6863 | 994 | 994 | 10.56% | 14.48% | 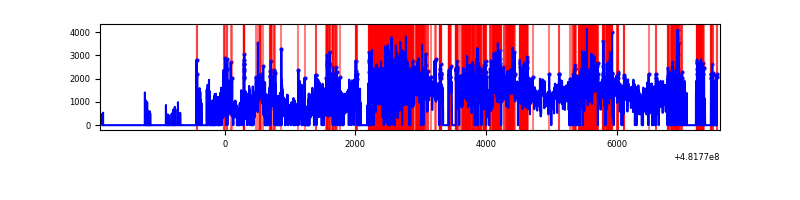 |
| D | 9416 | 7140 | 589 | 589 | 6.26% | 8.25% | 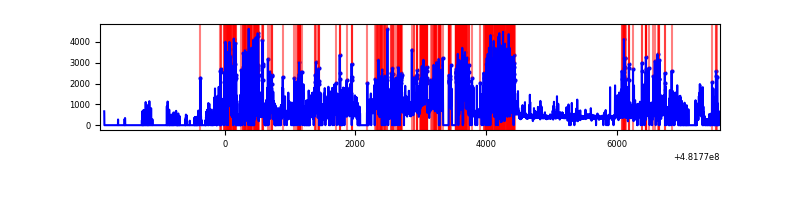 |
Top three noisy pixels from each quadrant. If the there are fewer than three noisy pixels in the level2.evt file, extra rows are filled as -1
| Pixel properties | Quadrant properties | ||||||
|---|---|---|---|---|---|---|---|
| Quadrant | DetID | PixID | Counts | Sigma | Mean | Median | Sigma |
| A | 12 | 3 | 1939906 | 12338.92 | 632 | 616 | 157.2 |
| A | 7 | 64 | 1195477 | 7602.42 | 632 | 616 | 157.2 |
| A | 12 | 250 | 603598 | 3836.53 | 632 | 616 | 157.2 |
| B | 10 | 247 | 304404 | 1962.68 | 718 | 691 | 154.7 |
| B | 1 | 207 | 229964 | 1481.62 | 718 | 691 | 154.7 |
| B | 5 | 172 | 111090 | 713.43 | 718 | 691 | 154.7 |
| C | 3 | 233 | 4300522 | 25317.41 | 611 | 604 | 169.8 |
| C | 3 | 242 | 1950588 | 11481.28 | 611 | 604 | 169.8 |
| C | 13 | 3 | 194345 | 1140.72 | 611 | 604 | 169.8 |
| D | 8 | 176 | 2938814 | 16419.03 | 644 | 623 | 179.0 |
| D | 7 | 60 | 234991 | 1309.68 | 644 | 623 | 179.0 |
| D | 2 | 249 | 137608 | 765.49 | 644 | 623 | 179.0 |
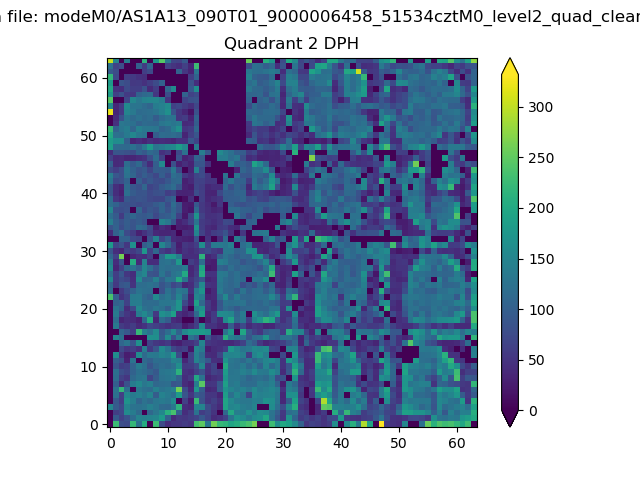
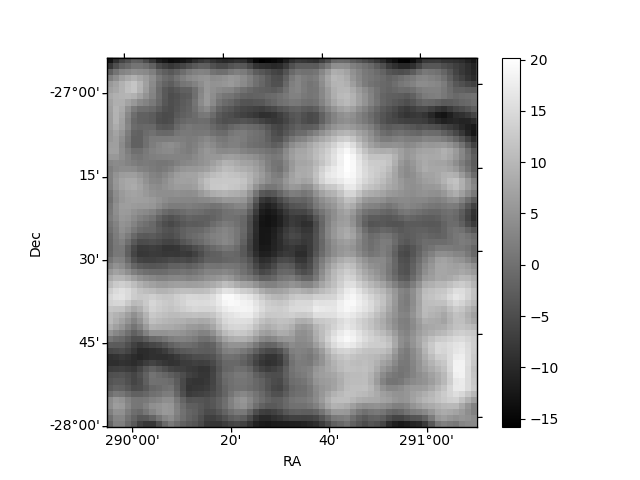
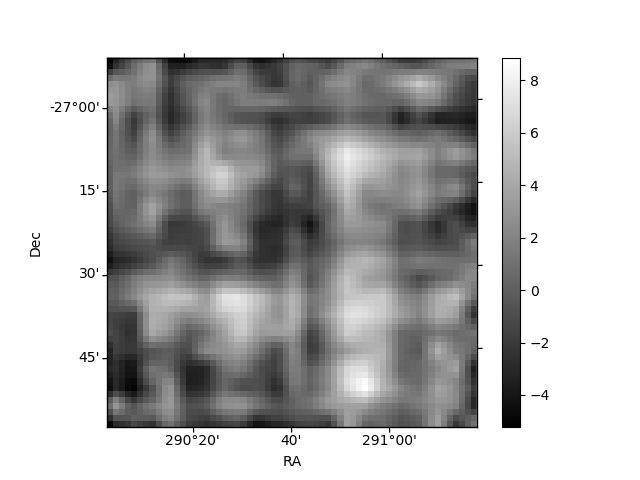
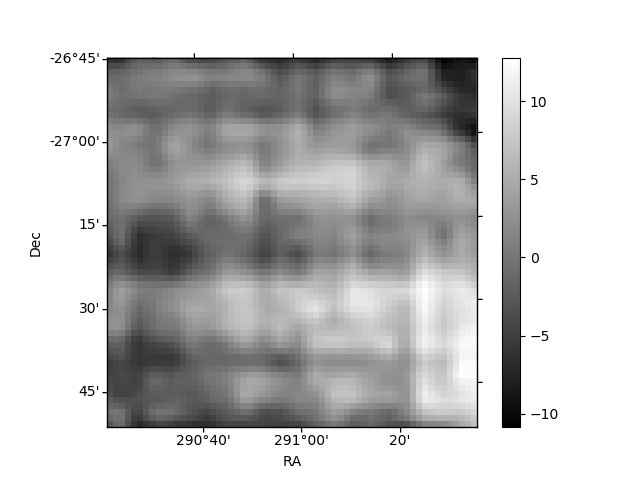
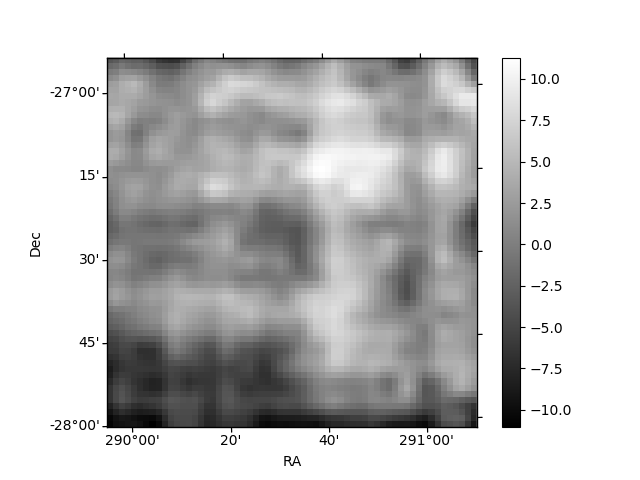
Histogram calculated using DETX and DETY for each event in the final _common_clean file
| Quadrant A | 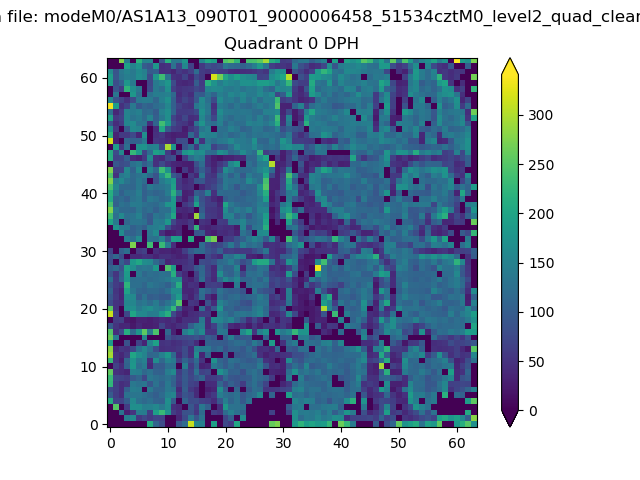 |
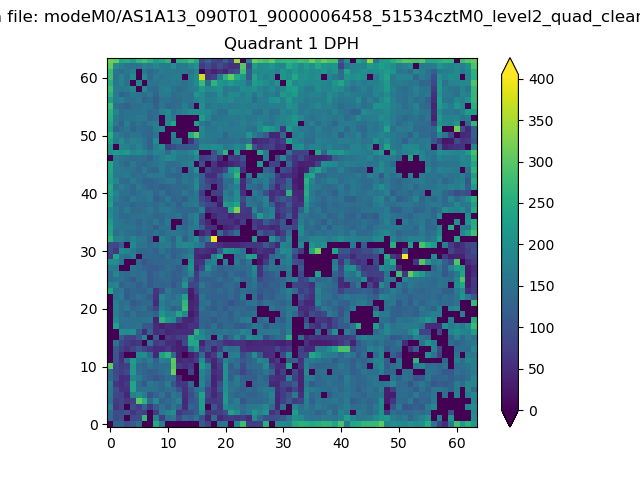 |
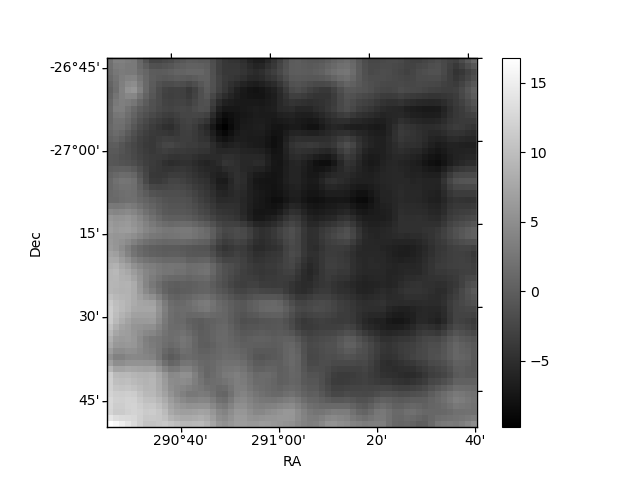
Quadrant B |
|---|---|---|---|
| Quadrant D | 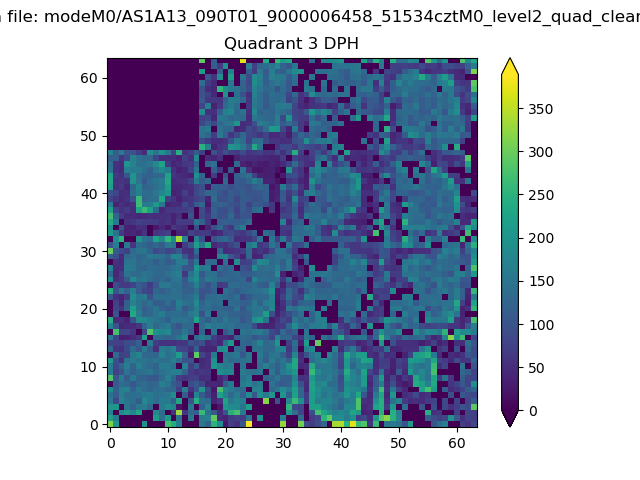 |
 |
Quadrant C |
| Plot type | Count rate plots | Images |
|---|---|---|
| Comparison with Poisson distribution Blue bars denote a histogram of data divided into 1 sec bins. Red curve is a Poisson curve with rate = median count rate of data. |
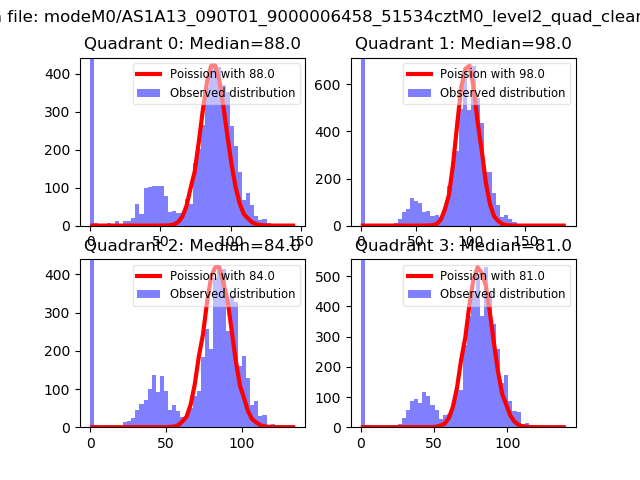 |
 |
| Quadrant-wise count rates Data is divided into 100 sec bins |
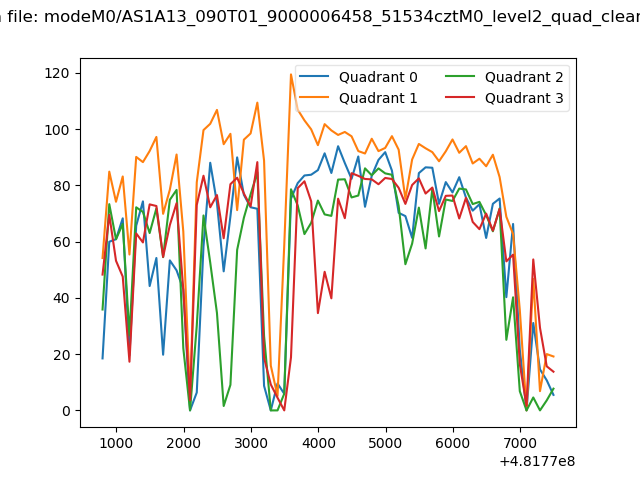 |
|
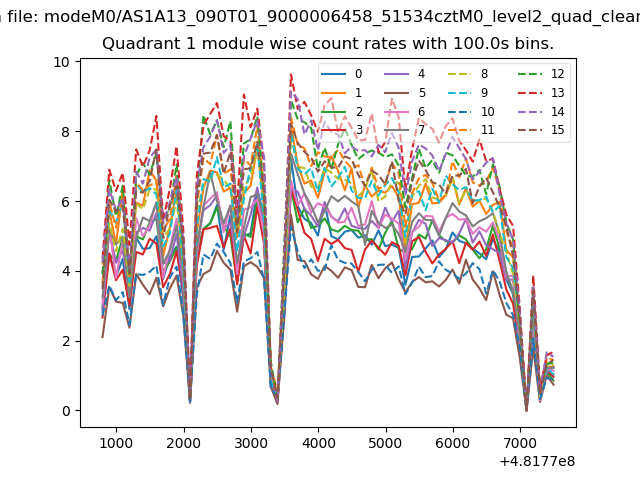
| Module-wise count rates for Quadrant A Data is divided into 100 sec bins |
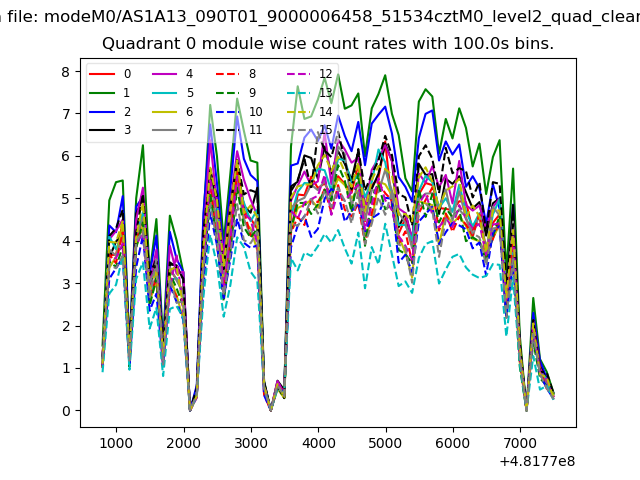 |
 |
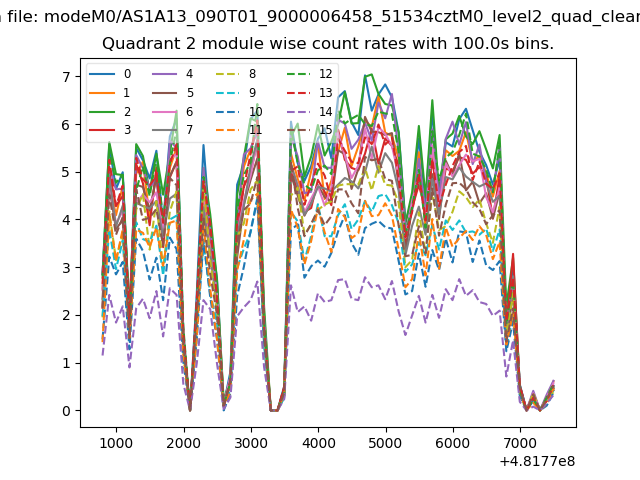
| Module-wise count rates for Quadrant B Data is divided into 100 sec bins |
 |
 |
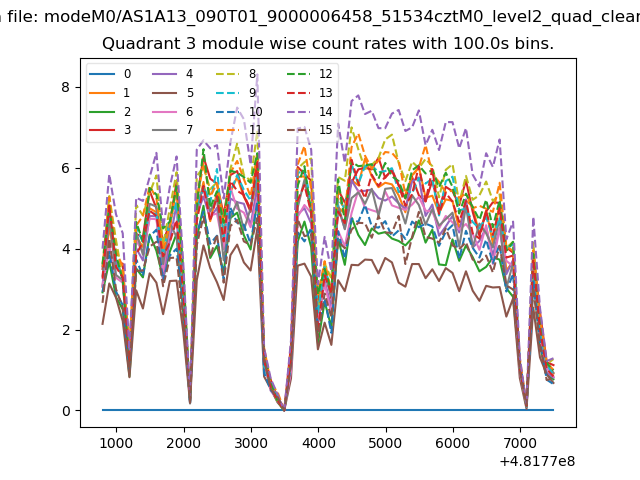
| Module-wise count rates for Quadrant C Data is divided into 100 sec bins |
 |
 |
| Module-wise count rates for Quadrant D Data is divided into 100 sec bins |
 |
 |
| Parameter | Plot |
|---|---|
| CZT HV Monitor | 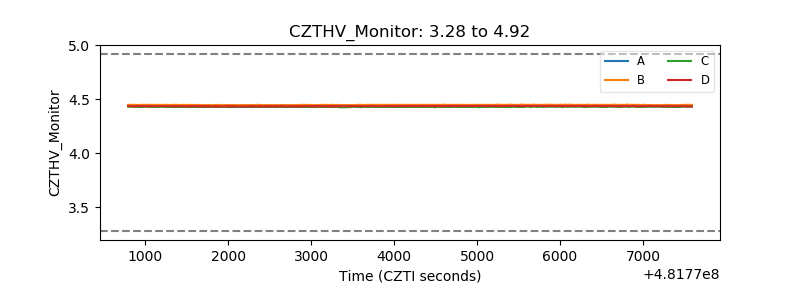 |
| D_VDD | 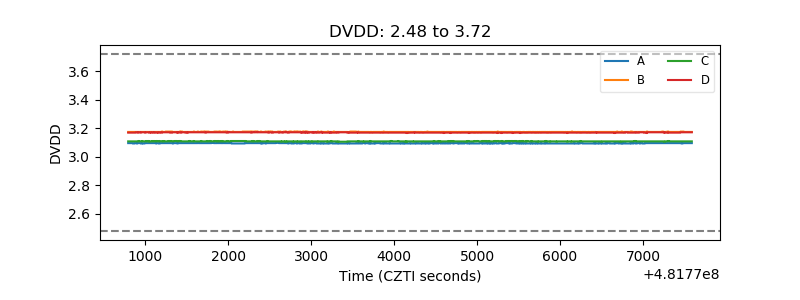 |
| Temperature 1 | 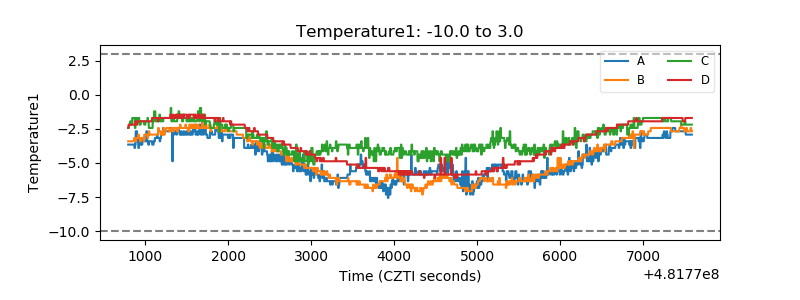 |
| Veto HV Monitor | 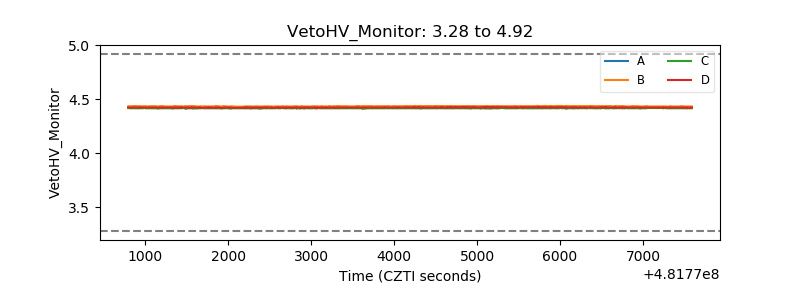 |
| Veto LLD | 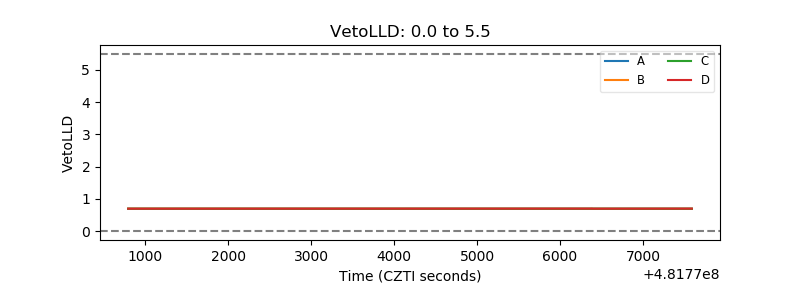 |
| Alpha Counter | 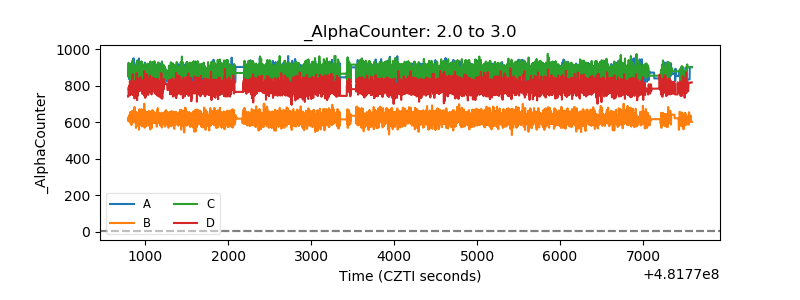 |
| _CPM_Rate | 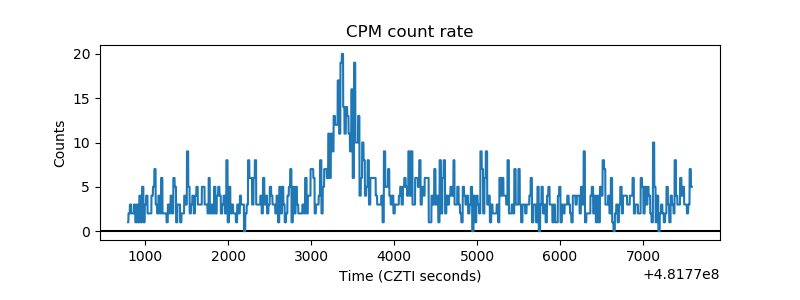 |
| CZT Counter | 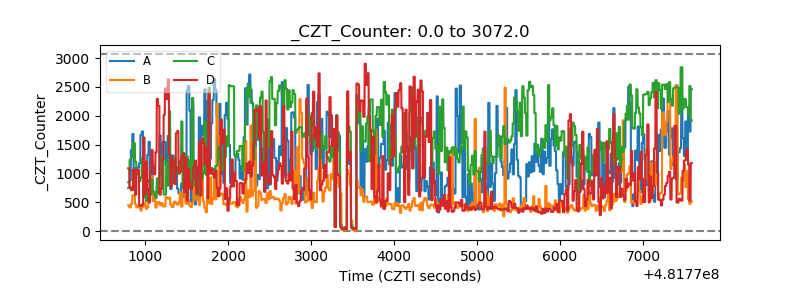 |
| +2.5 Volts monitor |  |
| +5 Volts monitor | 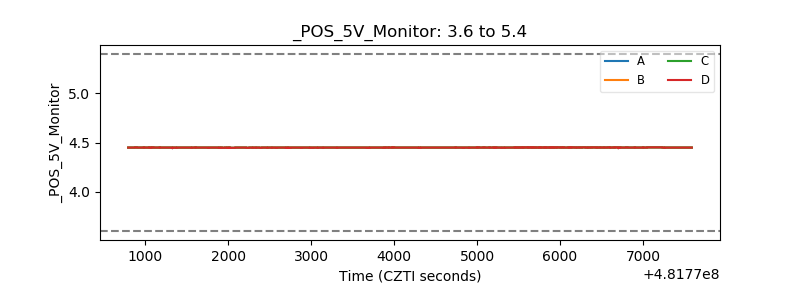 |
| _ROLL_ROT | 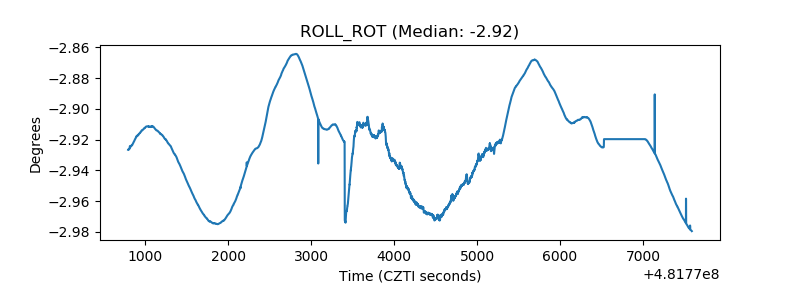 |
| _Roll_DEC | 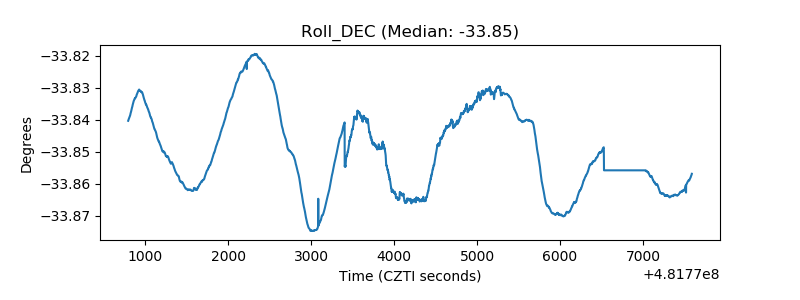 |
| _Roll_RA | 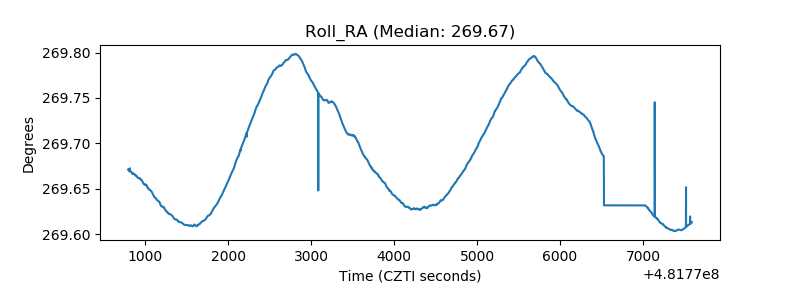 |
| Veto Counter | 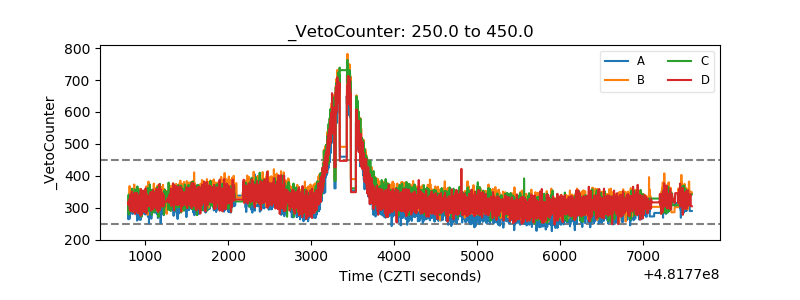 |