| Param | Original file | Final file |
|---|---|---|
| Filename | modeM0/AS1A13_090T01_9000006458_51536cztM0_level2.fits | modeM0/AS1A13_090T01_9000006458_51536cztM0_level2_quad_clean.evt |
| Size (bytes) | 2,574,158,400 | 246,528,000 |
| Size | 2.4 GB | 235.1 MB |
| Events in quadrant A | 27,084,441 | 1,503,774 |
| Events in quadrant B | 12,235,159 | 1,986,022 |
| Events in quadrant C | 18,889,442 | 1,658,458 |
| Events in quadrant D | 35,520,607 | 918,539 |
| Mode M0 | |||
|---|---|---|---|
| Quadrant | BADHDUFLAG | Total packets | Discarded packets |
| A | 0 | 94750 | 4 |
| B | 0 | 49847 | 4 |
| C | 0 | 70259 | 4 |
| D | 0 | 119556 | 4 |
| Mode M9 | |||
|---|---|---|---|
| Quadrant | BADHDUFLAG | Total packets | Discarded packets |
| A | 0 | 30 | 0 |
| B | 0 | 30 | 0 |
| C | 0 | 30 | 0 |
| D | 0 | 30 | 0 |
| Mode SS | |||
|---|---|---|---|
| Quadrant | BADHDUFLAG | Total packets | Discarded packets |
| A | 0 | 414 | 0 |
| B | 0 | 414 | 0 |
| C | 0 | 414 | 0 |
| D | 0 | 414 | 0 |
| Quadrant | Total seconds | Saturated seconds | Saturation percentage |
|---|---|---|---|
| A | 20267 | 4345 | 21.438792% |
| B | 20267 | 589 | 2.906202% |
| C | 20267 | 1714 | 8.457098% |
| D | 20267 | 9652 | 47.624217% |
Noise dominated data is calculated using 1-second bins in cleaned event files. If a bin has >2000 counts, and if more than 50% of those come from <1% of pixels, then it is considered to be noise-dominated and hence unusable.
| Quadrant | # 1 sec bins | Bins with >0 counts | Bins with >2000 counts | High rate bins dominated by noise | Noise dominated (total time) | Noise dominated (detector-on time) | Marked lightcurve |
|---|---|---|---|---|---|---|---|
| A | 23217 | 20269 | 3133 | 3133 | 13.49% | 15.46% | 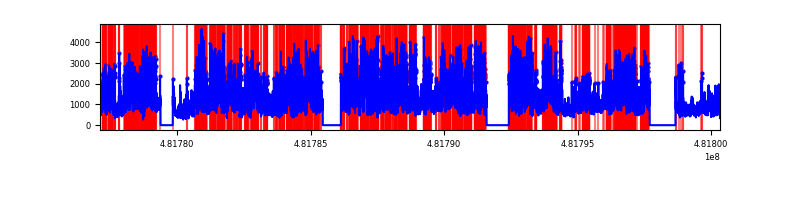 |
| B | 23217 | 20270 | 182 | 182 | 0.78% | 0.90% | 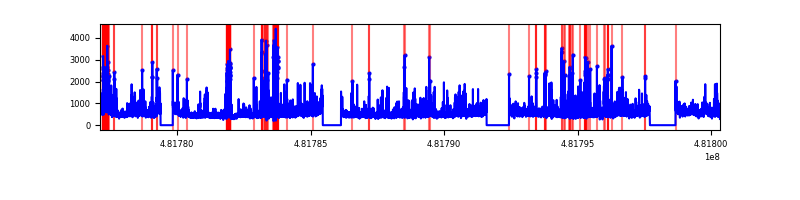 |
| C | 23217 | 20271 | 1285 | 1285 | 5.53% | 6.34% | 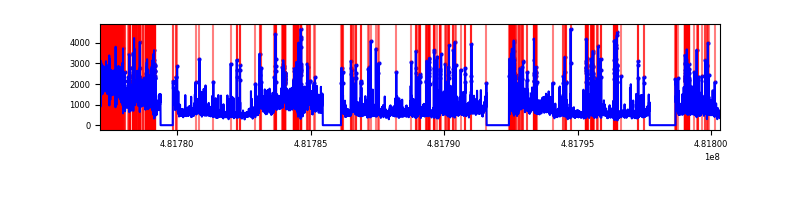 |
| D | 23217 | 20269 | 8731 | 8731 | 37.61% | 43.08% | 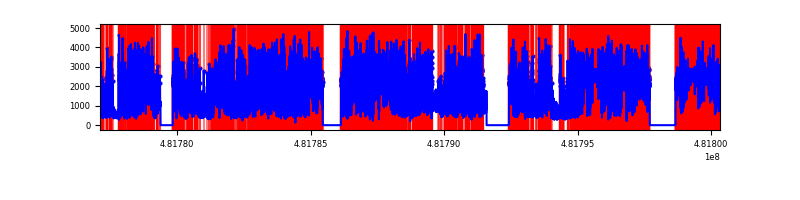 |
Top three noisy pixels from each quadrant. If the there are fewer than three noisy pixels in the level2.evt file, extra rows are filled as -1
| Pixel properties | Quadrant properties | ||||||
|---|---|---|---|---|---|---|---|
| Quadrant | DetID | PixID | Counts | Sigma | Mean | Median | Sigma |
| A | 12 | 3 | 7536840 | 15092.98 | 2039 | 1988 | 499.2 |
| A | 7 | 64 | 5017414 | 10046.35 | 2039 | 1988 | 499.2 |
| A | 12 | 250 | 2988954 | 5983.16 | 2039 | 1988 | 499.2 |
| B | 15 | 52 | 665620 | 1436.09 | 2178 | 2099 | 462.0 |
| B | 0 | 171 | 452690 | 975.23 | 2178 | 2099 | 462.0 |
| B | 10 | 247 | 451507 | 972.67 | 2178 | 2099 | 462.0 |
| C | 3 | 233 | 7255540 | 12384.6 | 2115 | 2093 | 585.7 |
| C | 13 | 3 | 882075 | 1502.49 | 2115 | 2093 | 585.7 |
| C | 3 | 242 | 580652 | 987.84 | 2115 | 2093 | 585.7 |
| D | 8 | 176 | 26926569 | 59390.57 | 1621 | 1562 | 453.4 |
| D | 6 | 42 | 482781 | 1061.46 | 1621 | 1562 | 453.4 |
| D | 2 | 249 | 313715 | 688.54 | 1621 | 1562 | 453.4 |
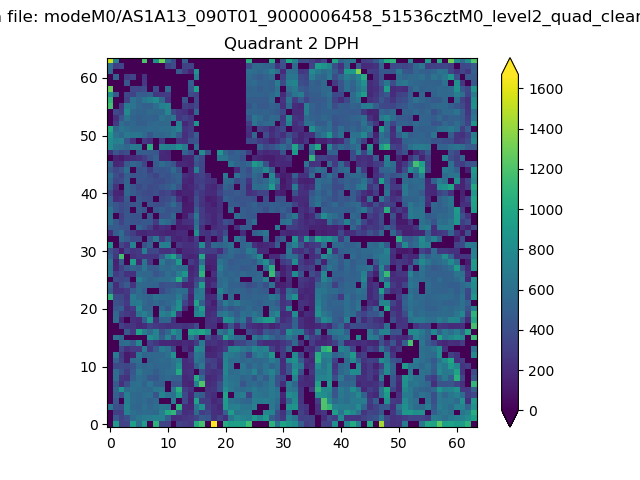
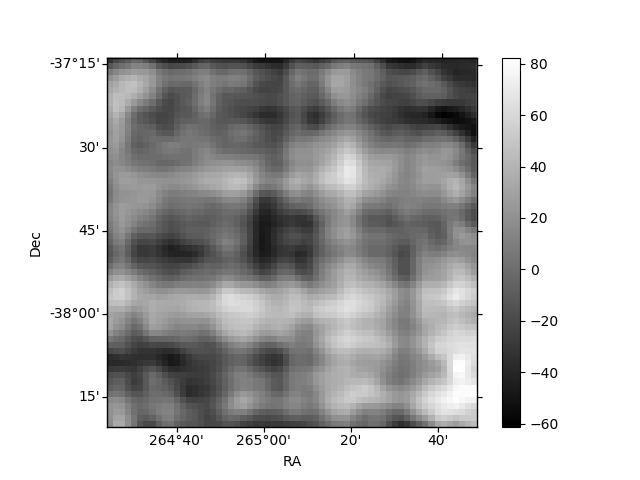
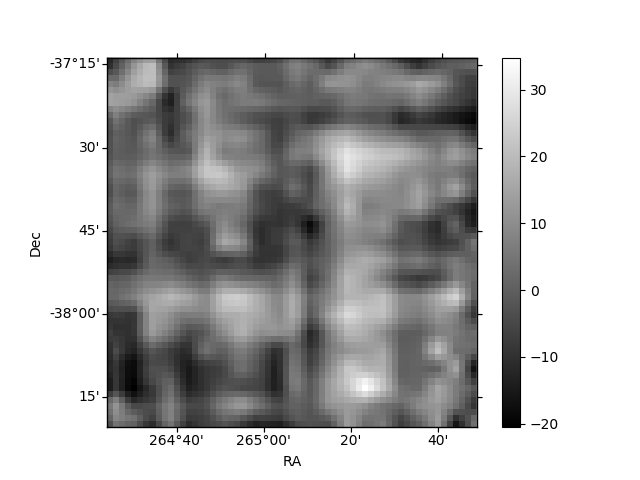
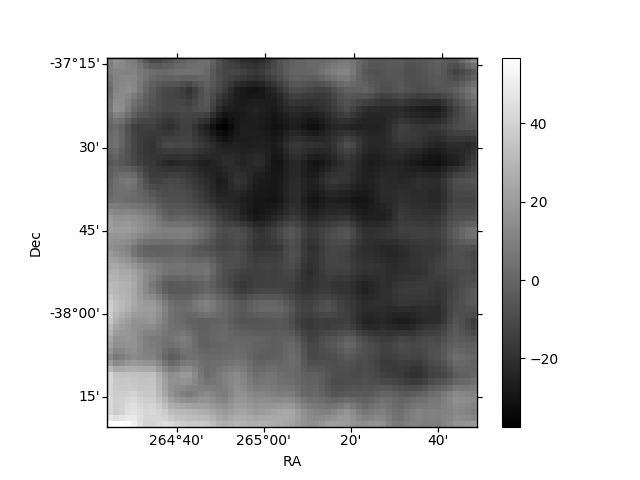
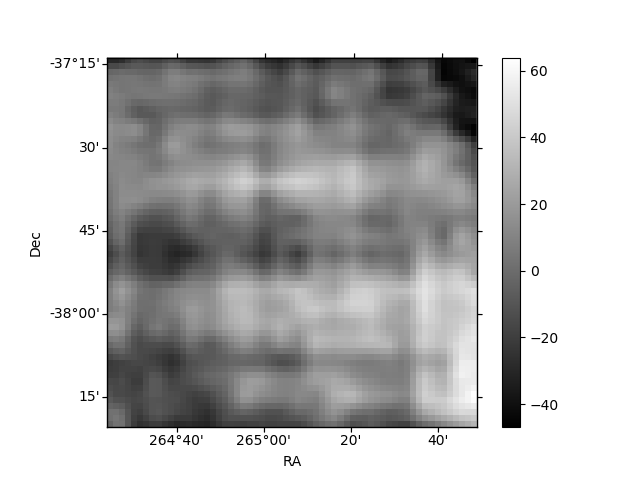
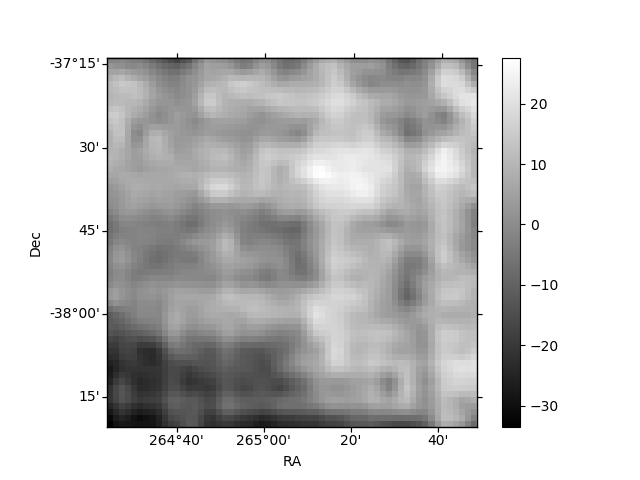
Histogram calculated using DETX and DETY for each event in the final _common_clean file
| Quadrant A | 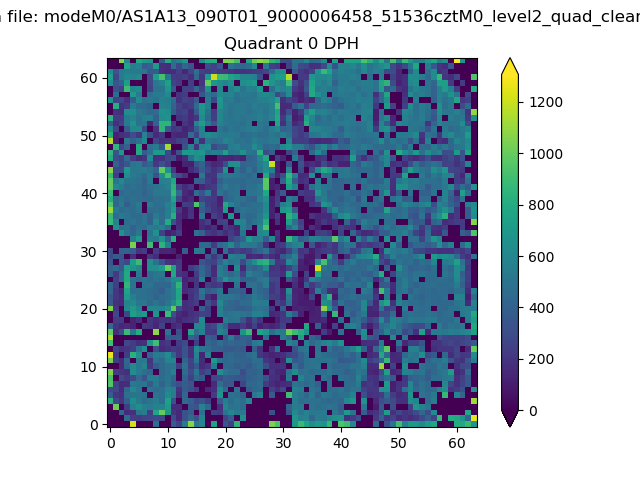 |
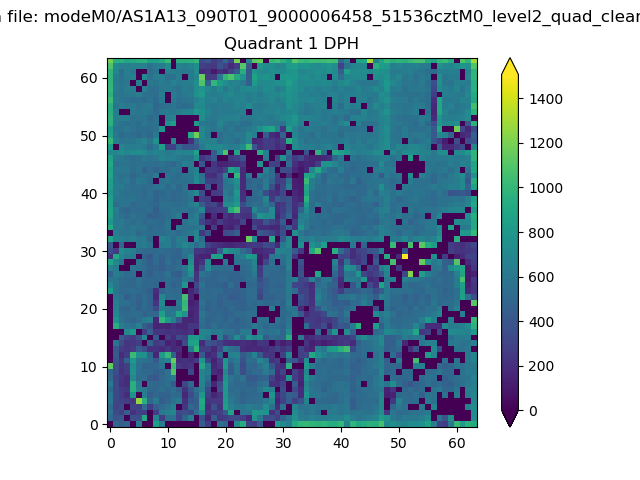 |
Quadrant B |
|---|---|---|---|
| Quadrant D | 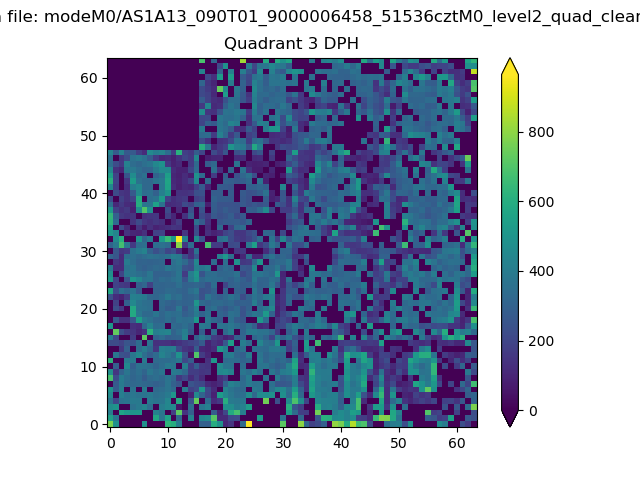 |
 |
Quadrant C |
| Plot type | Count rate plots | Images |
|---|---|---|
| Comparison with Poisson distribution Blue bars denote a histogram of data divided into 1 sec bins. Red curve is a Poisson curve with rate = median count rate of data. |
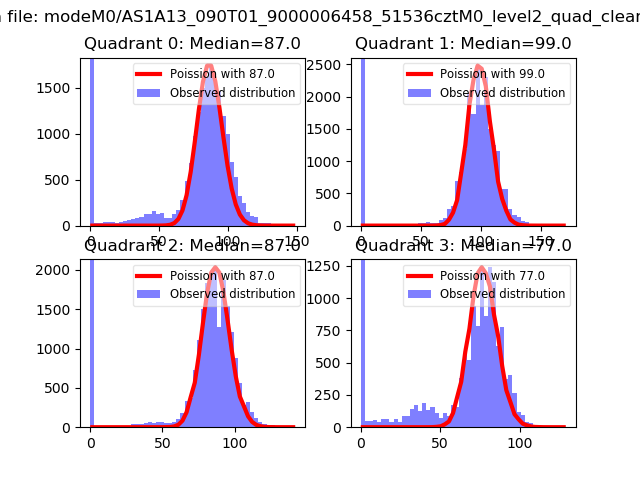 |
 |
| Quadrant-wise count rates Data is divided into 100 sec bins |
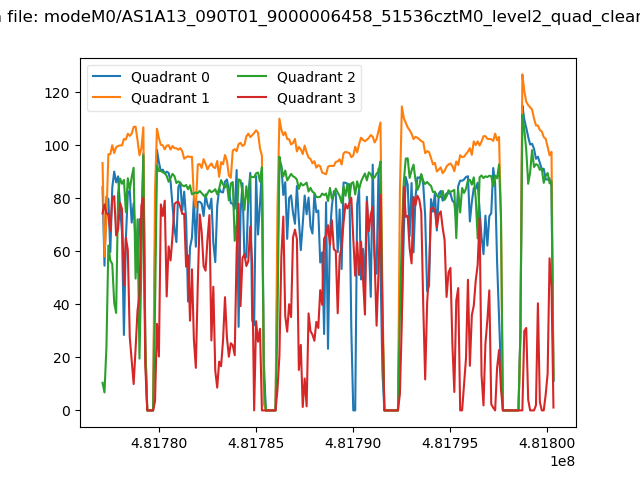 |
|
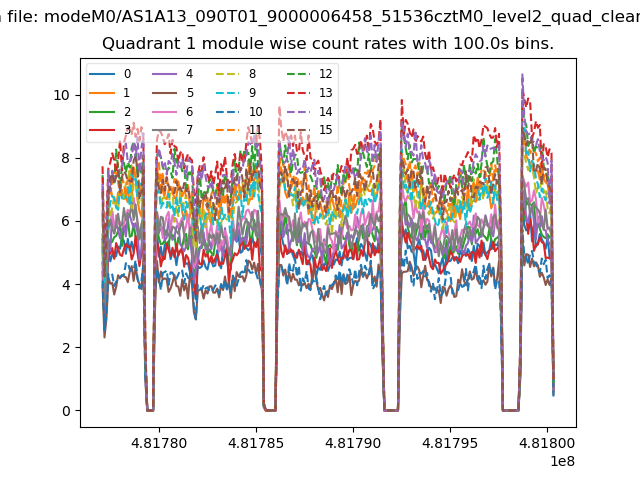
| Module-wise count rates for Quadrant A Data is divided into 100 sec bins |
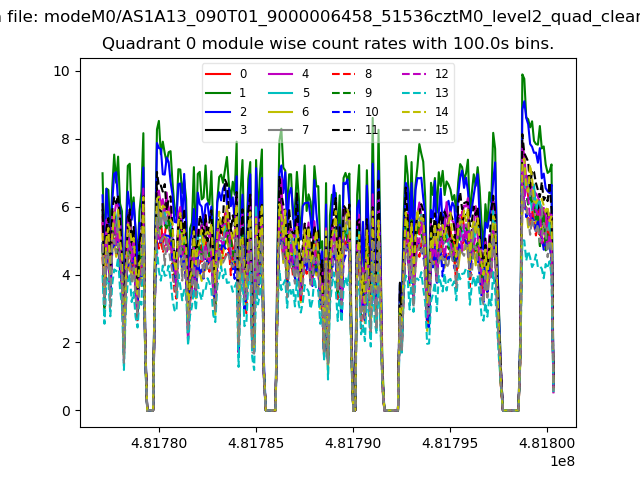 |
 |
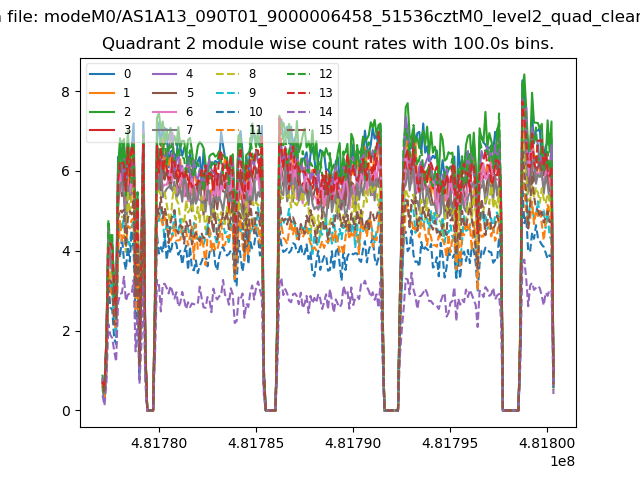
| Module-wise count rates for Quadrant B Data is divided into 100 sec bins |
 |
 |
| Module-wise count rates for Quadrant C Data is divided into 100 sec bins |
 |
 |
| Module-wise count rates for Quadrant D Data is divided into 100 sec bins |
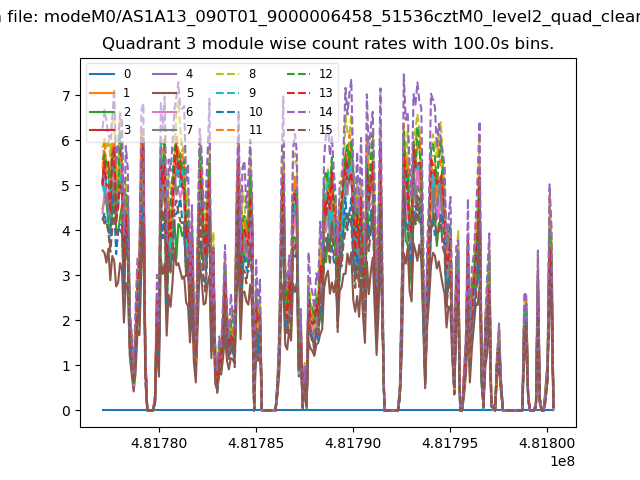 |
 |
| Parameter | Plot |
|---|---|
| CZT HV Monitor | 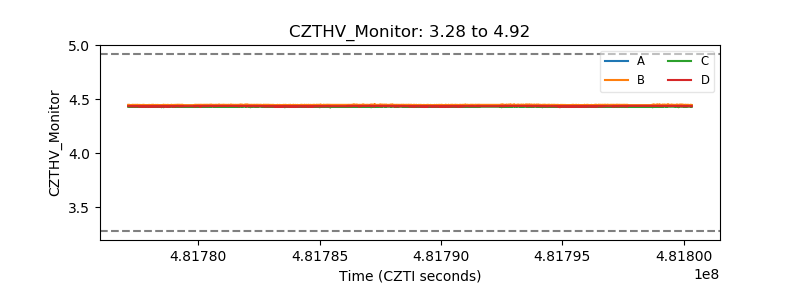 |
| D_VDD | 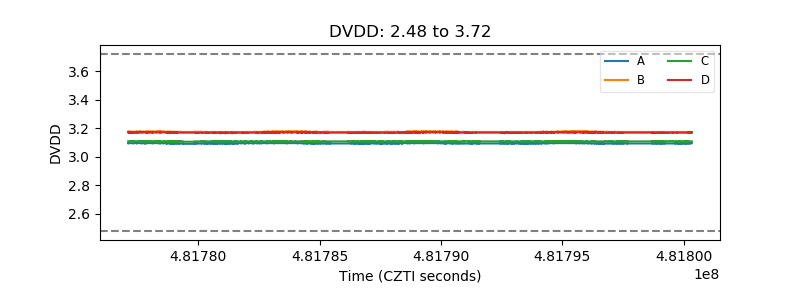 |
| Temperature 1 | 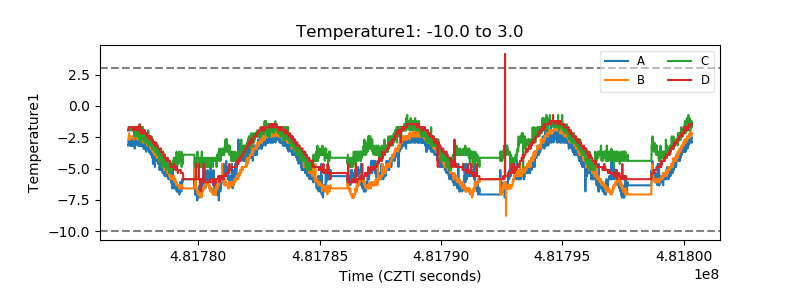 |
| Veto HV Monitor | 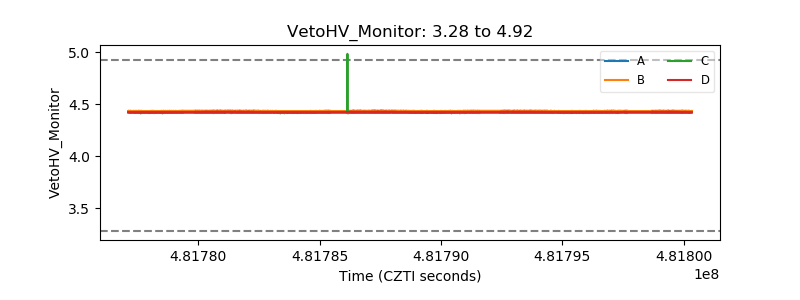 |
| Veto LLD | 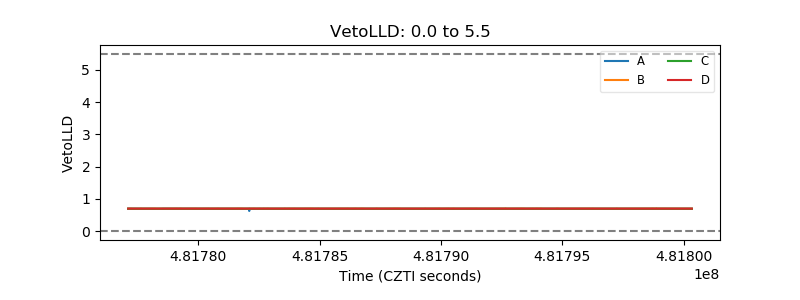 |
| Alpha Counter | 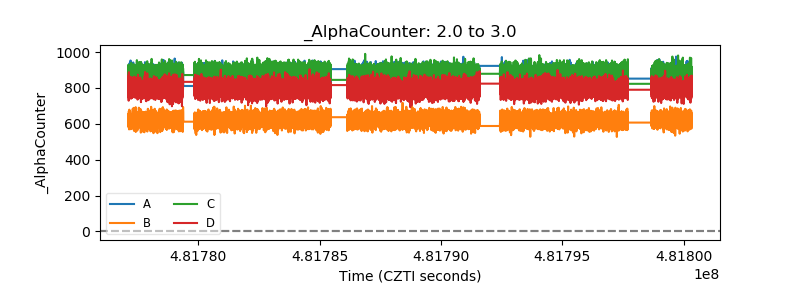 |
| _CPM_Rate | 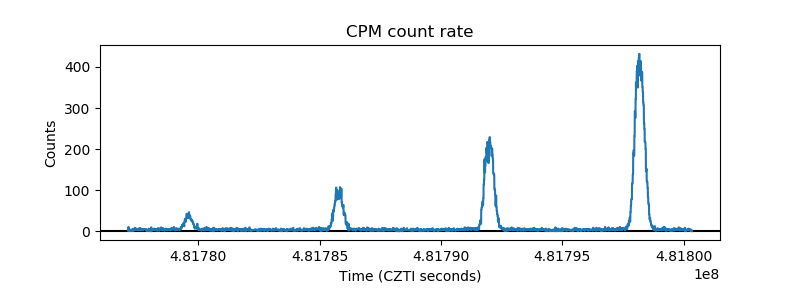 |
| CZT Counter | 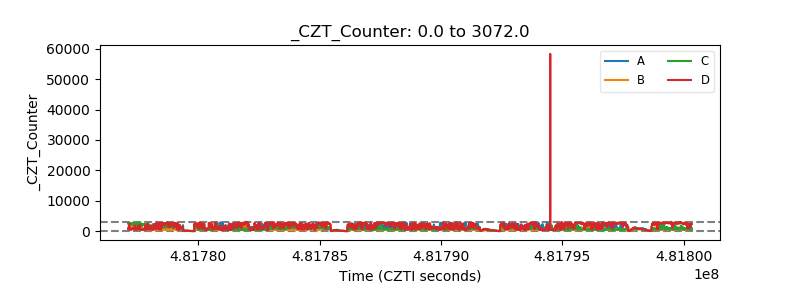 |
| +2.5 Volts monitor | 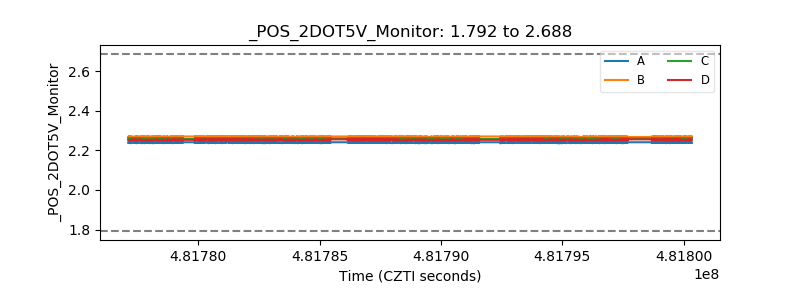 |
| +5 Volts monitor | 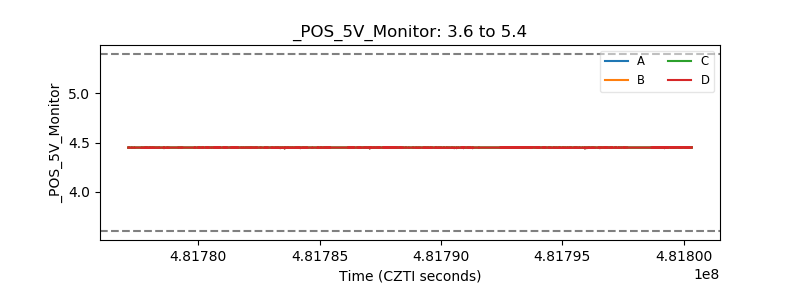 |
| _ROLL_ROT | 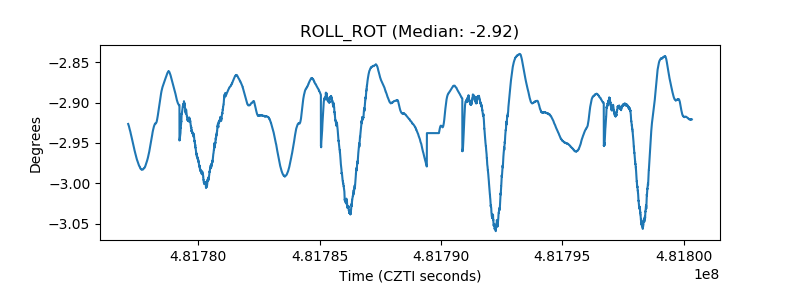 |
| _Roll_DEC | 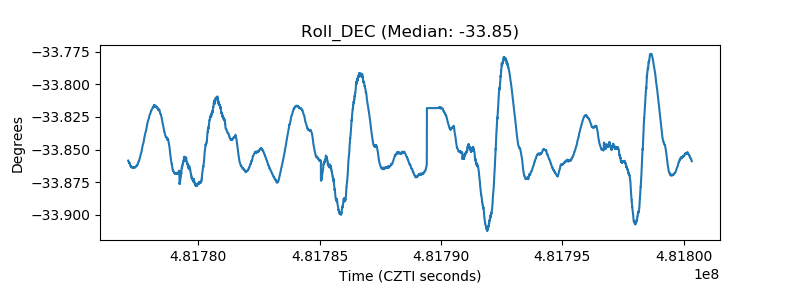 |
| _Roll_RA | 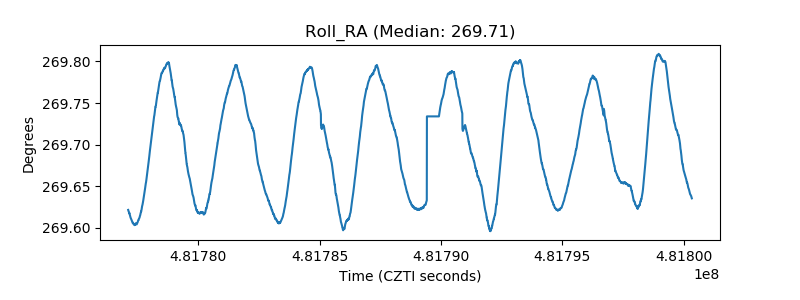 |
| Veto Counter | 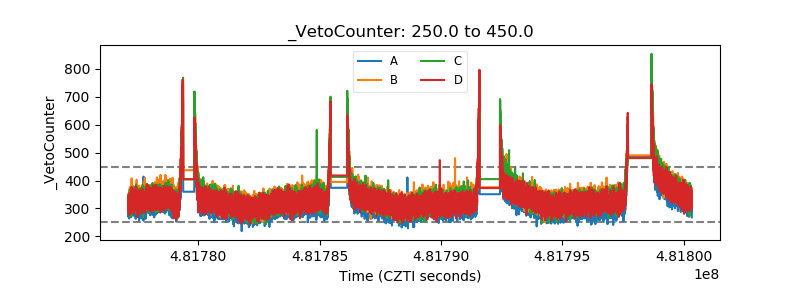 |