| Param | Original file | Final file |
|---|---|---|
| Filename | modeM0/AS1A13_090T01_9000006458_51537cztM0_level2.fits | modeM0/AS1A13_090T01_9000006458_51537cztM0_level2_quad_clean.evt |
| Size (bytes) | 859,121,280 | 77,307,840 |
| Size | 819.3 MB | 73.7 MB |
| Events in quadrant A | 7,763,722 | 543,656 |
| Events in quadrant B | 4,264,920 | 646,056 |
| Events in quadrant C | 4,952,477 | 570,052 |
| Events in quadrant D | 14,335,198 | 142,206 |
| Mode M0 | |||
|---|---|---|---|
| Quadrant | BADHDUFLAG | Total packets | Discarded packets |
| A | 0 | 27517 | 1 |
| B | 0 | 16908 | 1 |
| C | 0 | 19017 | 2 |
| D | 0 | 46953 | 1 |
| Mode M9 | |||
|---|---|---|---|
| Quadrant | BADHDUFLAG | Total packets | Discarded packets |
| A | 0 | 10 | 0 |
| B | 0 | 10 | 0 |
| C | 0 | 10 | 0 |
| D | 0 | 10 | 0 |
| Mode SS | |||
|---|---|---|---|
| Quadrant | BADHDUFLAG | Total packets | Discarded packets |
| A | 0 | 128 | 0 |
| B | 0 | 128 | 0 |
| C | 0 | 128 | 0 |
| D | 0 | 128 | 0 |
| Quadrant | Total seconds | Saturated seconds | Saturation percentage |
|---|---|---|---|
| A | 6283 | 855 | 13.608149% |
| B | 6284 | 223 | 3.548695% |
| C | 6283 | 295 | 4.695209% |
| D | 6283 | 4931 | 78.481617% |
Noise dominated data is calculated using 1-second bins in cleaned event files. If a bin has >2000 counts, and if more than 50% of those come from <1% of pixels, then it is considered to be noise-dominated and hence unusable.
| Quadrant | # 1 sec bins | Bins with >0 counts | Bins with >2000 counts | High rate bins dominated by noise | Noise dominated (total time) | Noise dominated (detector-on time) | Marked lightcurve |
|---|---|---|---|---|---|---|---|
| A | 7328 | 6283 | 586 | 586 | 8.00% | 9.33% | 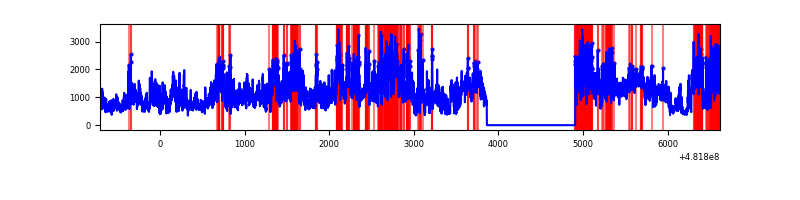 |
| B | 7329 | 6285 | 84 | 84 | 1.15% | 1.34% | 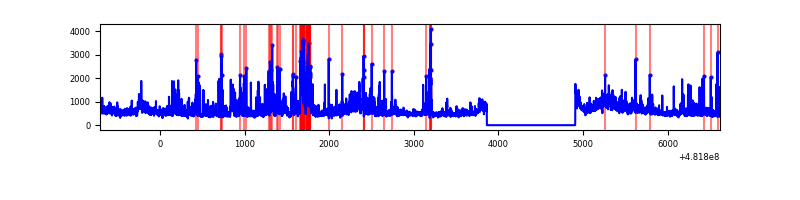 |
| C | 7327 | 6283 | 177 | 177 | 2.42% | 2.82% | 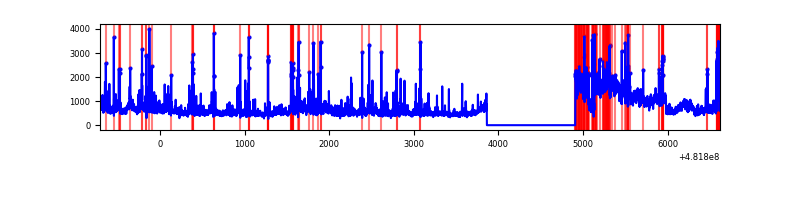 |
| D | 7327 | 6283 | 4542 | 4542 | 61.99% | 72.29% | 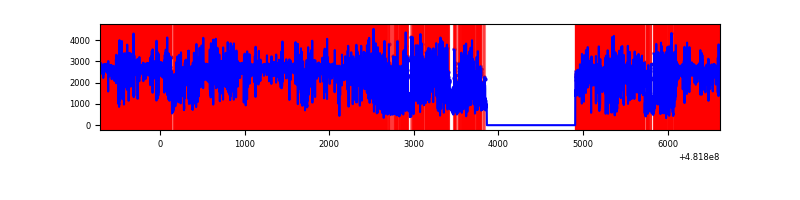 |
Top three noisy pixels from each quadrant. If the there are fewer than three noisy pixels in the level2.evt file, extra rows are filled as -1
| Pixel properties | Quadrant properties | ||||||
|---|---|---|---|---|---|---|---|
| Quadrant | DetID | PixID | Counts | Sigma | Mean | Median | Sigma |
| A | 12 | 3 | 2970616 | 18071.6 | 667 | 651 | 164.3 |
| A | 12 | 250 | 673526 | 4094.3 | 667 | 651 | 164.3 |
| A | 12 | 194 | 382335 | 2322.47 | 667 | 651 | 164.3 |
| B | 15 | 52 | 369899 | 2523.74 | 683 | 659 | 146.3 |
| B | 10 | 44 | 309613 | 2111.69 | 683 | 659 | 146.3 |
| B | 0 | 171 | 188358 | 1282.92 | 683 | 659 | 146.3 |
| C | 3 | 233 | 815220 | 4453.4 | 665 | 659 | 182.9 |
| C | 3 | 242 | 784676 | 4286.41 | 665 | 659 | 182.9 |
| C | 13 | 3 | 337800 | 1843.23 | 665 | 659 | 182.9 |
| D | 8 | 176 | 12567388 | 123988.33 | 364 | 352 | 101.4 |
| D | 0 | 113 | 88191 | 866.63 | 364 | 352 | 101.4 |
| D | 5 | 173 | 31534 | 307.65 | 364 | 352 | 101.4 |
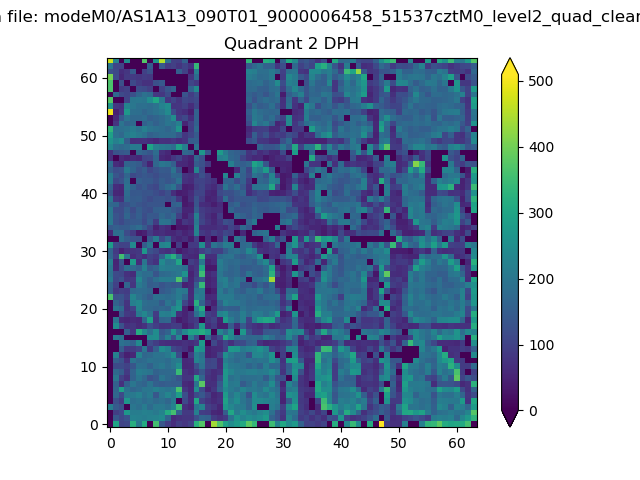
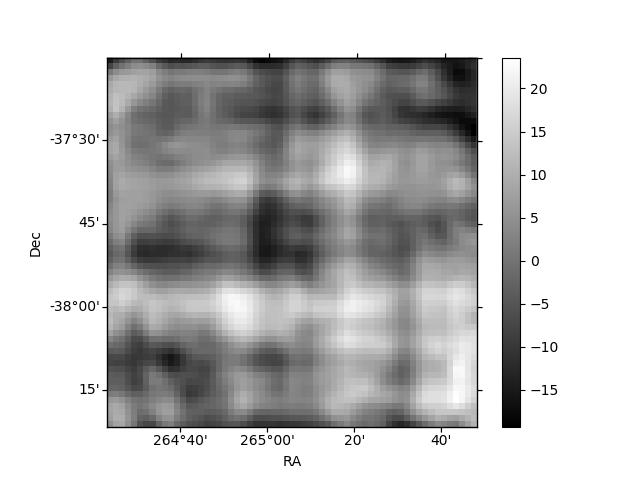
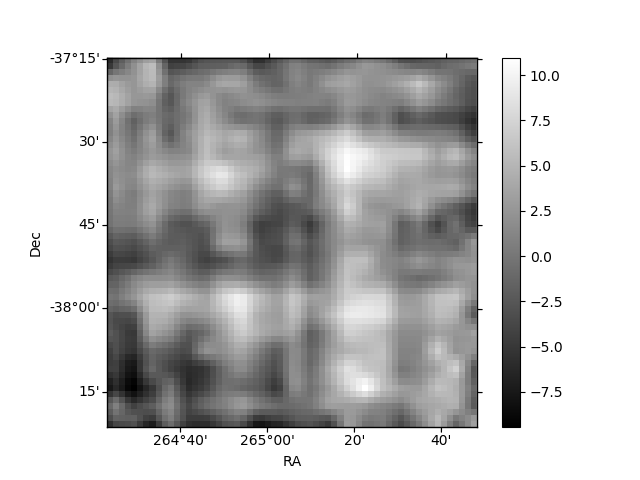
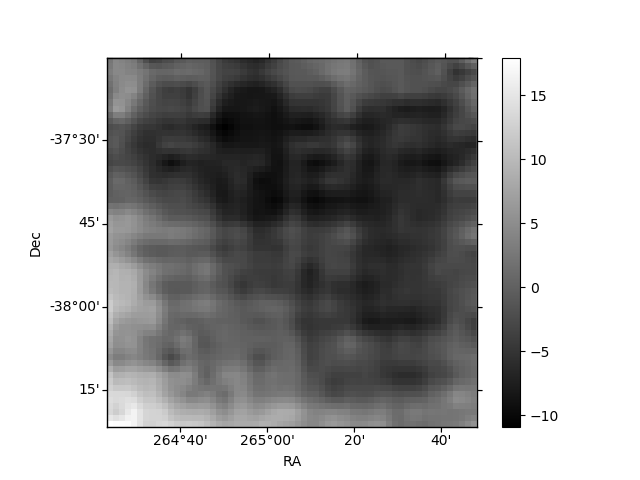
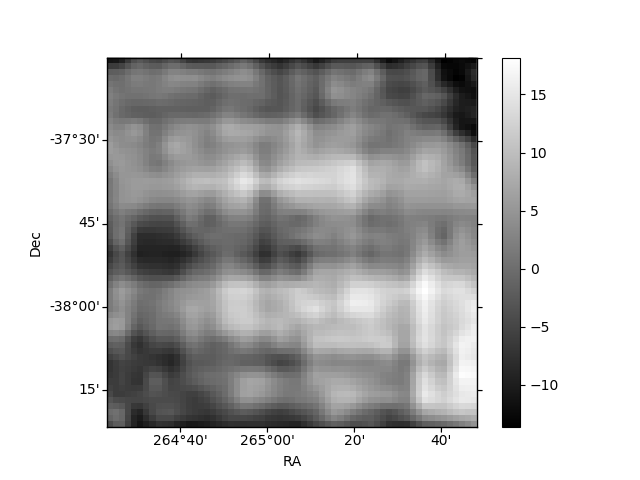
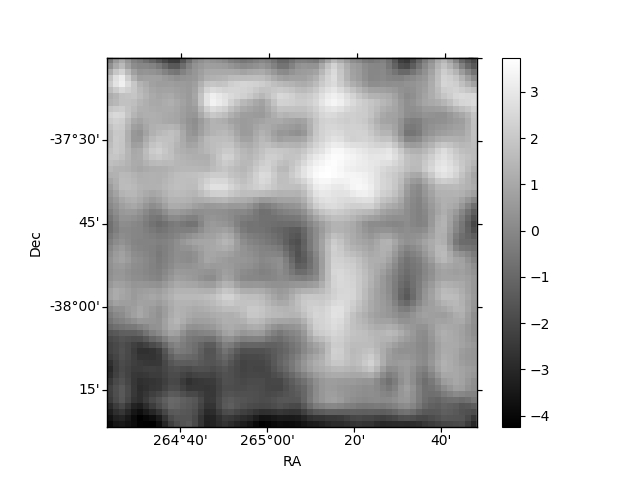
Histogram calculated using DETX and DETY for each event in the final _common_clean file
| Quadrant A | 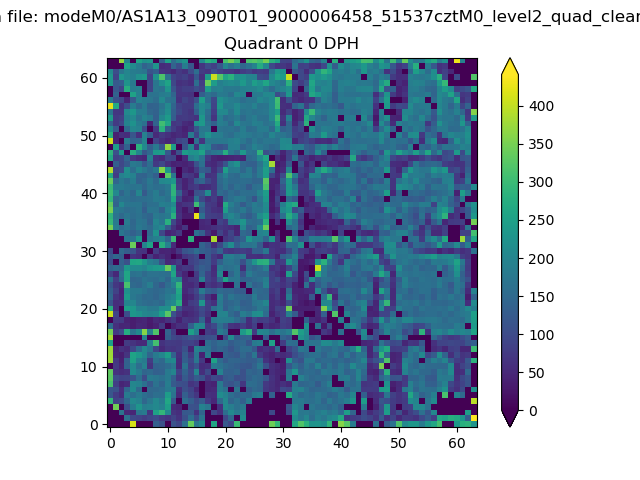 |
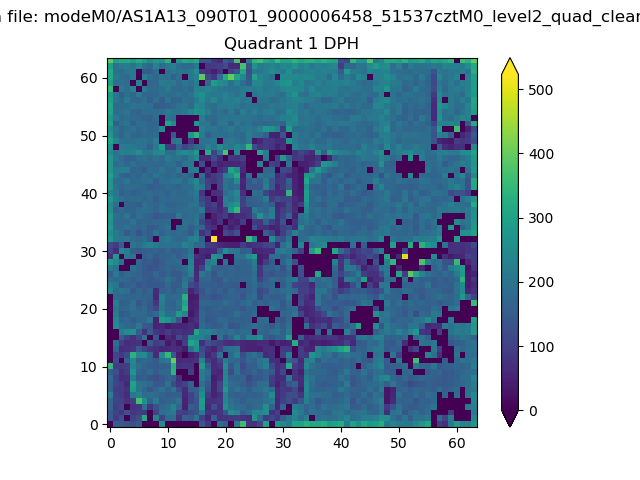 |
Quadrant B |
|---|---|---|---|
| Quadrant D | 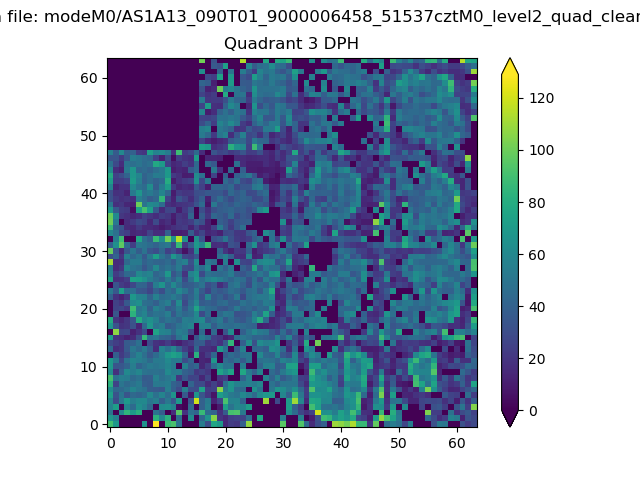 |
 |
Quadrant C |
| Plot type | Count rate plots | Images |
|---|---|---|
| Comparison with Poisson distribution Blue bars denote a histogram of data divided into 1 sec bins. Red curve is a Poisson curve with rate = median count rate of data. |
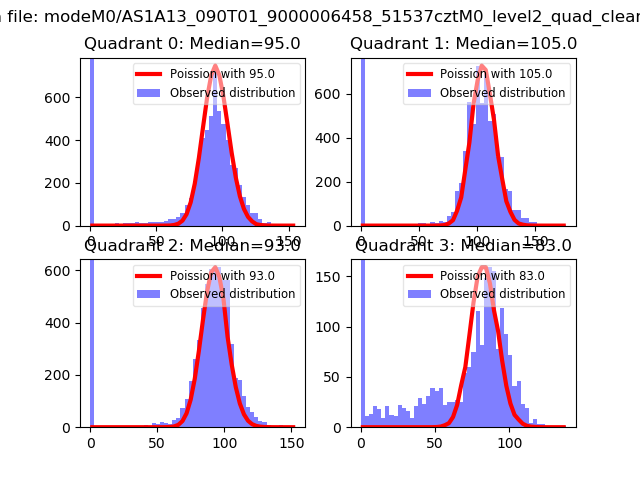 |
 |
| Quadrant-wise count rates Data is divided into 100 sec bins |
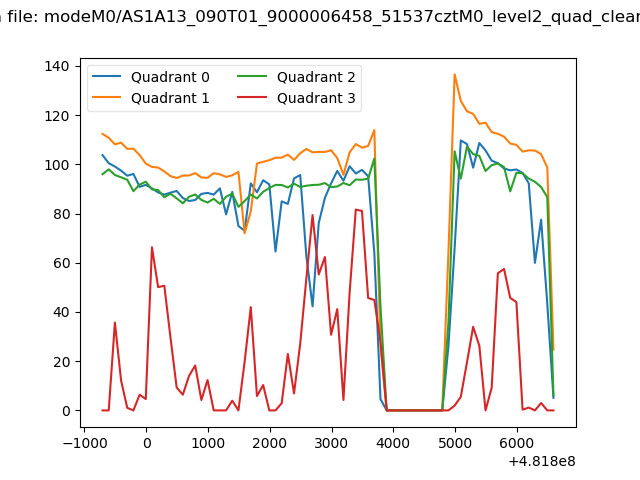 |
|
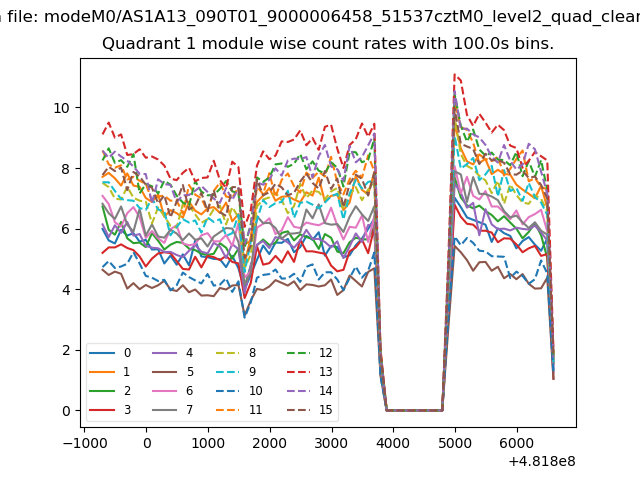
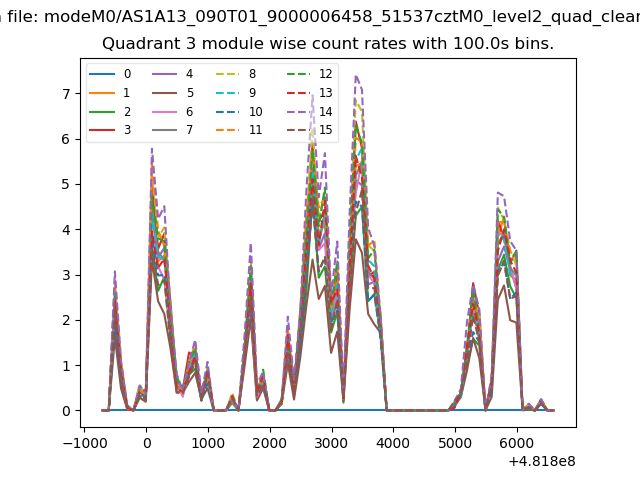
| Module-wise count rates for Quadrant A Data is divided into 100 sec bins |
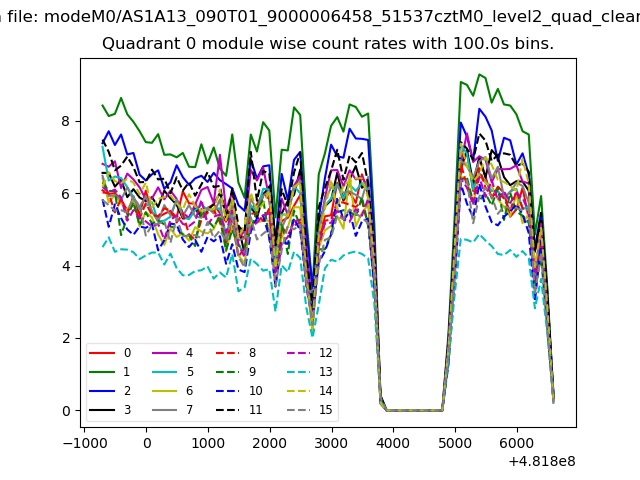 |
 |
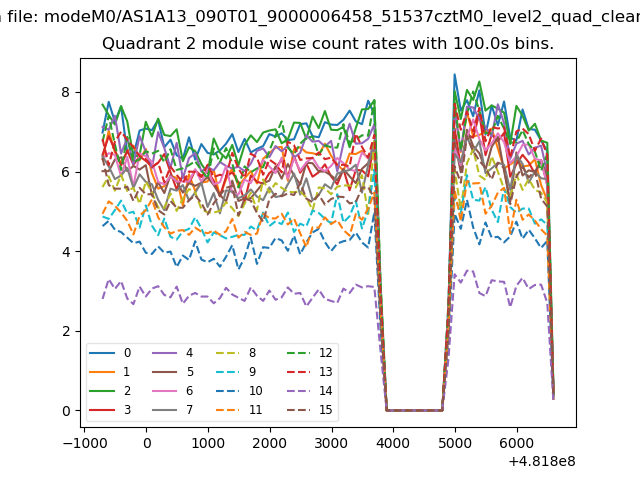
| Module-wise count rates for Quadrant B Data is divided into 100 sec bins |
 |
 |
| Module-wise count rates for Quadrant C Data is divided into 100 sec bins |
 |
 |
| Module-wise count rates for Quadrant D Data is divided into 100 sec bins |
 |
 |
| Parameter | Plot |
|---|---|
| CZT HV Monitor | 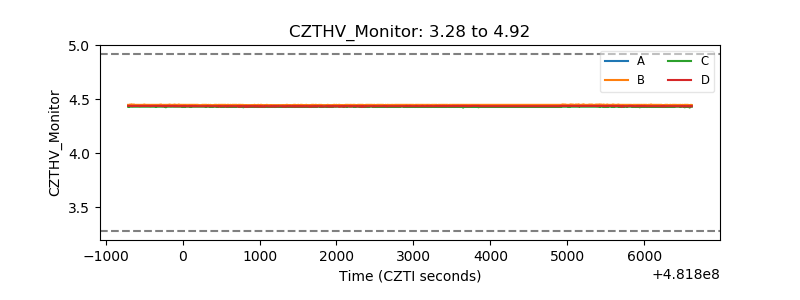 |
| D_VDD | 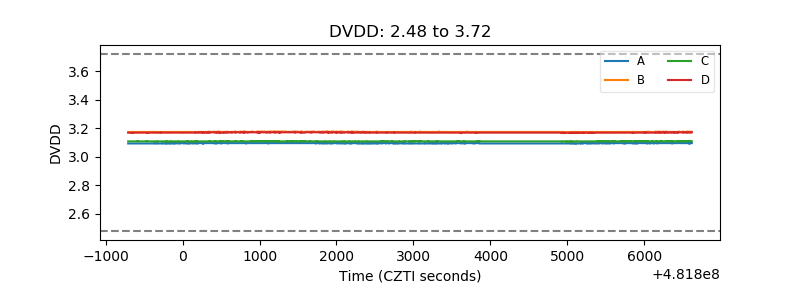 |
| Temperature 1 | 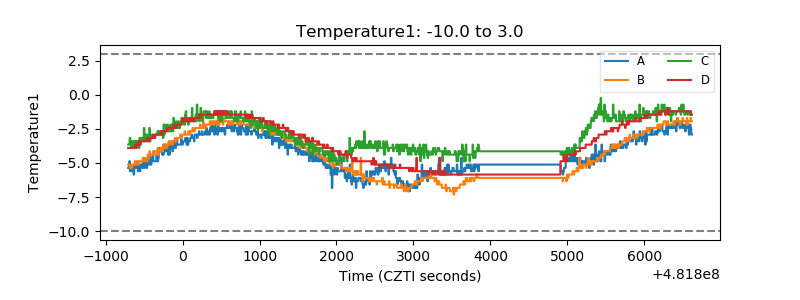 |
| Veto HV Monitor | 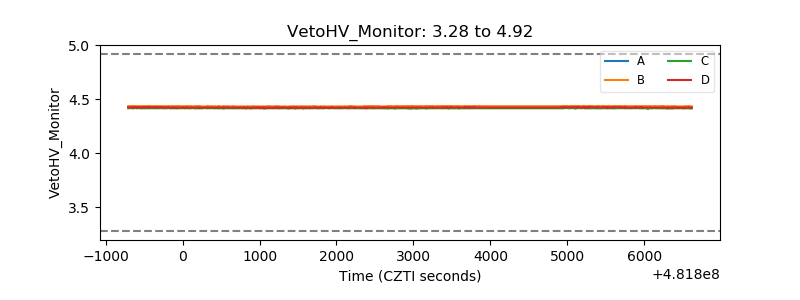 |
| Veto LLD |  |
| Alpha Counter | 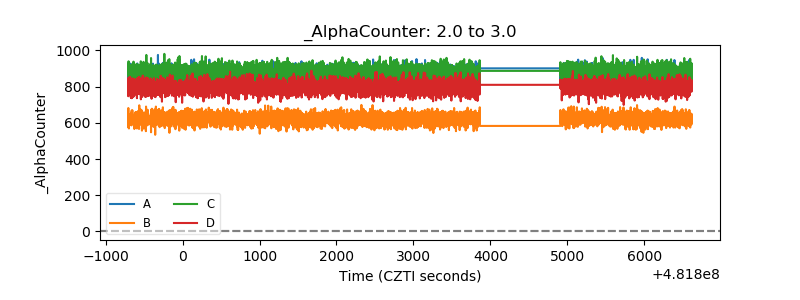 |
| _CPM_Rate | 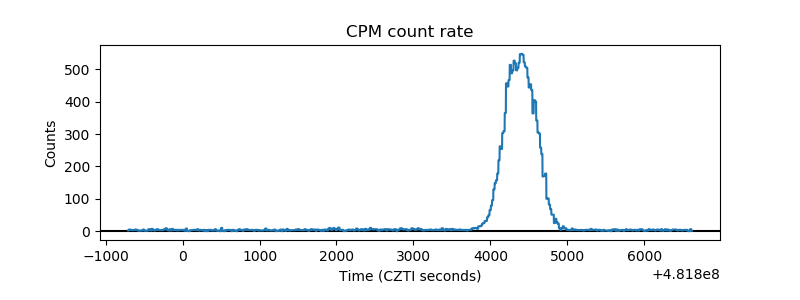 |
| CZT Counter | 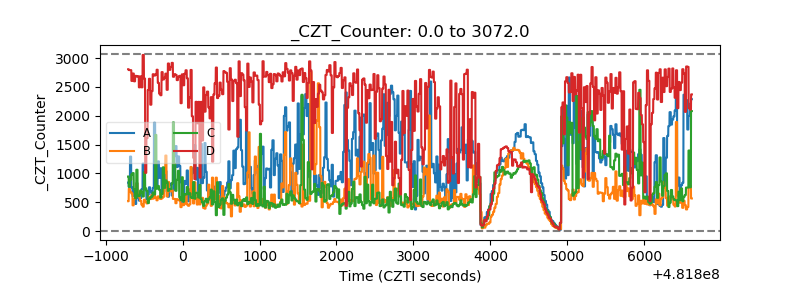 |
| +2.5 Volts monitor | 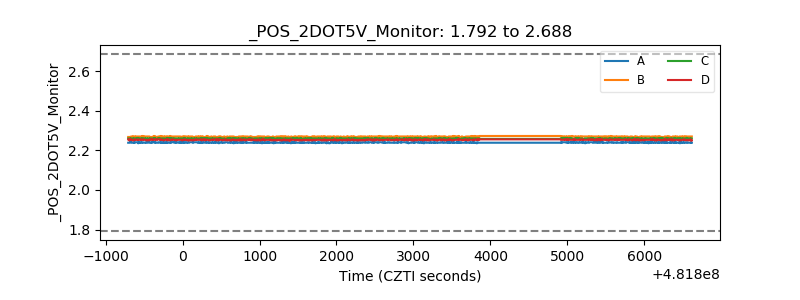 |
| +5 Volts monitor | 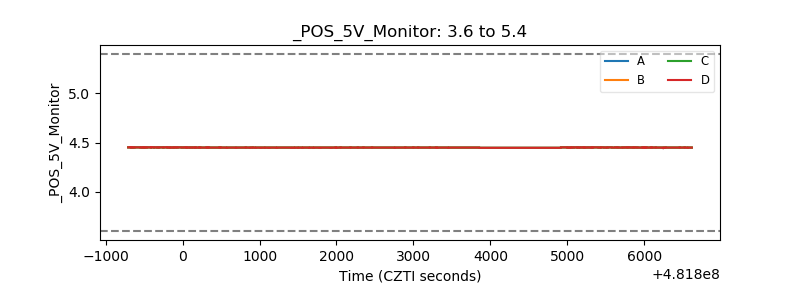 |
| _ROLL_ROT | 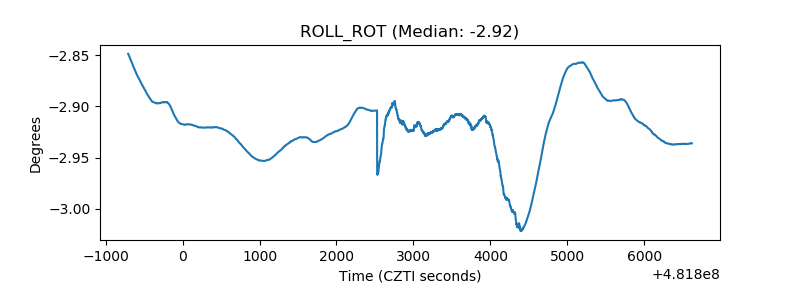 |
| _Roll_DEC | 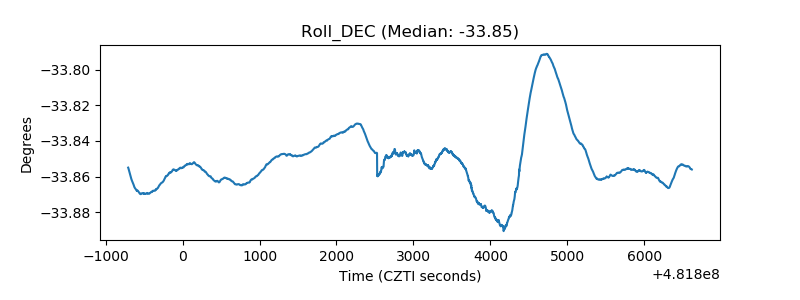 |
| _Roll_RA | 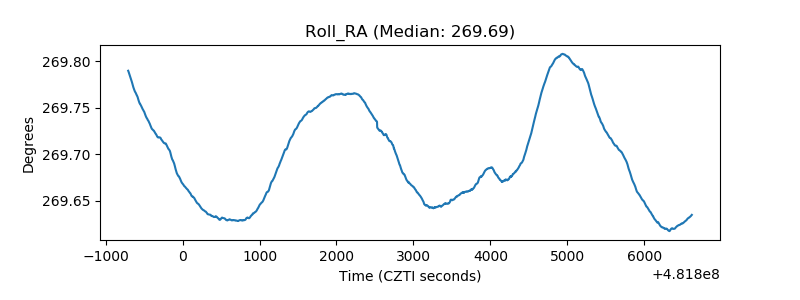 |
| Veto Counter | 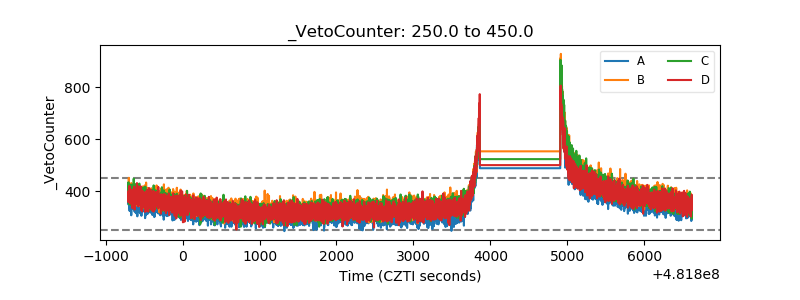 |