| Param | Original file | Final file |
|---|---|---|
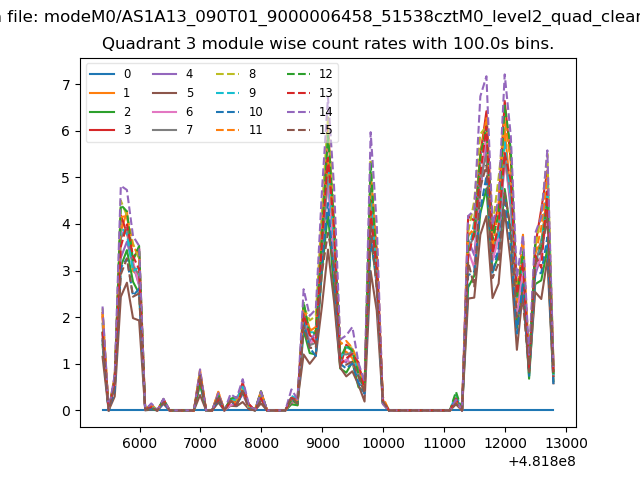
| Filename | modeM0/AS1A13_090T01_9000006458_51538cztM0_level2.fits | modeM0/AS1A13_090T01_9000006458_51538cztM0_level2_quad_clean.evt |
| Size (bytes) | 887,783,040 | 75,516,480 |
| Size | 846.7 MB | 72.0 MB |
| Events in quadrant A | 9,408,738 | 446,156 |
| Events in quadrant B | 4,156,708 | 663,045 |
| Events in quadrant C | 4,790,828 | 578,642 |
| Events in quadrant D | 14,013,532 | 153,638 |
| Mode M0 | |||
|---|---|---|---|
| Quadrant | BADHDUFLAG | Total packets | Discarded packets |
| A | 0 | 32400 | 1 |
| B | 0 | 16597 | 1 |
| C | 0 | 18461 | 1 |
| D | 0 | 46039 | 1 |
| Mode M9 | |||
|---|---|---|---|
| Quadrant | BADHDUFLAG | Total packets | Discarded packets |
| A | 0 | 10 | 0 |
| B | 0 | 10 | 0 |
| C | 0 | 10 | 0 |
| D | 0 | 10 | 0 |
| Mode SS | |||
|---|---|---|---|
| Quadrant | BADHDUFLAG | Total packets | Discarded packets |
| A | 0 | 130 | 0 |
| B | 0 | 130 | 0 |
| C | 0 | 130 | 0 |
| D | 0 | 130 | 0 |
| Quadrant | Total seconds | Saturated seconds | Saturation percentage |
|---|---|---|---|
| A | 6372 | 2212 | 34.714375% |
| B | 6373 | 275 | 4.315079% |
| C | 6373 | 349 | 5.476228% |
| D | 6373 | 4947 | 77.624353% |
Noise dominated data is calculated using 1-second bins in cleaned event files. If a bin has >2000 counts, and if more than 50% of those come from <1% of pixels, then it is considered to be noise-dominated and hence unusable.
| Quadrant | # 1 sec bins | Bins with >0 counts | Bins with >2000 counts | High rate bins dominated by noise | Noise dominated (total time) | Noise dominated (detector-on time) | Marked lightcurve |
|---|---|---|---|---|---|---|---|
| A | 7417 | 6372 | 1509 | 1509 | 20.35% | 23.68% | 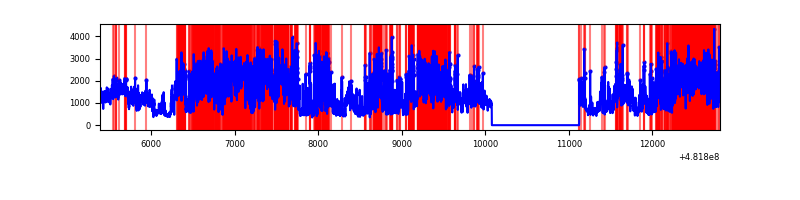 |
| B | 7418 | 6373 | 99 | 99 | 1.33% | 1.55% | 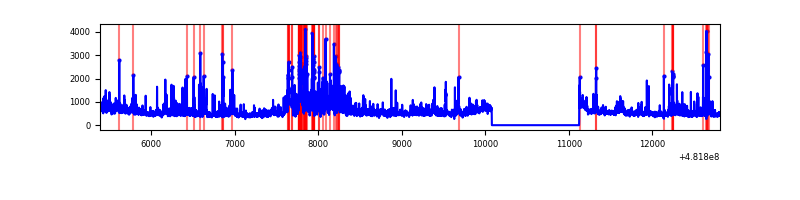 |
| C | 7418 | 6373 | 191 | 191 | 2.57% | 3.00% | 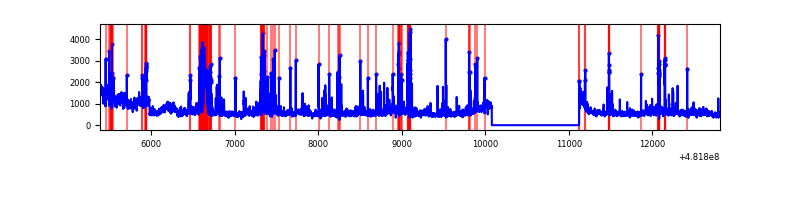 |
| D | 7418 | 6373 | 4300 | 4300 | 57.97% | 67.47% | 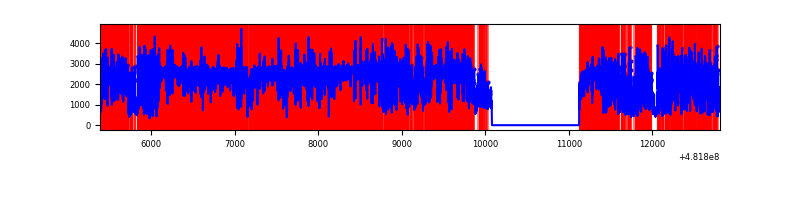 |
Top three noisy pixels from each quadrant. If the there are fewer than three noisy pixels in the level2.evt file, extra rows are filled as -1
| Pixel properties | Quadrant properties | ||||||
|---|---|---|---|---|---|---|---|
| Quadrant | DetID | PixID | Counts | Sigma | Mean | Median | Sigma |
| A | 12 | 250 | 2244303 | 14119.12 | 638 | 622 | 158.9 |
| A | 12 | 3 | 1629343 | 10249.28 | 638 | 622 | 158.9 |
| A | 7 | 64 | 1431242 | 9002.66 | 638 | 622 | 158.9 |
| B | 5 | 185 | 355621 | 2356.62 | 706 | 682 | 150.6 |
| B | 0 | 171 | 213859 | 1415.39 | 706 | 682 | 150.6 |
| B | 15 | 52 | 174843 | 1156.34 | 706 | 682 | 150.6 |
| C | 3 | 233 | 764216 | 4040.25 | 688 | 680 | 189.0 |
| C | 13 | 3 | 700558 | 3703.41 | 688 | 680 | 189.0 |
| C | 3 | 242 | 419807 | 2217.81 | 688 | 680 | 189.0 |
| D | 8 | 176 | 11754935 | 117010.92 | 361 | 348 | 100.5 |
| D | 12 | 6 | 577187 | 5742.14 | 361 | 348 | 100.5 |
| D | 8 | 160 | 46777 | 462.18 | 361 | 348 | 100.5 |
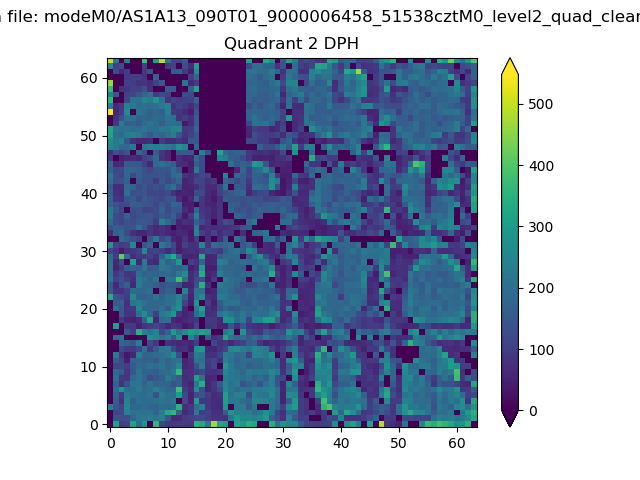
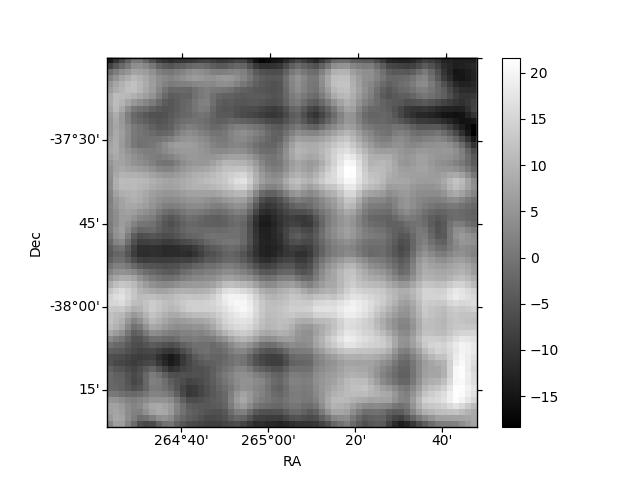
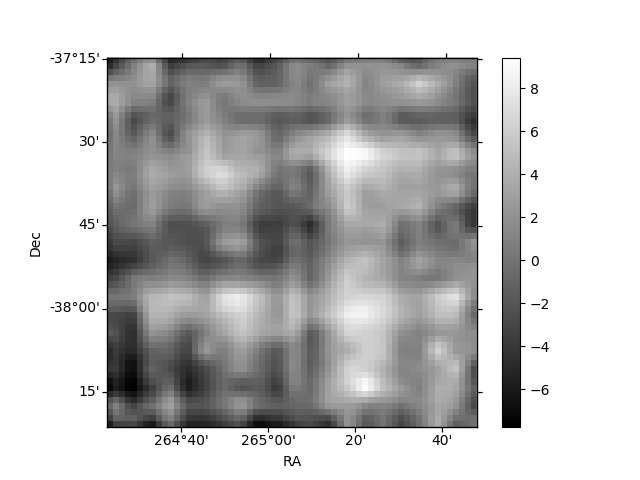
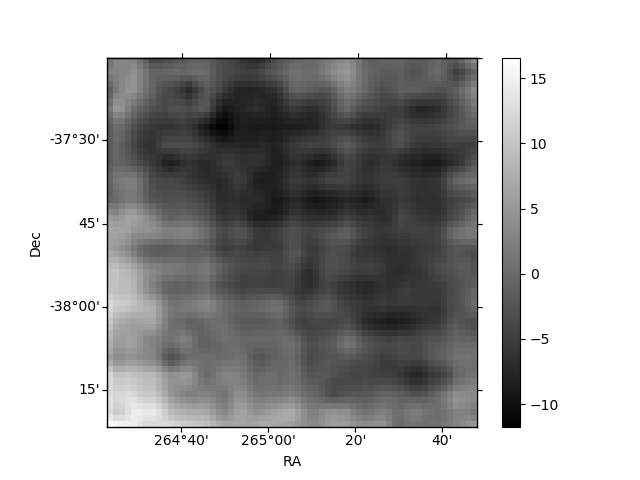
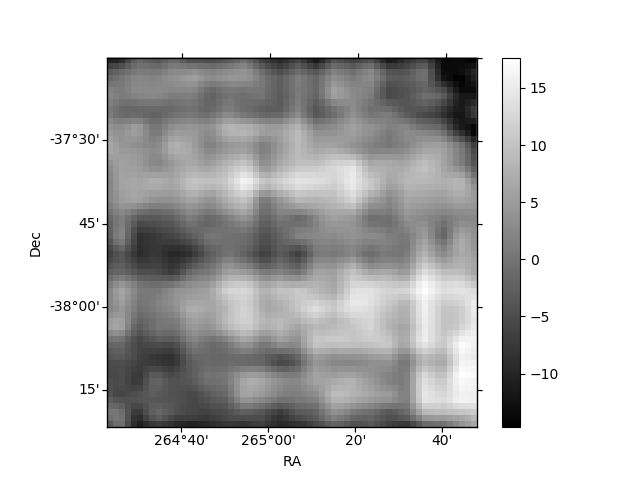
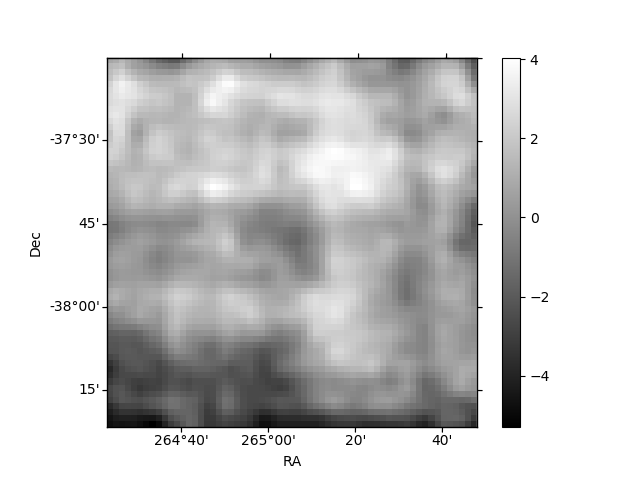
Histogram calculated using DETX and DETY for each event in the final _common_clean file
| Quadrant A | 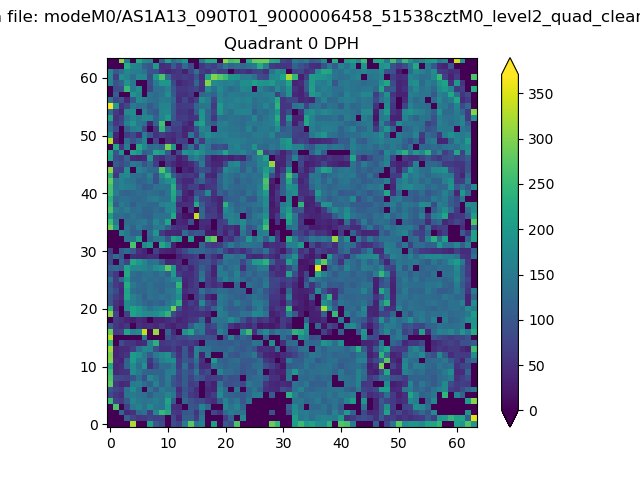 |
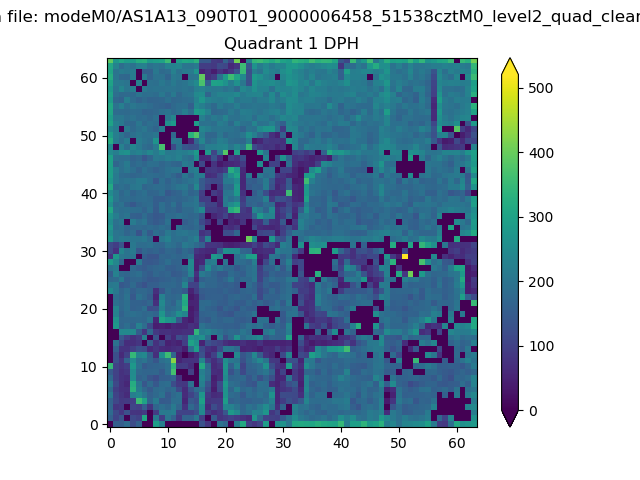 |
Quadrant B |
|---|---|---|---|
| Quadrant D | 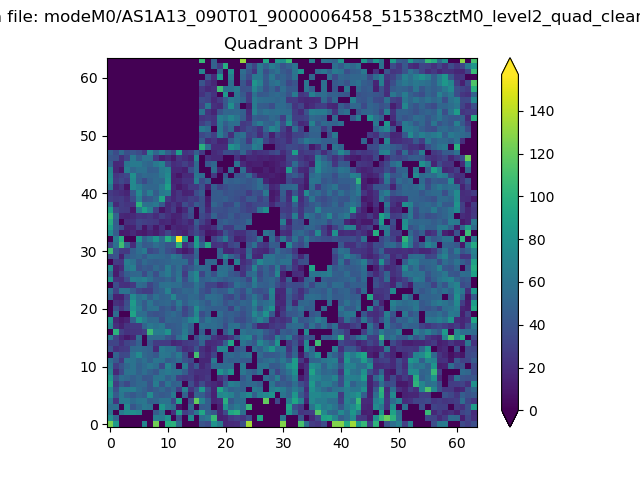 |
 |
Quadrant C |
| Plot type | Count rate plots | Images |
|---|---|---|
| Comparison with Poisson distribution Blue bars denote a histogram of data divided into 1 sec bins. Red curve is a Poisson curve with rate = median count rate of data. |
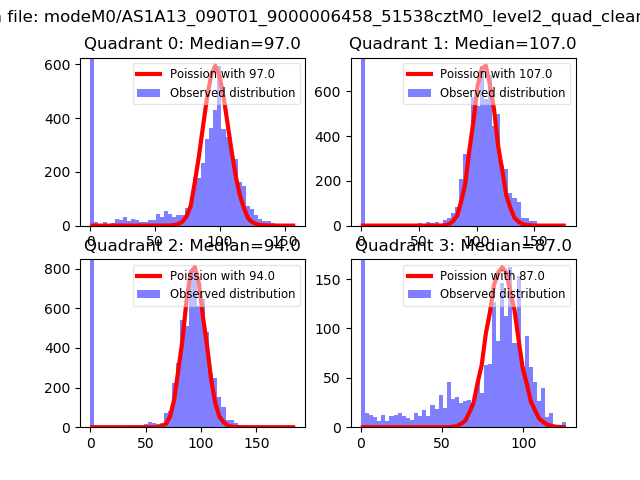 |
 |
| Quadrant-wise count rates Data is divided into 100 sec bins |
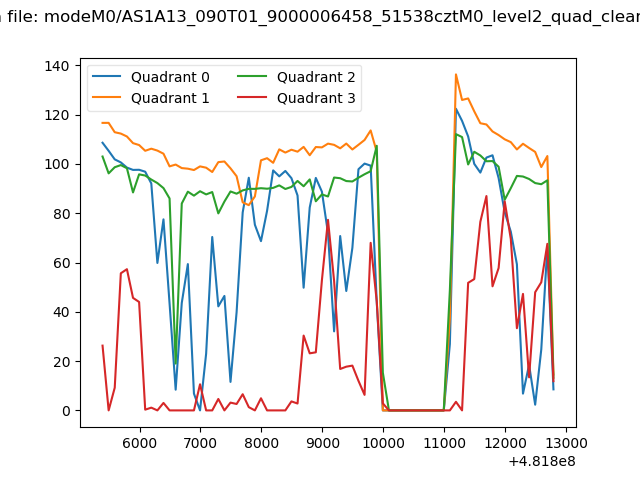 |
|
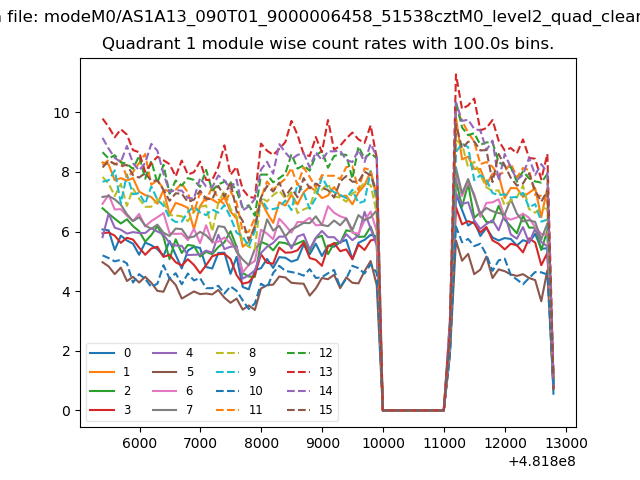
| Module-wise count rates for Quadrant A Data is divided into 100 sec bins |
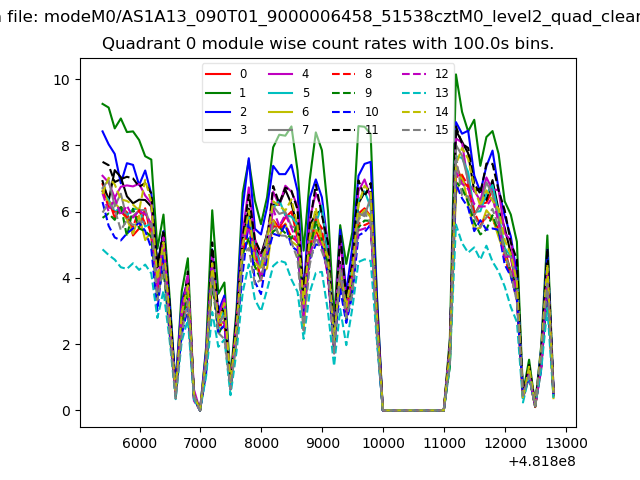 |
 |
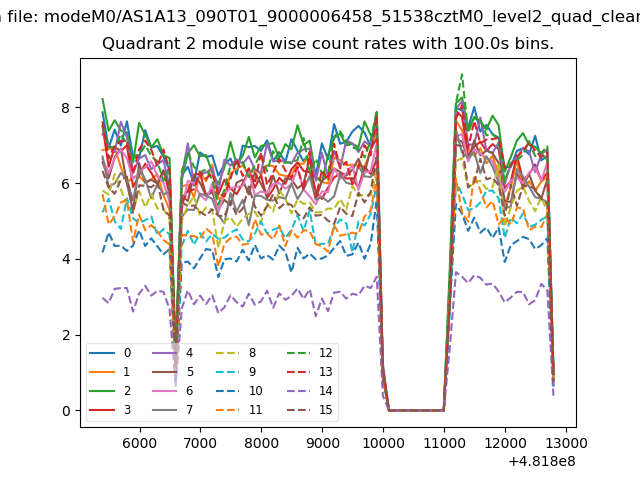
| Module-wise count rates for Quadrant B Data is divided into 100 sec bins |
 |
 |
| Module-wise count rates for Quadrant C Data is divided into 100 sec bins |
 |
 |
| Module-wise count rates for Quadrant D Data is divided into 100 sec bins |
 |
 |
| Parameter | Plot |
|---|---|
| CZT HV Monitor | 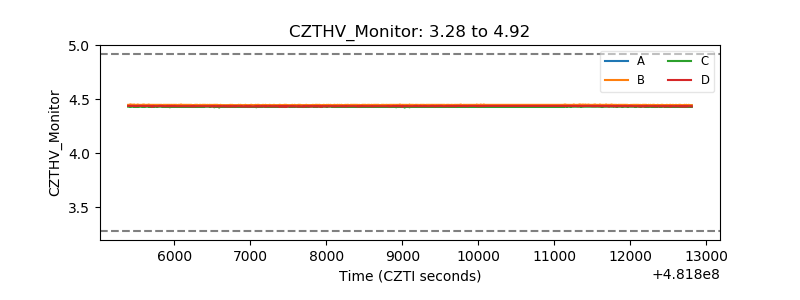 |
| D_VDD | 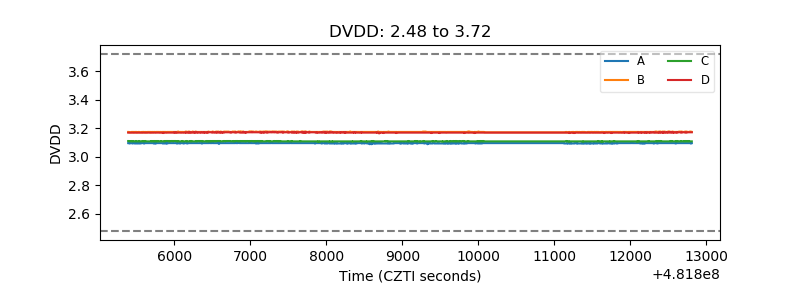 |
| Temperature 1 | 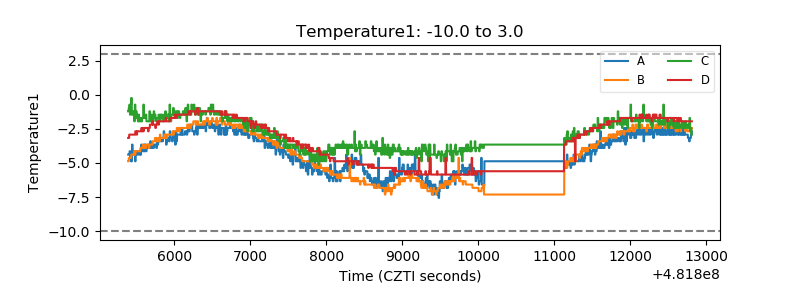 |
| Veto HV Monitor | 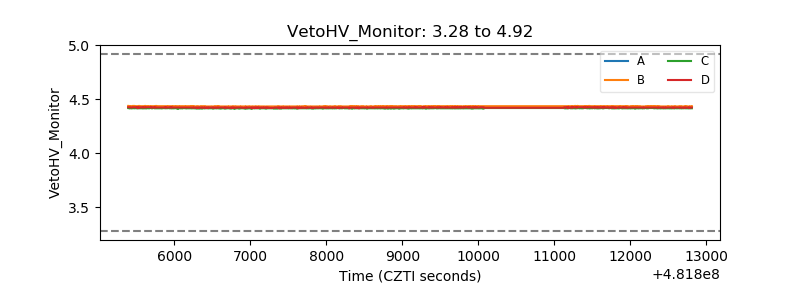 |
| Veto LLD | 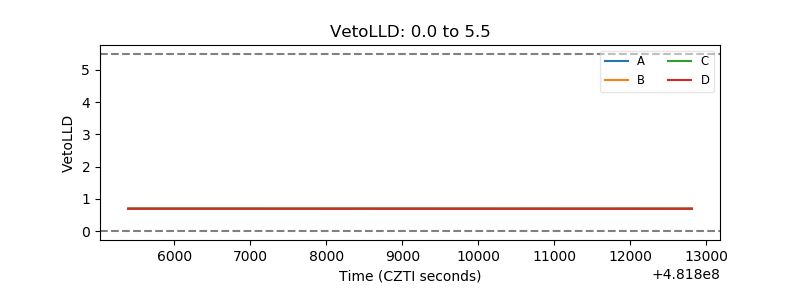 |
| Alpha Counter | 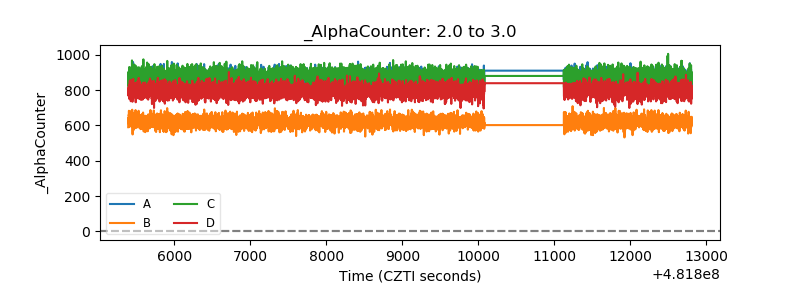 |
| _CPM_Rate | 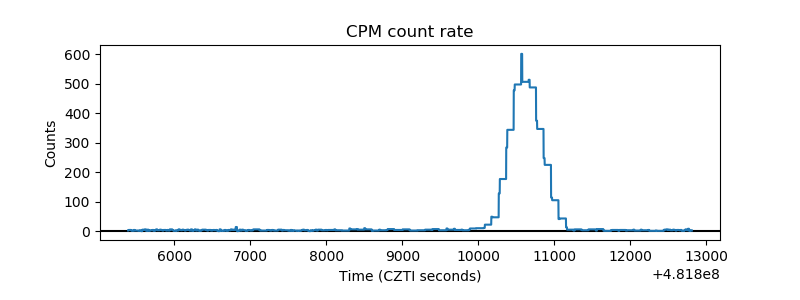 |
| CZT Counter | 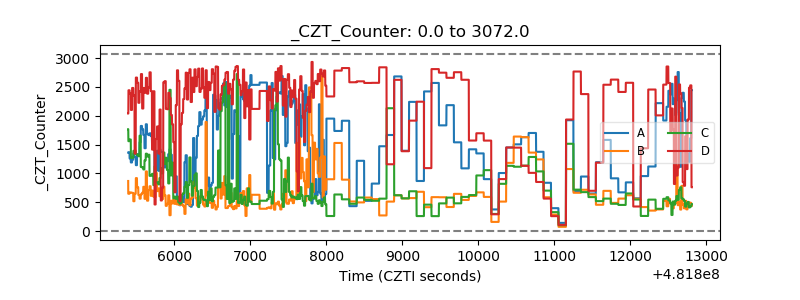 |
| +2.5 Volts monitor | 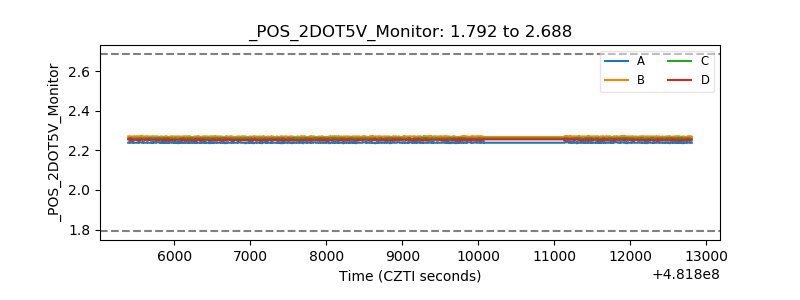 |
| +5 Volts monitor | 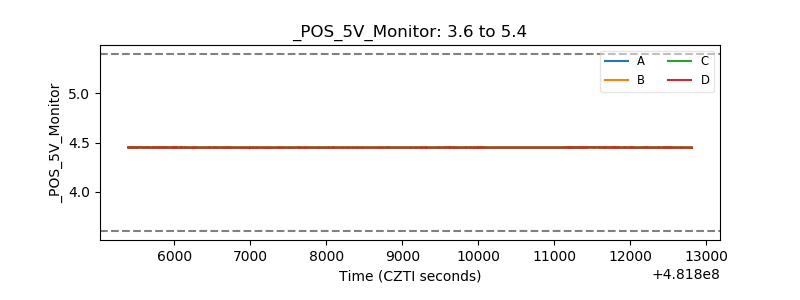 |
| _ROLL_ROT | 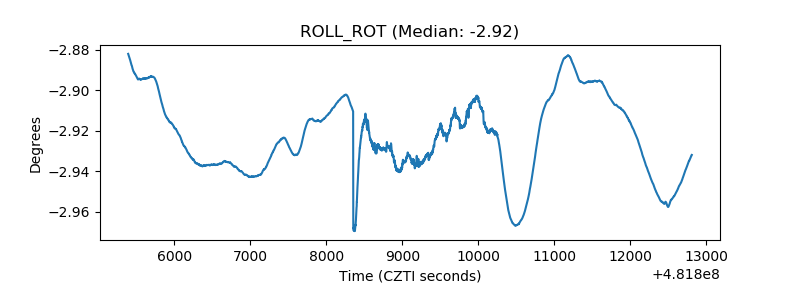 |
| _Roll_DEC | 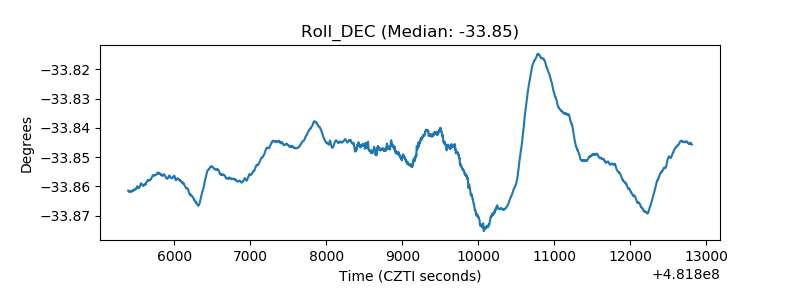 |
| _Roll_RA | 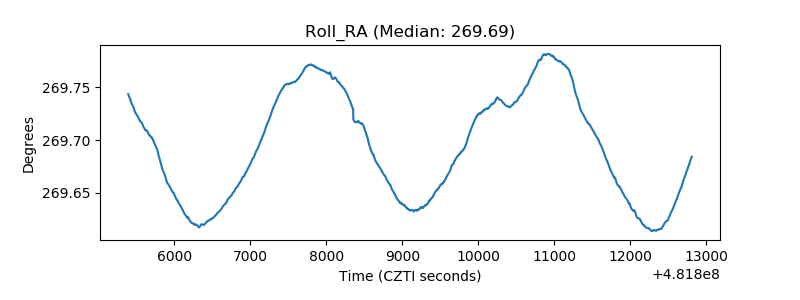 |
| Veto Counter | 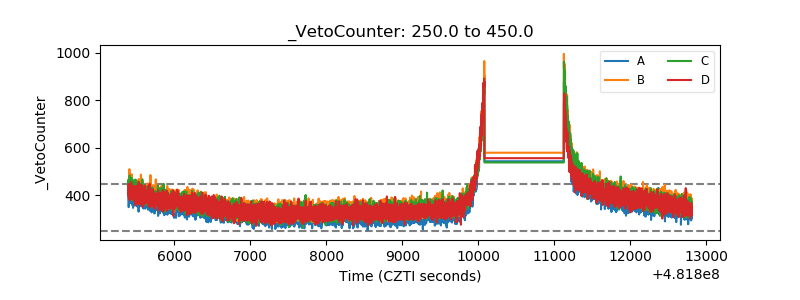 |