| Param | Original file | Final file |
|---|---|---|
| Filename | modeM0/AS1A13_090T01_9000006458_51541cztM0_level2.fits | modeM0/AS1A13_090T01_9000006458_51541cztM0_level2_quad_clean.evt |
| Size (bytes) | 1,853,159,040 | 226,702,080 |
| Size | 1.7 GB | 216.2 MB |
| Events in quadrant A | 18,332,396 | 1,384,430 |
| Events in quadrant B | 10,752,568 | 1,746,050 |
| Events in quadrant C | 10,285,286 | 1,575,916 |
| Events in quadrant D | 27,887,970 | 959,476 |
| Mode M0 | |||
|---|---|---|---|
| Quadrant | BADHDUFLAG | Total packets | Discarded packets |
| A | 0 | 66475 | 9 |
| B | 0 | 43591 | 4 |
| C | 0 | 42474 | 4 |
| D | 0 | 94949 | 4 |
| Mode M9 | |||
|---|---|---|---|
| Quadrant | BADHDUFLAG | Total packets | Discarded packets |
| A | 0 | 34 | 0 |
| B | 0 | 35 | 0 |
| C | 0 | 35 | 0 |
| D | 0 | 35 | 0 |
| Mode SS | |||
|---|---|---|---|
| Quadrant | BADHDUFLAG | Total packets | Discarded packets |
| A | 0 | 354 | 0 |
| B | 0 | 354 | 0 |
| C | 0 | 354 | 0 |
| D | 0 | 354 | 0 |
| Quadrant | Total seconds | Saturated seconds | Saturation percentage |
|---|---|---|---|
| A | 17368 | 2963 | 17.060111% |
| B | 17369 | 790 | 4.548333% |
| C | 17369 | 499 | 2.872935% |
| D | 17368 | 6779 | 39.031552% |
Noise dominated data is calculated using 1-second bins in cleaned event files. If a bin has >2000 counts, and if more than 50% of those come from <1% of pixels, then it is considered to be noise-dominated and hence unusable.
| Quadrant | # 1 sec bins | Bins with >0 counts | Bins with >2000 counts | High rate bins dominated by noise | Noise dominated (total time) | Noise dominated (detector-on time) | Marked lightcurve |
|---|---|---|---|---|---|---|---|
| A | 20269 | 17369 | 2032 | 2032 | 10.03% | 11.70% | 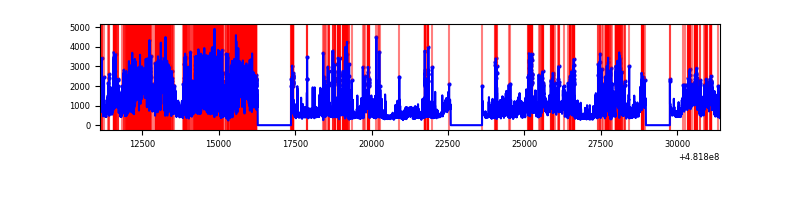 |
| B | 20269 | 17370 | 289 | 289 | 1.43% | 1.66% | 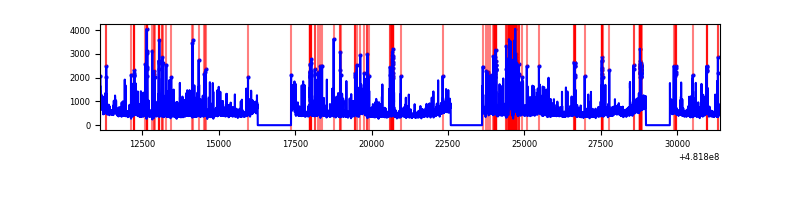 |
| C | 20269 | 17372 | 264 | 264 | 1.30% | 1.52% | 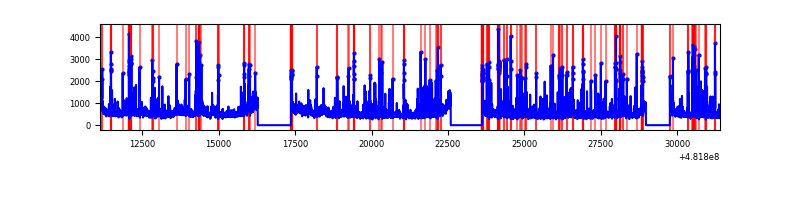 |
| D | 20268 | 17370 | 6085 | 6085 | 30.02% | 35.03% |  |
Top three noisy pixels from each quadrant. If the there are fewer than three noisy pixels in the level2.evt file, extra rows are filled as -1
| Pixel properties | Quadrant properties | ||||||
|---|---|---|---|---|---|---|---|
| Quadrant | DetID | PixID | Counts | Sigma | Mean | Median | Sigma |
| A | 7 | 64 | 3241351 | 7317.27 | 1803 | 1758 | 442.7 |
| A | 12 | 250 | 2229231 | 5031.19 | 1803 | 1758 | 442.7 |
| A | 12 | 3 | 2082984 | 4700.86 | 1803 | 1758 | 442.7 |
| B | 10 | 44 | 678752 | 1673.94 | 1901 | 1836 | 404.4 |
| B | 0 | 171 | 442858 | 1090.6 | 1901 | 1836 | 404.4 |
| B | 15 | 52 | 329231 | 809.61 | 1901 | 1836 | 404.4 |
| C | 3 | 233 | 1038532 | 2029.72 | 1868 | 1850 | 510.8 |
| C | 13 | 3 | 901067 | 1760.58 | 1868 | 1850 | 510.8 |
| C | 15 | 1 | 131130 | 253.12 | 1868 | 1850 | 510.8 |
| D | 8 | 176 | 18324159 | 43205.53 | 1511 | 1454 | 424.1 |
| D | 12 | 6 | 2503480 | 5899.86 | 1511 | 1454 | 424.1 |
| D | 1 | 3 | 162403 | 379.52 | 1511 | 1454 | 424.1 |
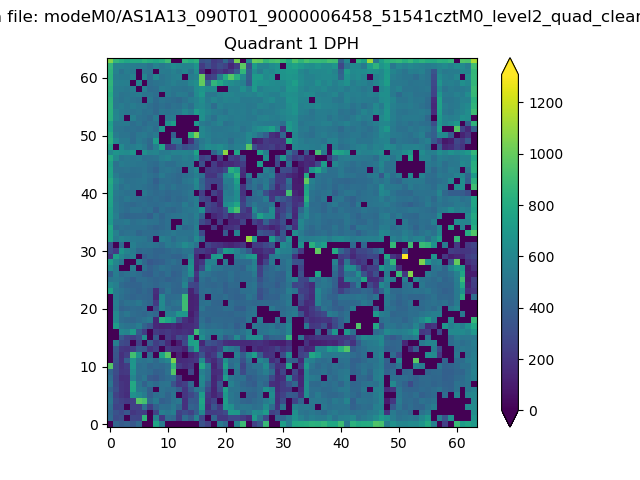
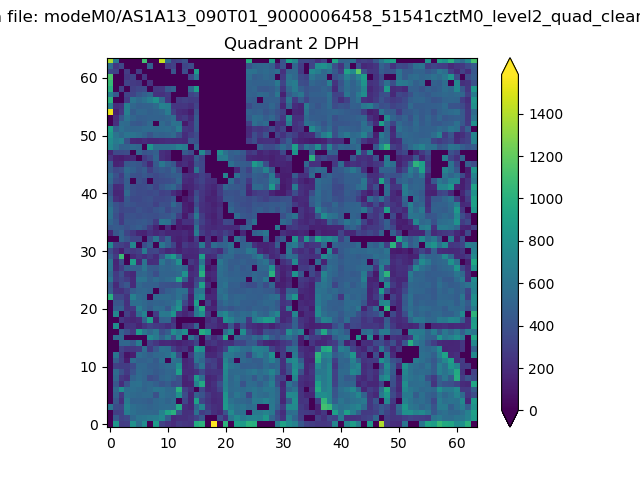
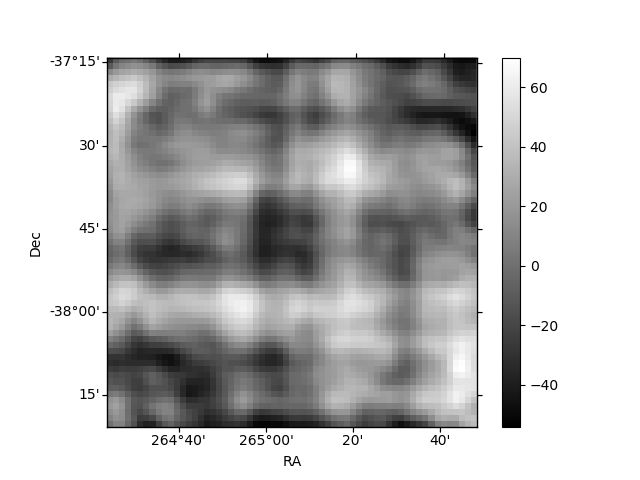
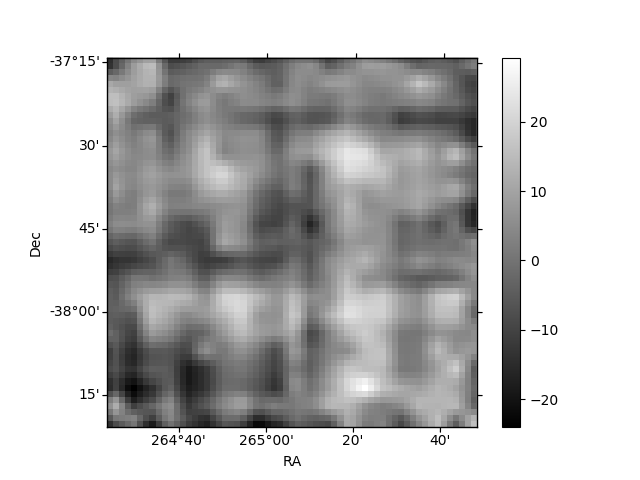
Histogram calculated using DETX and DETY for each event in the final _common_clean file
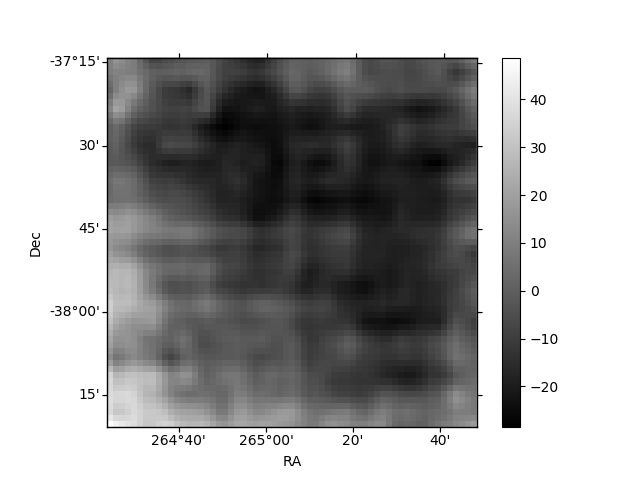
| Quadrant A | 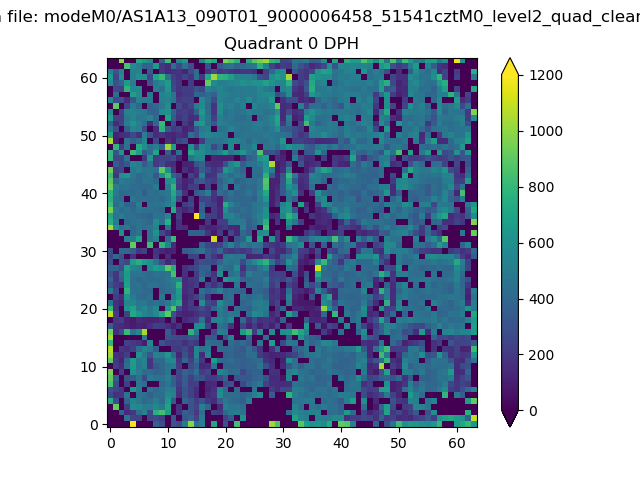 |
 |
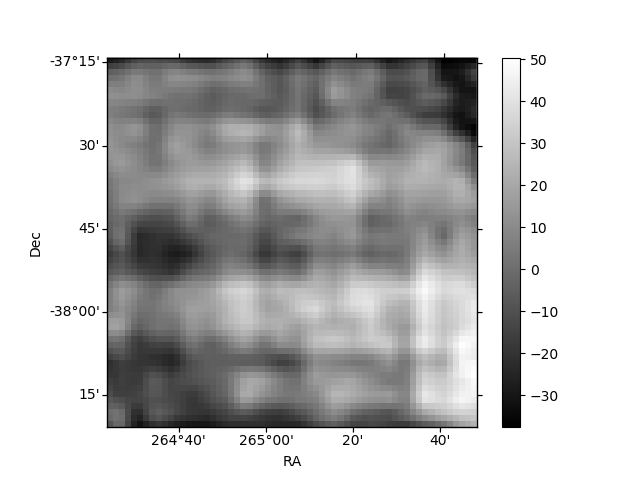
Quadrant B |
|---|---|---|---|
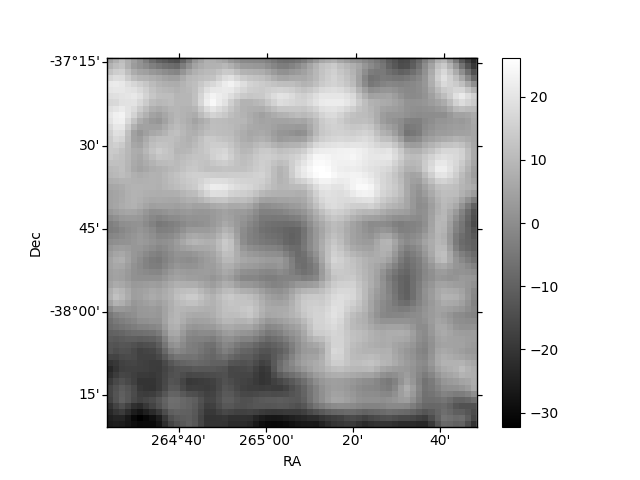
| Quadrant D | 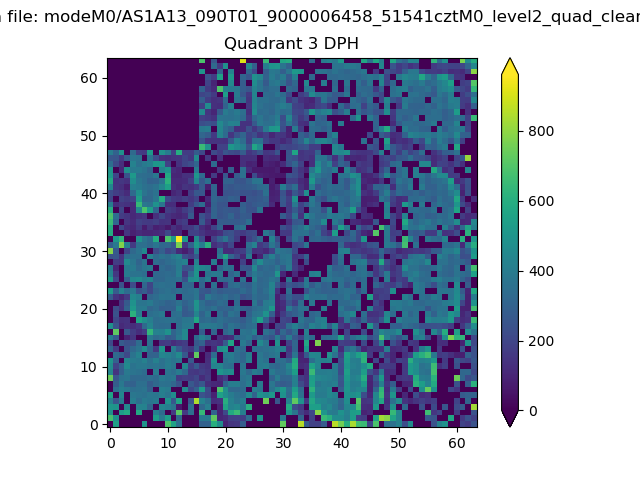 |
 |
Quadrant C |
| Plot type | Count rate plots | Images |
|---|---|---|
| Comparison with Poisson distribution Blue bars denote a histogram of data divided into 1 sec bins. Red curve is a Poisson curve with rate = median count rate of data. |
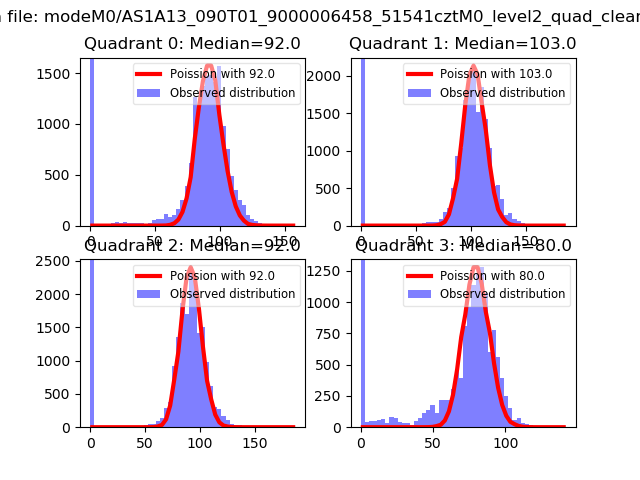 |
 |
| Quadrant-wise count rates Data is divided into 100 sec bins |
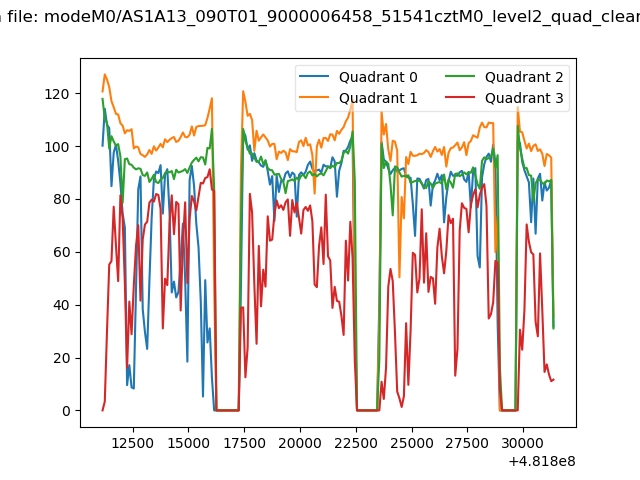 |
|
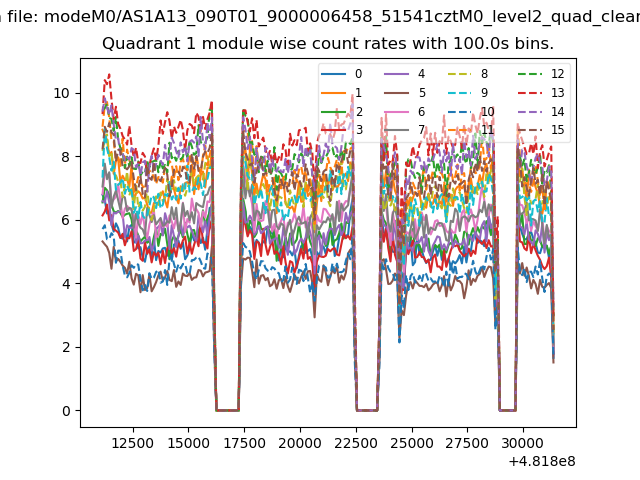
| Module-wise count rates for Quadrant A Data is divided into 100 sec bins |
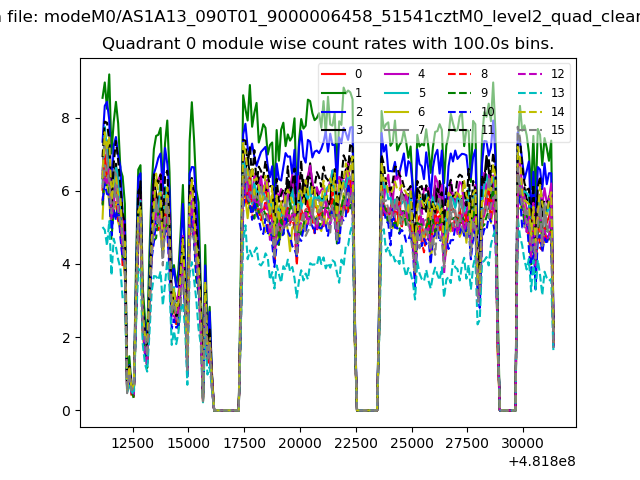 |
 |
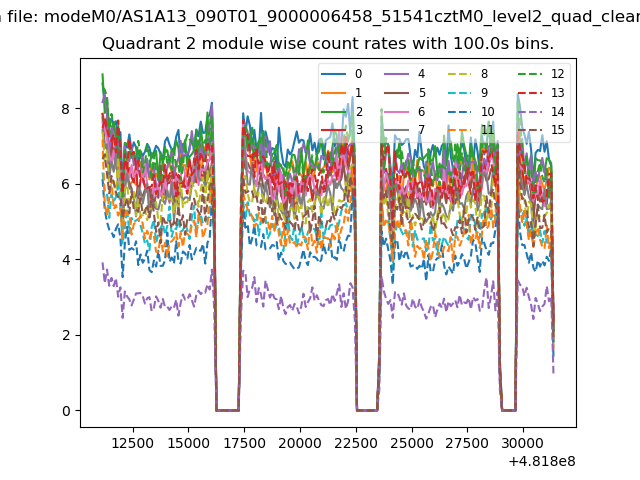
| Module-wise count rates for Quadrant B Data is divided into 100 sec bins |
 |
 |
| Module-wise count rates for Quadrant C Data is divided into 100 sec bins |
 |
 |
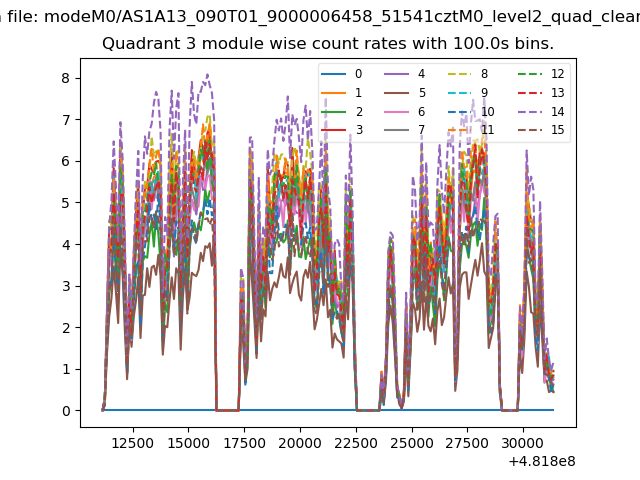
| Module-wise count rates for Quadrant D Data is divided into 100 sec bins |
 |
 |
| Parameter | Plot |
|---|---|
| CZT HV Monitor | 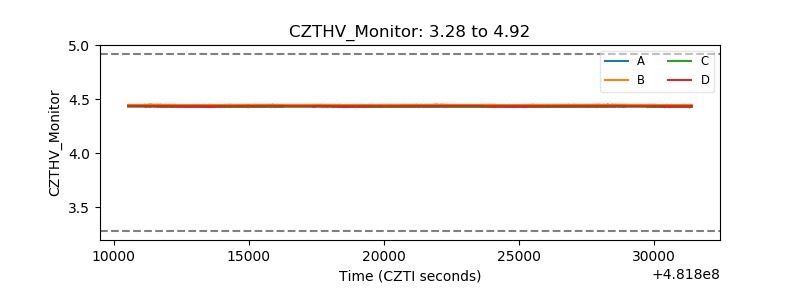 |
| D_VDD | 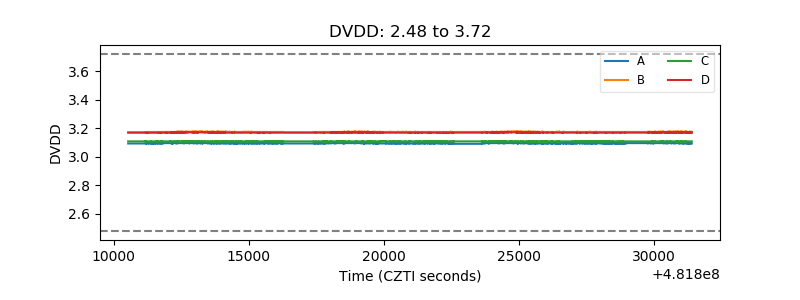 |
| Temperature 1 | 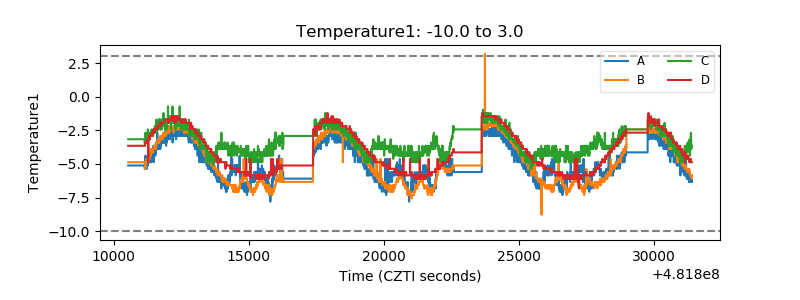 |
| Veto HV Monitor | 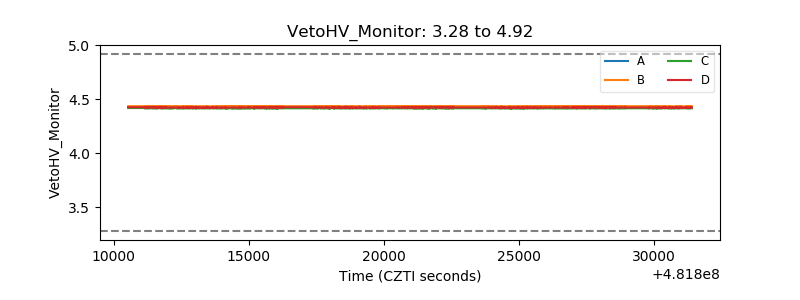 |
| Veto LLD | 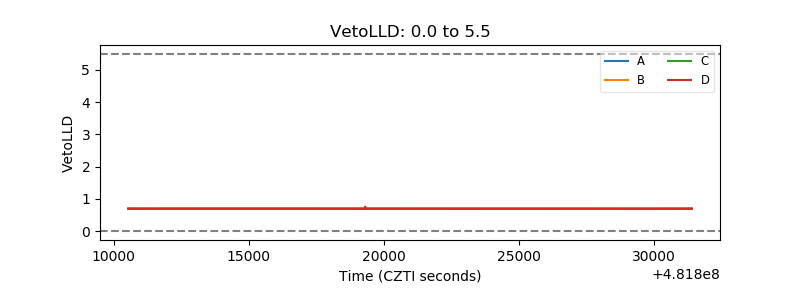 |
| Alpha Counter | 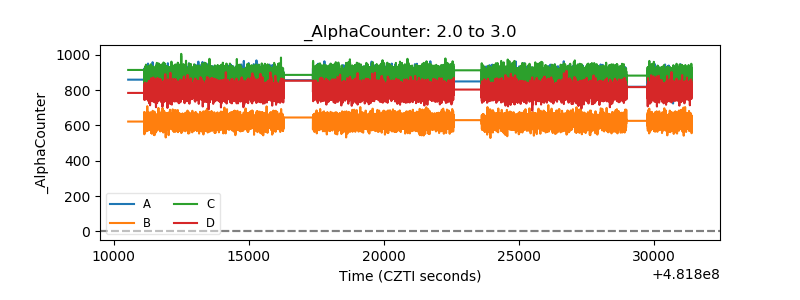 |
| _CPM_Rate | 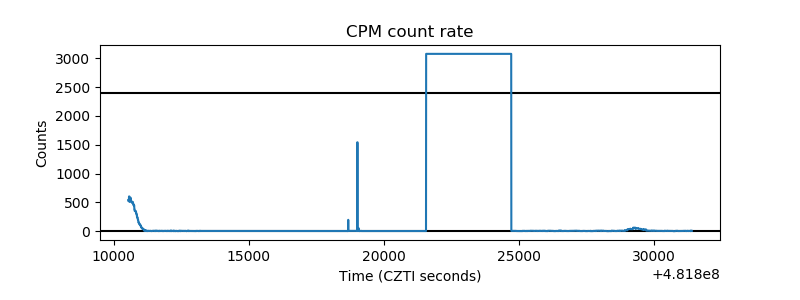 |
| CZT Counter | 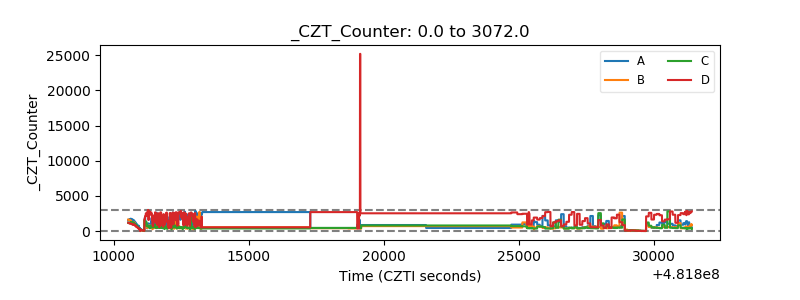 |
| +2.5 Volts monitor | 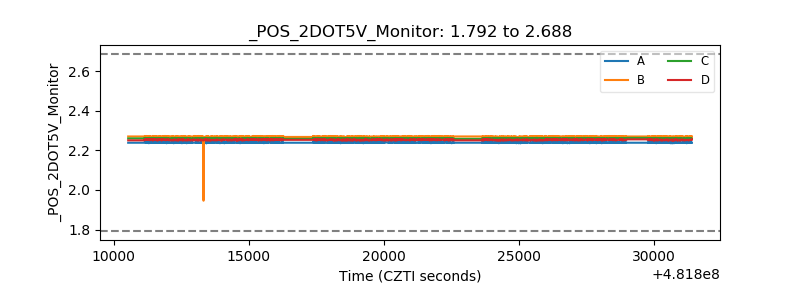 |
| +5 Volts monitor | 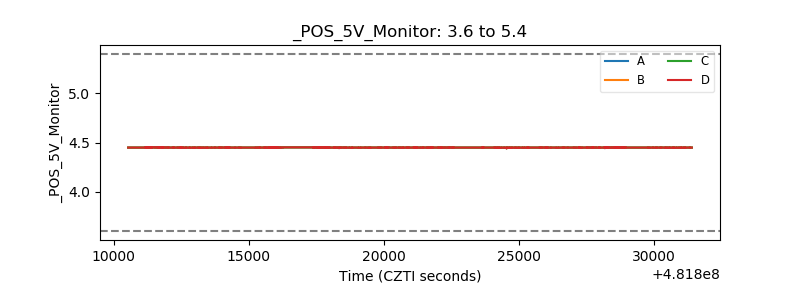 |
| _ROLL_ROT | 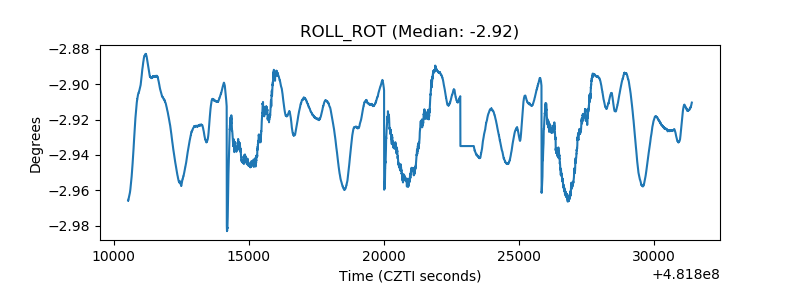 |
| _Roll_DEC | 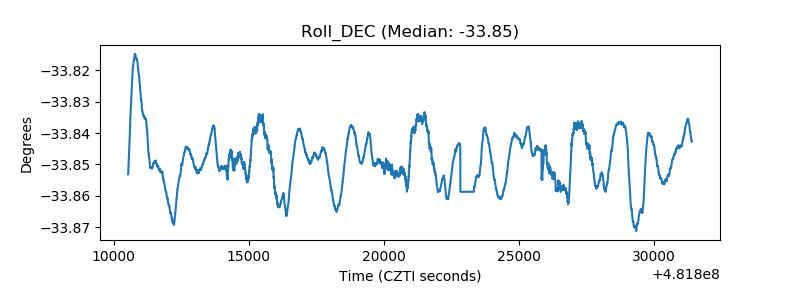 |
| _Roll_RA | 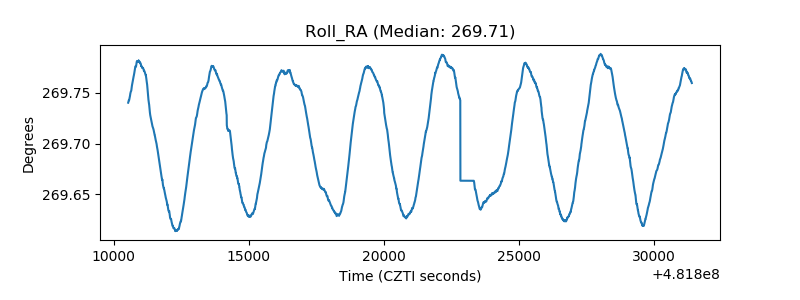 |
| Veto Counter | 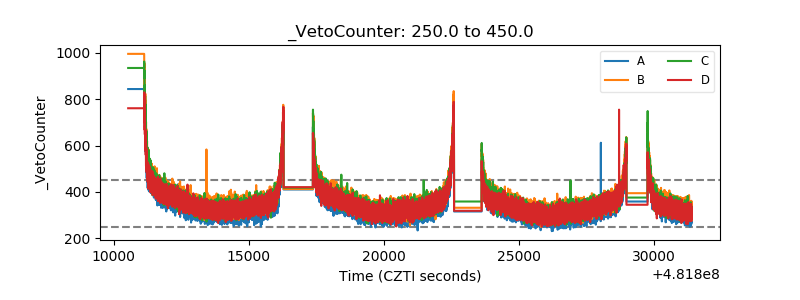 |