| Param | Original file | Final file |
|---|---|---|
| Filename | modeM0/AS1A13_090T01_9000006458_51542cztM0_level2.fits | modeM0/AS1A13_090T01_9000006458_51542cztM0_level2_quad_clean.evt |
| Size (bytes) | 859,723,200 | 89,821,440 |
| Size | 819.9 MB | 85.7 MB |
| Events in quadrant A | 5,148,086 | 681,942 |
| Events in quadrant B | 6,034,783 | 682,126 |
| Events in quadrant C | 4,135,233 | 654,081 |
| Events in quadrant D | 15,934,770 | 188,312 |
| Mode M0 | |||
|---|---|---|---|
| Quadrant | BADHDUFLAG | Total packets | Discarded packets |
| A | 0 | 20468 | 2 |
| B | 0 | 23053 | 3 |
| C | 0 | 17551 | 2 |
| D | 0 | 52449 | 2 |
| Mode M9 | |||
|---|---|---|---|
| Quadrant | BADHDUFLAG | Total packets | Discarded packets |
| A | 0 | 1 | 0 |
| B | 0 | 1 | 0 |
| C | 0 | 1 | 0 |
| D | 0 | 1 | 0 |
| Mode SS | |||
|---|---|---|---|
| Quadrant | BADHDUFLAG | Total packets | Discarded packets |
| A | 0 | 150 | 0 |
| B | 0 | 150 | 0 |
| C | 0 | 150 | 0 |
| D | 0 | 150 | 0 |
| Quadrant | Total seconds | Saturated seconds | Saturation percentage |
|---|---|---|---|
| A | 7369 | 312 | 4.233953% |
| B | 7368 | 858 | 11.644951% |
| C | 7368 | 263 | 3.569490% |
| D | 7368 | 5378 | 72.991314% |
Noise dominated data is calculated using 1-second bins in cleaned event files. If a bin has >2000 counts, and if more than 50% of those come from <1% of pixels, then it is considered to be noise-dominated and hence unusable.
| Quadrant | # 1 sec bins | Bins with >0 counts | Bins with >2000 counts | High rate bins dominated by noise | Noise dominated (total time) | Noise dominated (detector-on time) | Marked lightcurve |
|---|---|---|---|---|---|---|---|
| A | 7499 | 7371 | 128 | 128 | 1.71% | 1.74% | 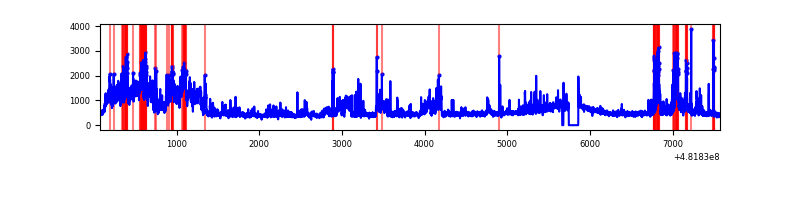 |
| B | 7497 | 7369 | 496 | 496 | 6.62% | 6.73% | 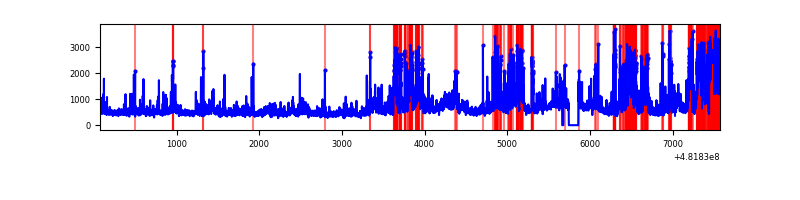 |
| C | 7498 | 7370 | 142 | 142 | 1.89% | 1.93% | 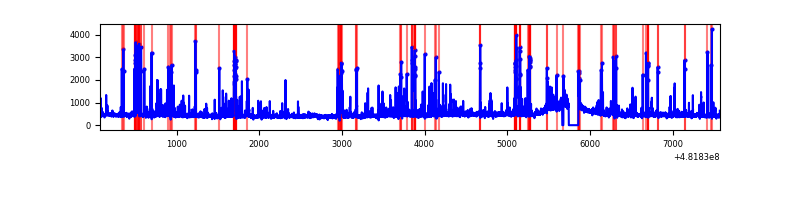 |
| D | 7498 | 7368 | 5036 | 5036 | 67.16% | 68.35% |  |
Top three noisy pixels from each quadrant. If the there are fewer than three noisy pixels in the level2.evt file, extra rows are filled as -1
| Pixel properties | Quadrant properties | ||||||
|---|---|---|---|---|---|---|---|
| Quadrant | DetID | PixID | Counts | Sigma | Mean | Median | Sigma |
| A | 12 | 3 | 904595 | 4565.37 | 807 | 786 | 198.0 |
| A | 12 | 250 | 336922 | 1697.91 | 807 | 786 | 198.0 |
| A | 4 | 175 | 155580 | 781.9 | 807 | 786 | 198.0 |
| B | 10 | 44 | 1817143 | 10763.63 | 777 | 750 | 168.8 |
| B | 15 | 52 | 328131 | 1940.0 | 777 | 750 | 168.8 |
| B | 7 | 252 | 128449 | 756.72 | 777 | 750 | 168.8 |
| C | 13 | 3 | 435148 | 2037.17 | 781 | 775 | 213.2 |
| C | 14 | 224 | 158743 | 740.86 | 781 | 775 | 213.2 |
| C | 3 | 233 | 99247 | 461.82 | 781 | 775 | 213.2 |
| D | 8 | 176 | 13498886 | 115287.11 | 416 | 400 | 117.1 |
| D | 12 | 6 | 363409 | 3100.36 | 416 | 400 | 117.1 |
| D | 8 | 160 | 75671 | 642.87 | 416 | 400 | 117.1 |
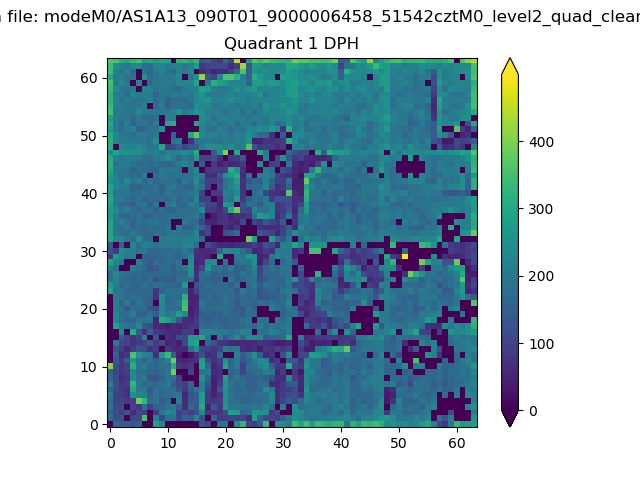
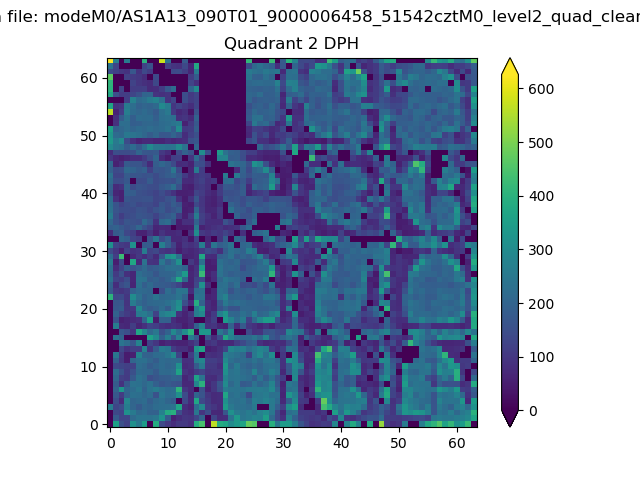
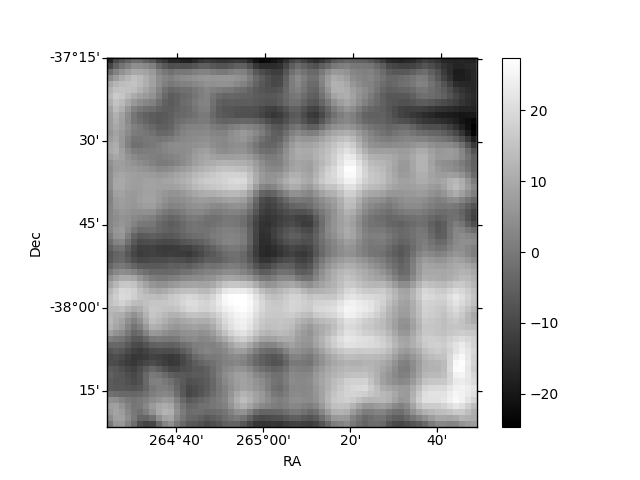
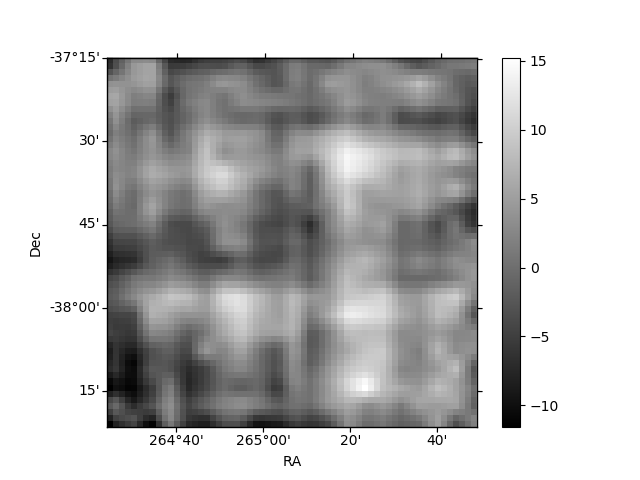
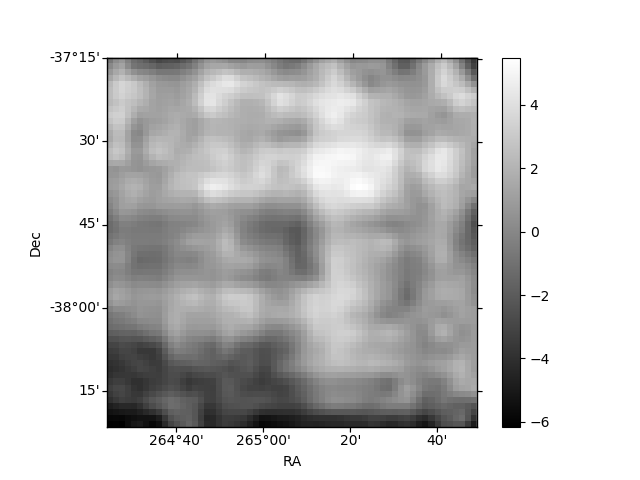
Histogram calculated using DETX and DETY for each event in the final _common_clean file
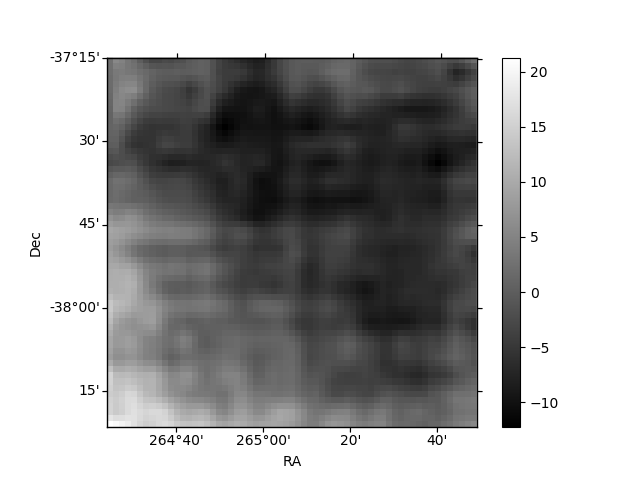
| Quadrant A | 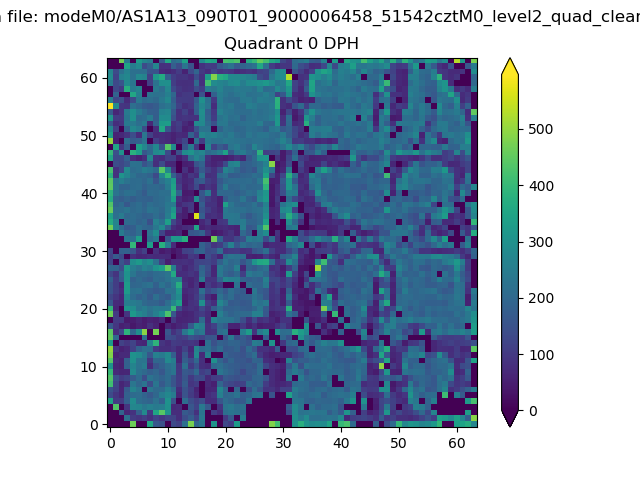 |
 |
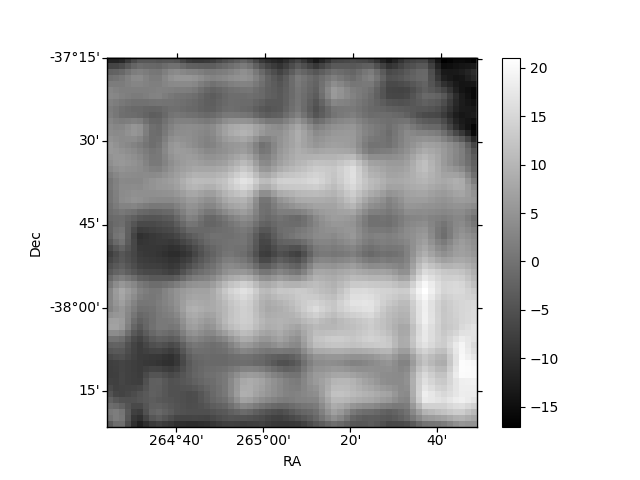
Quadrant B |
|---|---|---|---|
| Quadrant D | 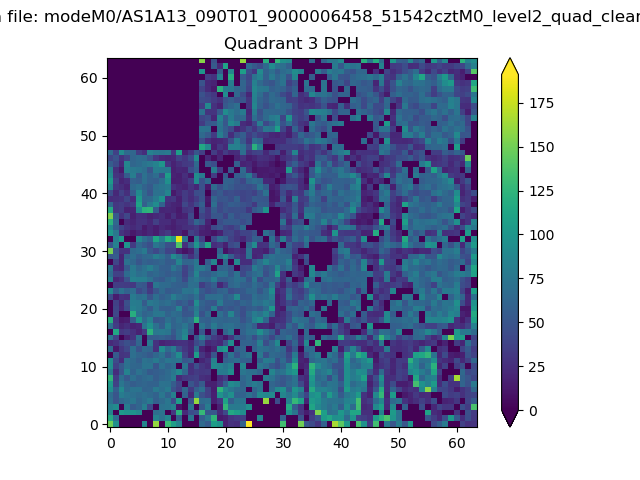 |
 |
Quadrant C |
| Plot type | Count rate plots | Images |
|---|---|---|
| Comparison with Poisson distribution Blue bars denote a histogram of data divided into 1 sec bins. Red curve is a Poisson curve with rate = median count rate of data. |
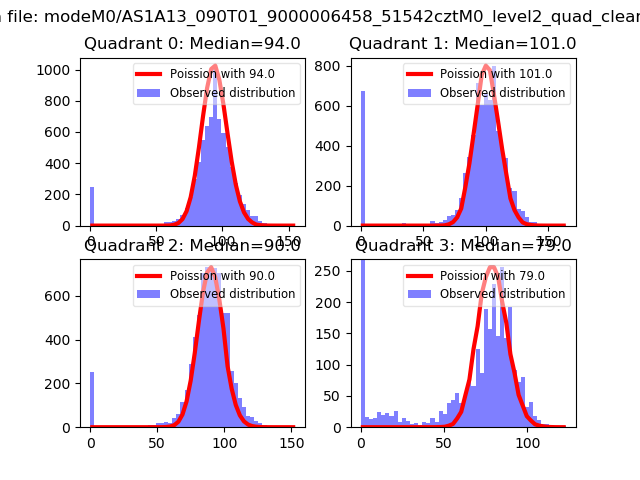 |
 |
| Quadrant-wise count rates Data is divided into 100 sec bins |
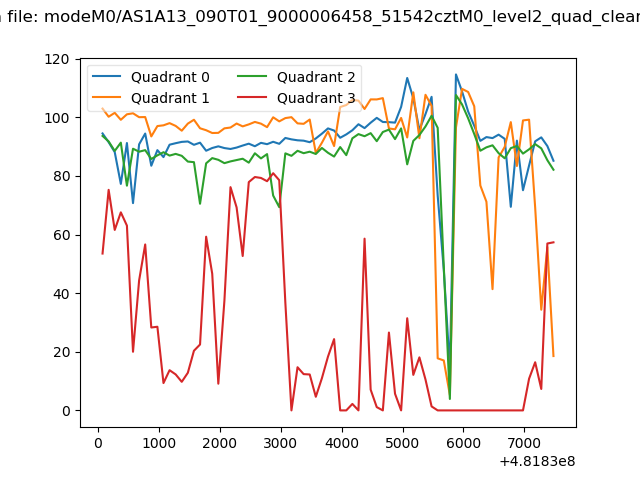 |
|
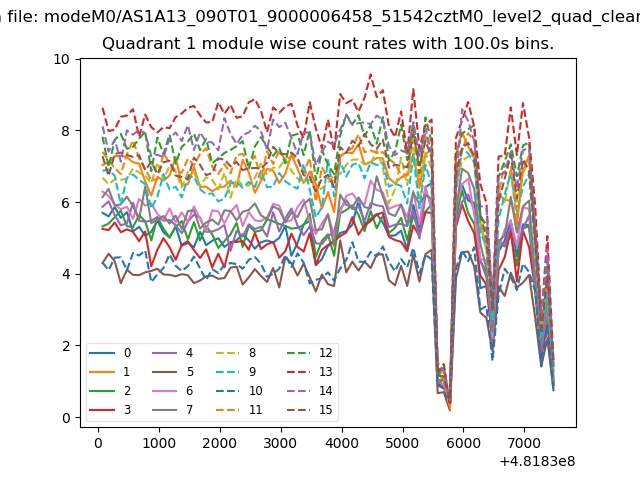
| Module-wise count rates for Quadrant A Data is divided into 100 sec bins |
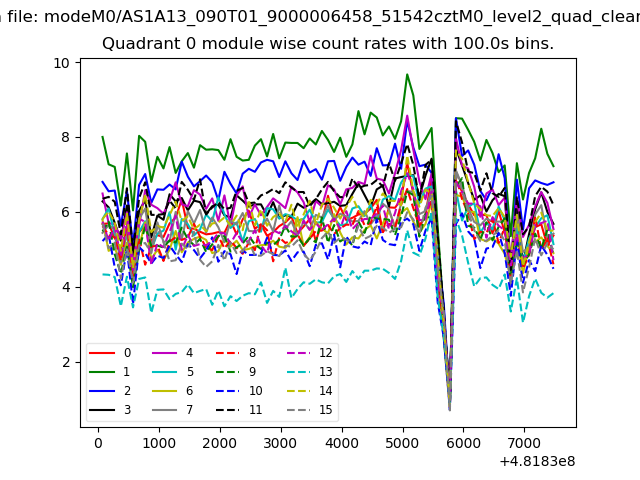 |
 |
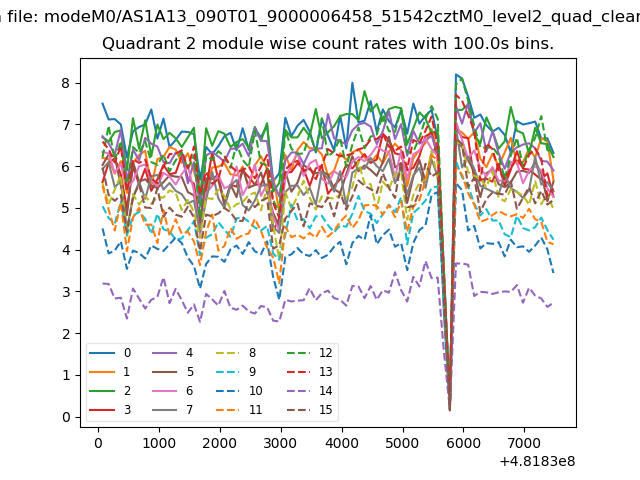
| Module-wise count rates for Quadrant B Data is divided into 100 sec bins |
 |
 |
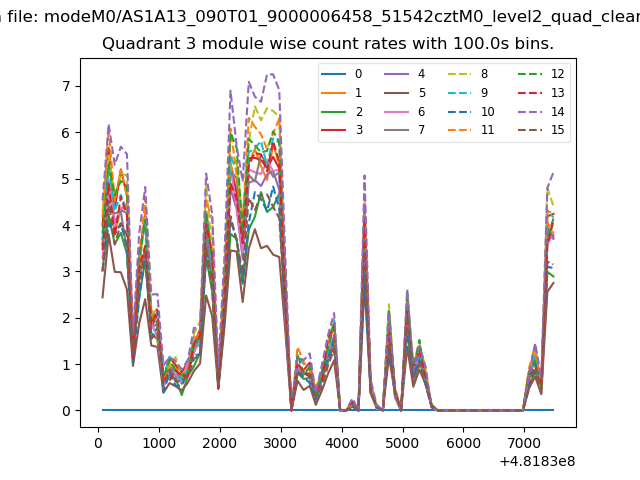
| Module-wise count rates for Quadrant C Data is divided into 100 sec bins |
 |
 |
| Module-wise count rates for Quadrant D Data is divided into 100 sec bins |
 |
 |
| Parameter | Plot |
|---|---|
| CZT HV Monitor | 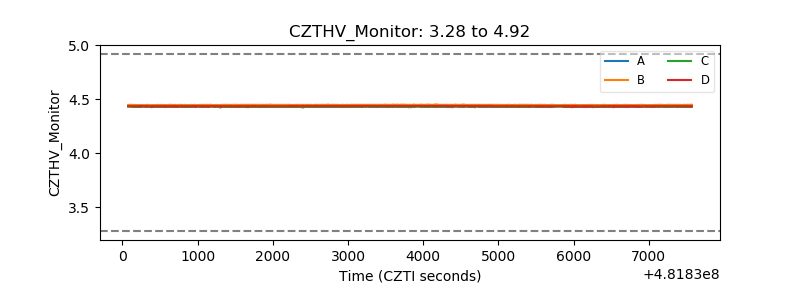 |
| D_VDD | 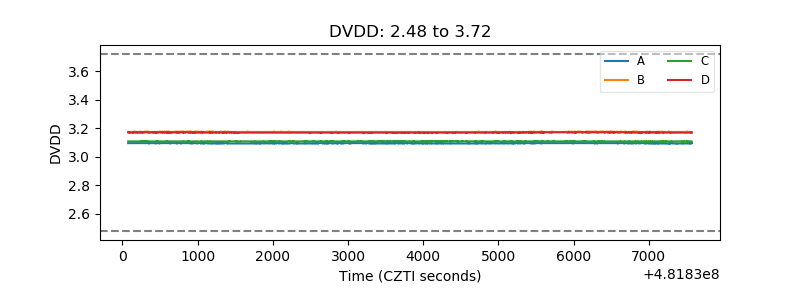 |
| Temperature 1 | 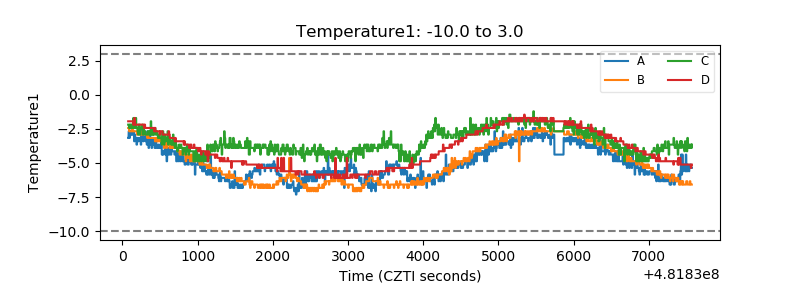 |
| Veto HV Monitor | 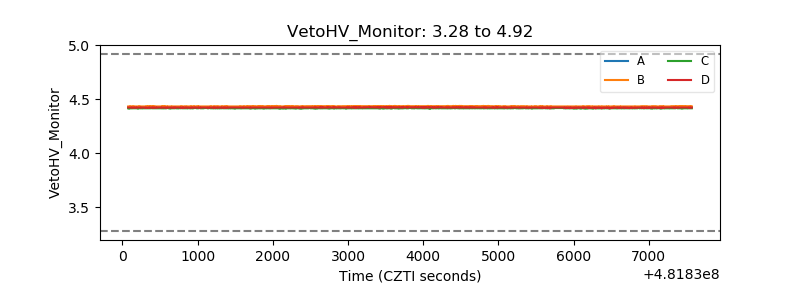 |
| Veto LLD |  |
| Alpha Counter | 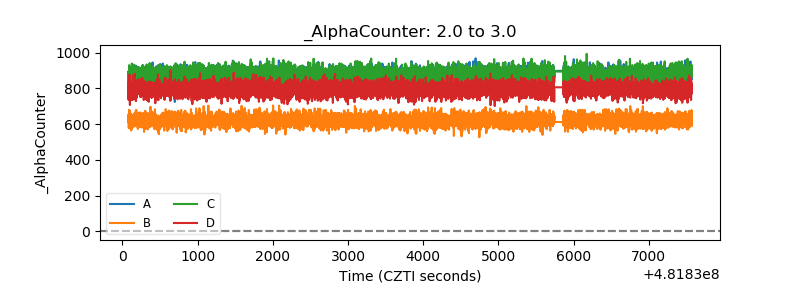 |
| _CPM_Rate | 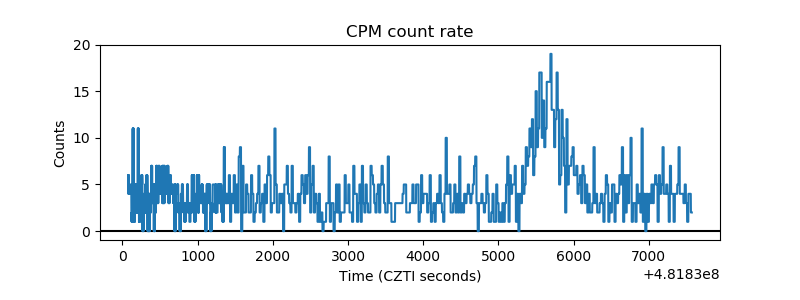 |
| CZT Counter | 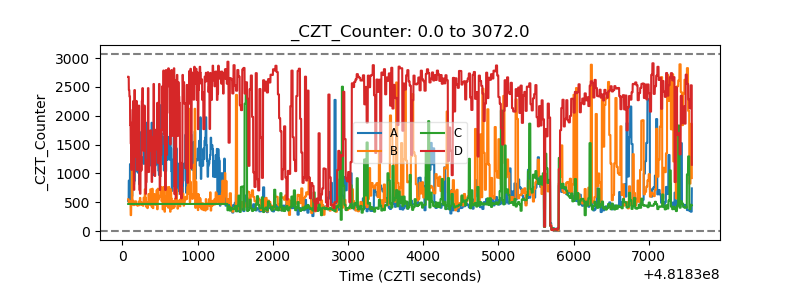 |
| +2.5 Volts monitor | 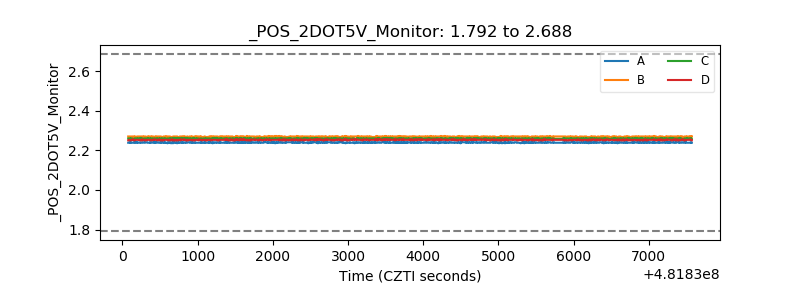 |
| +5 Volts monitor | 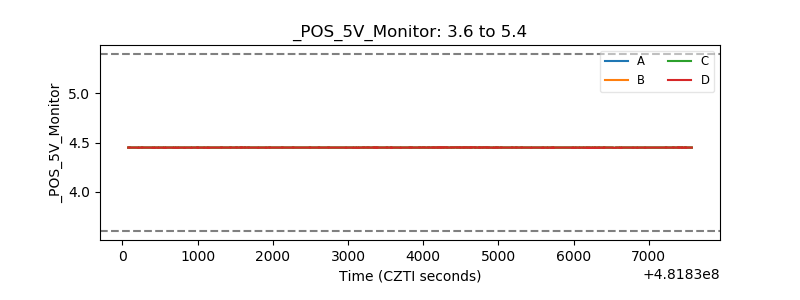 |
| _ROLL_ROT | 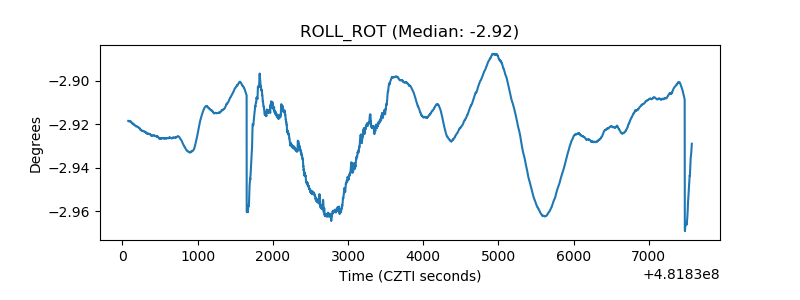 |
| _Roll_DEC | 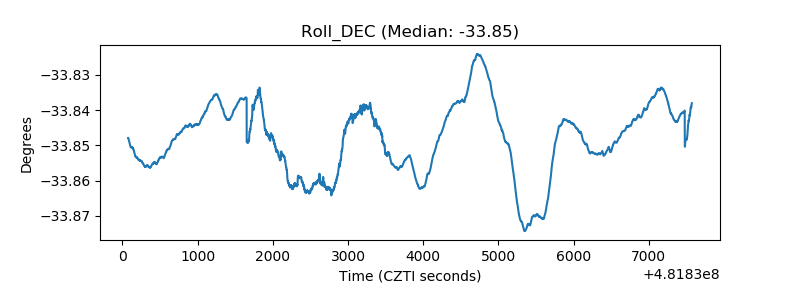 |
| _Roll_RA | 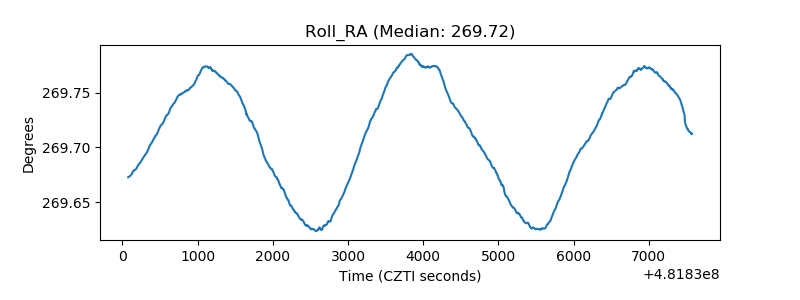 |
| Veto Counter | 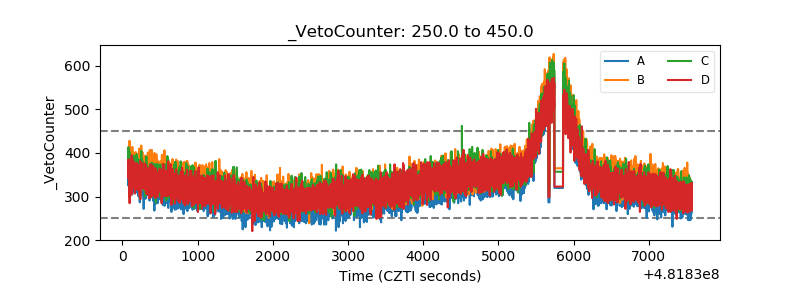 |