| Param | Original file | Final file |
|---|---|---|
| Filename | modeM0/AS1A13_090T01_9000006458_51543cztM0_level2.fits | modeM0/AS1A13_090T01_9000006458_51543cztM0_level2_quad_clean.evt |
| Size (bytes) | 976,279,680 | 88,701,120 |
| Size | 931.1 MB | 84.6 MB |
| Events in quadrant A | 7,004,206 | 629,119 |
| Events in quadrant B | 10,856,002 | 536,919 |
| Events in quadrant C | 3,927,683 | 674,482 |
| Events in quadrant D | 13,764,836 | 317,636 |
| Mode M0 | |||
|---|---|---|---|
| Quadrant | BADHDUFLAG | Total packets | Discarded packets |
| A | 0 | 26134 | 0 |
| B | 0 | 37456 | 0 |
| C | 0 | 17148 | 1 |
| D | 0 | 46140 | 0 |
| Mode SS | |||
|---|---|---|---|
| Quadrant | BADHDUFLAG | Total packets | Discarded packets |
| A | 0 | 152 | 0 |
| B | 0 | 152 | 0 |
| C | 0 | 152 | 0 |
| D | 0 | 152 | 0 |
| Quadrant | Total seconds | Saturated seconds | Saturation percentage |
|---|---|---|---|
| A | 7577 | 1039 | 13.712551% |
| B | 7577 | 2576 | 33.997624% |
| C | 7576 | 146 | 1.927138% |
| D | 7576 | 4032 | 53.220697% |
Noise dominated data is calculated using 1-second bins in cleaned event files. If a bin has >2000 counts, and if more than 50% of those come from <1% of pixels, then it is considered to be noise-dominated and hence unusable.
| Quadrant | # 1 sec bins | Bins with >0 counts | Bins with >2000 counts | High rate bins dominated by noise | Noise dominated (total time) | Noise dominated (detector-on time) | Marked lightcurve |
|---|---|---|---|---|---|---|---|
| A | 7577 | 7577 | 717 | 717 | 9.46% | 9.46% | 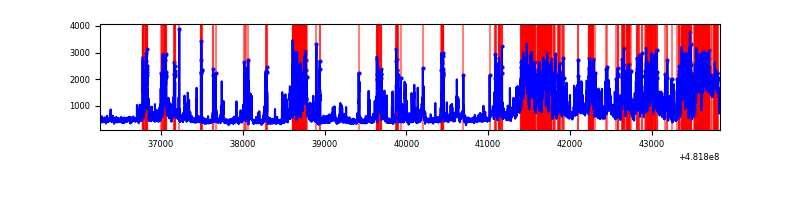 |
| B | 7577 | 7577 | 2161 | 2161 | 28.52% | 28.52% | 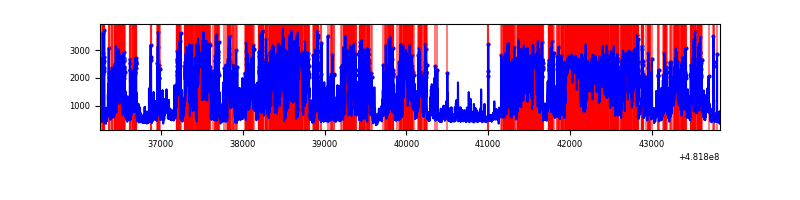 |
| C | 7576 | 7576 | 133 | 133 | 1.76% | 1.76% | 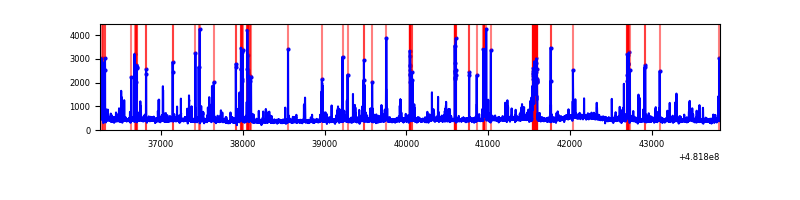 |
| D | 7576 | 7576 | 3874 | 3874 | 51.14% | 51.14% | 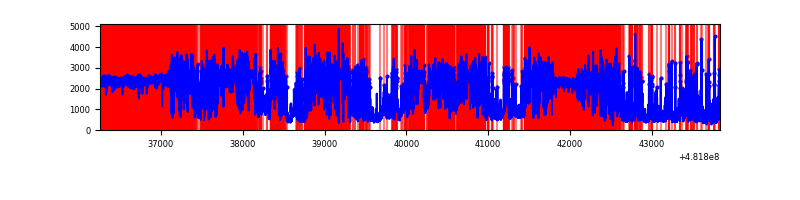 |
Top three noisy pixels from each quadrant. If the there are fewer than three noisy pixels in the level2.evt file, extra rows are filled as -1
| Pixel properties | Quadrant properties | ||||||
|---|---|---|---|---|---|---|---|
| Quadrant | DetID | PixID | Counts | Sigma | Mean | Median | Sigma |
| A | 12 | 250 | 2538530 | 13311.45 | 777 | 759 | 190.6 |
| A | 12 | 80 | 354083 | 1853.3 | 777 | 759 | 190.6 |
| A | 12 | 17 | 287507 | 1504.09 | 777 | 759 | 190.6 |
| B | 10 | 44 | 7082737 | 47524.62 | 688 | 664 | 149.0 |
| B | 15 | 52 | 477933 | 3202.74 | 688 | 664 | 149.0 |
| B | 0 | 171 | 79766 | 530.82 | 688 | 664 | 149.0 |
| C | 13 | 3 | 406817 | 1878.87 | 784 | 776 | 216.1 |
| C | 0 | 129 | 114344 | 525.51 | 784 | 776 | 216.1 |
| C | 10 | 19 | 68128 | 311.66 | 784 | 776 | 216.1 |
| D | 8 | 176 | 11002096 | 77072.97 | 509 | 491 | 142.7 |
| D | 12 | 6 | 209093 | 1461.38 | 509 | 491 | 142.7 |
| D | 2 | 249 | 99966 | 696.88 | 509 | 491 | 142.7 |
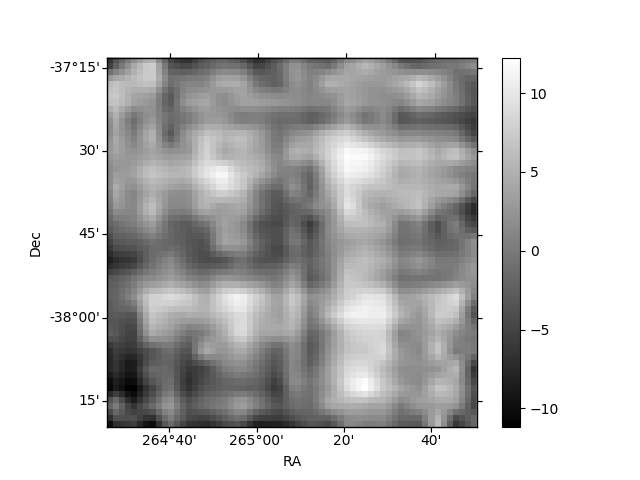
Histogram calculated using DETX and DETY for each event in the final _common_clean file
| Quadrant A | 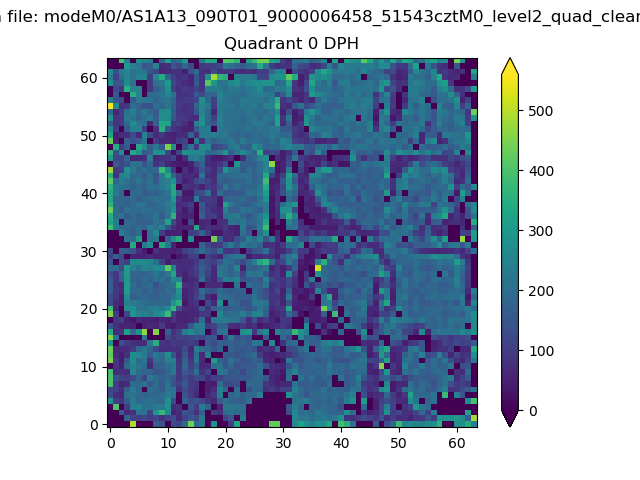 |
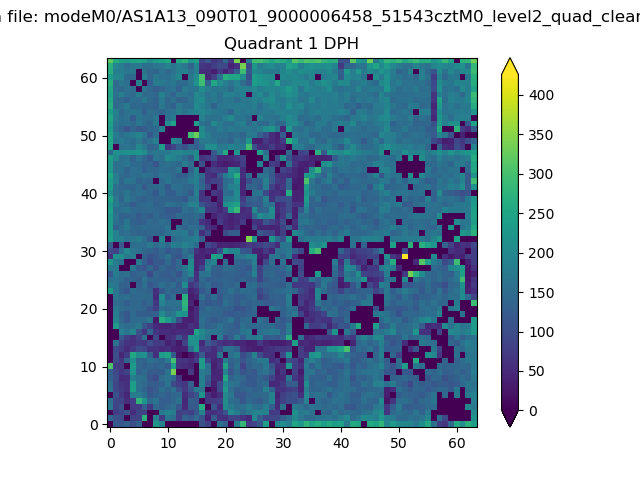 |
Quadrant B |
|---|---|---|---|
| Quadrant D | 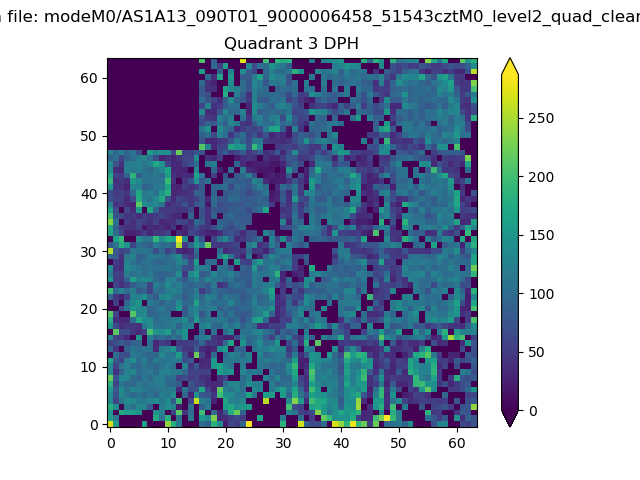 |
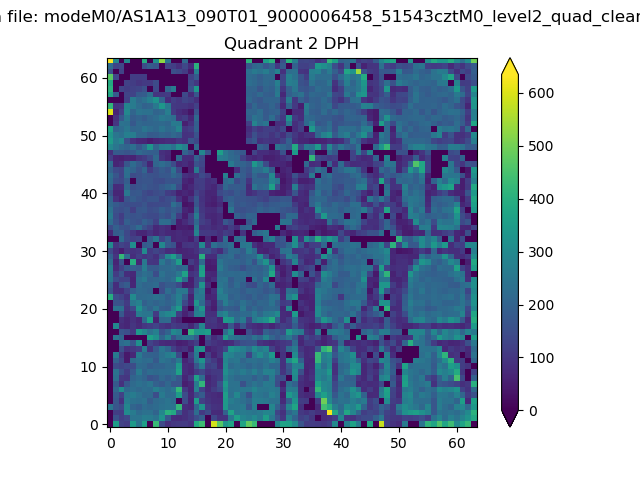 |
Quadrant C |
| Plot type | Count rate plots | Images |
|---|---|---|
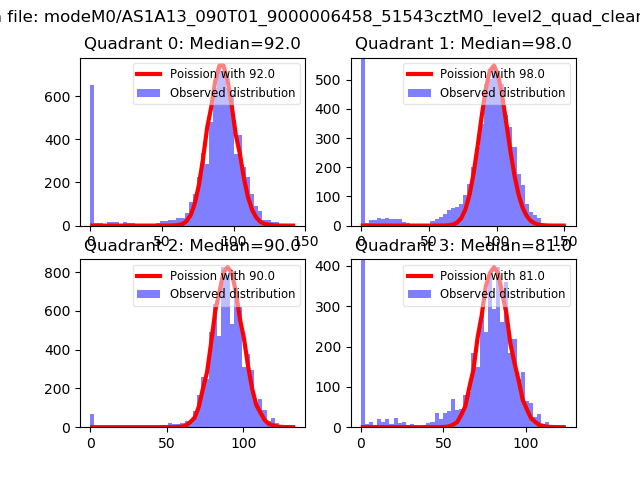
| Comparison with Poisson distribution Blue bars denote a histogram of data divided into 1 sec bins. Red curve is a Poisson curve with rate = median count rate of data. |
 |
 |
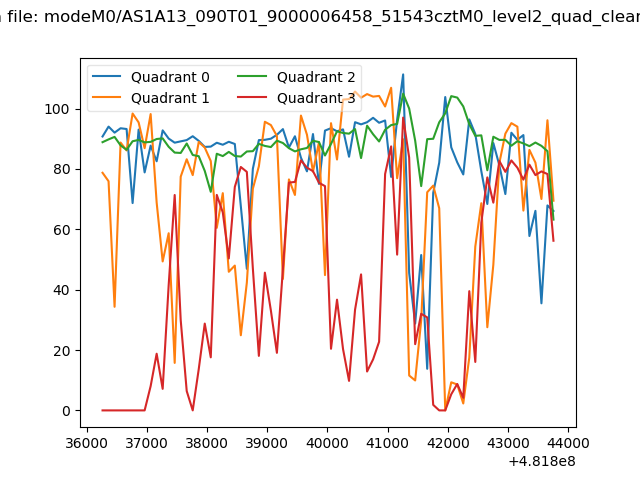
| Quadrant-wise count rates Data is divided into 100 sec bins |
 |
|
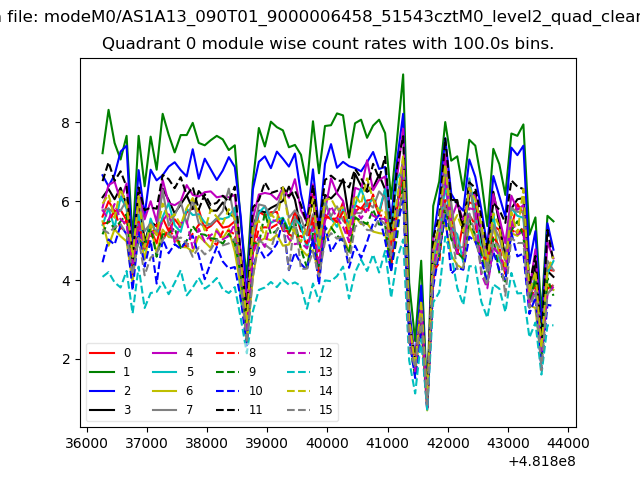
| Module-wise count rates for Quadrant A Data is divided into 100 sec bins |
 |
 |
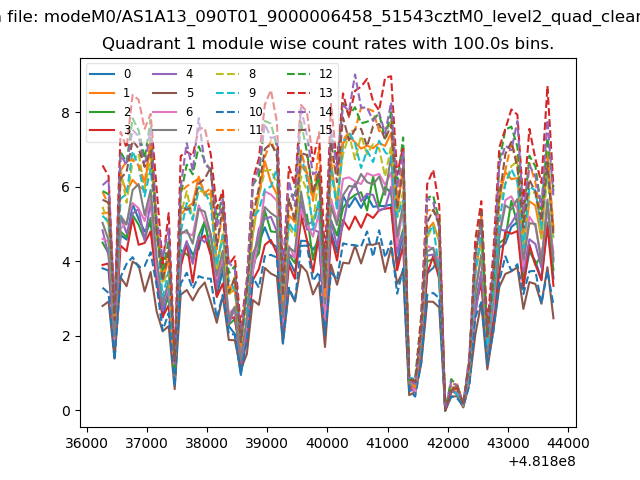
| Module-wise count rates for Quadrant B Data is divided into 100 sec bins |
 |
 |
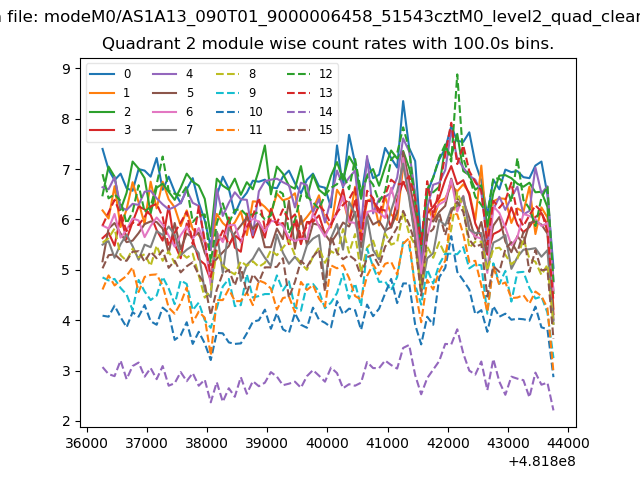
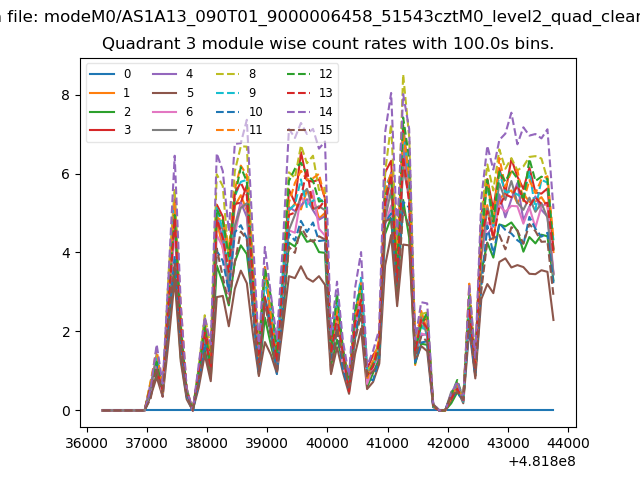
| Module-wise count rates for Quadrant C Data is divided into 100 sec bins |
 |
 |
| Module-wise count rates for Quadrant D Data is divided into 100 sec bins |
 |
 |
| Parameter | Plot |
|---|---|
| CZT HV Monitor | 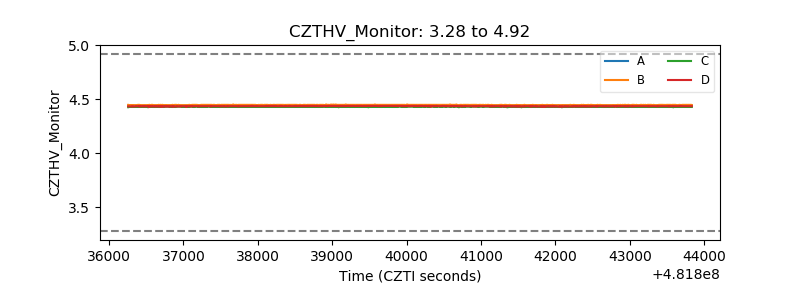 |
| D_VDD | 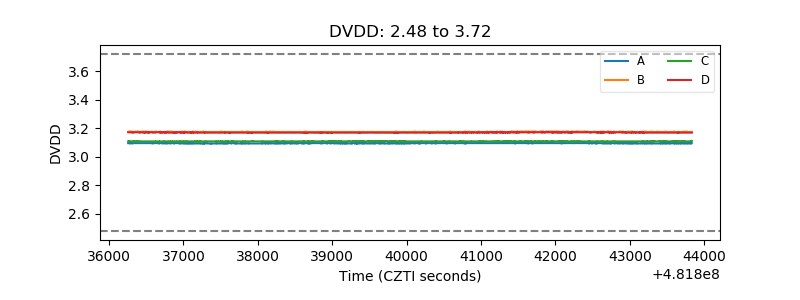 |
| Temperature 1 | 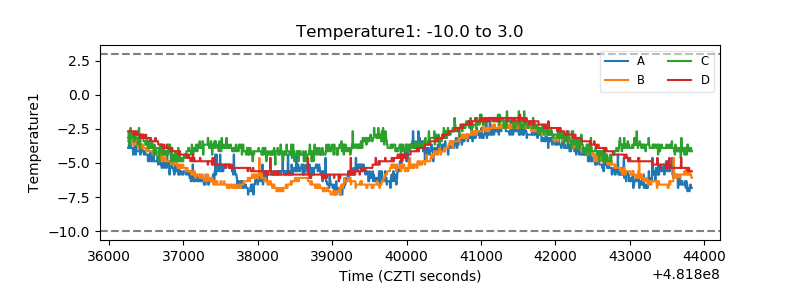 |
| Veto HV Monitor |  |
| Veto LLD | 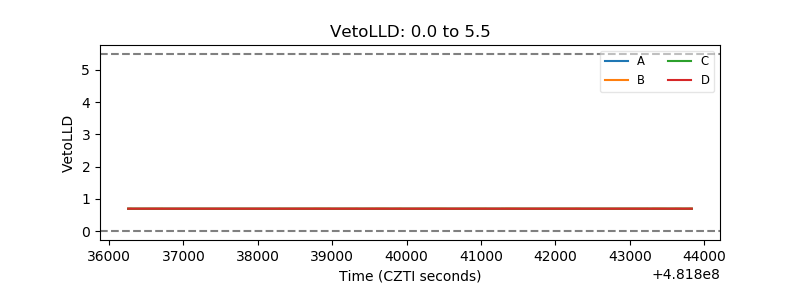 |
| Alpha Counter | 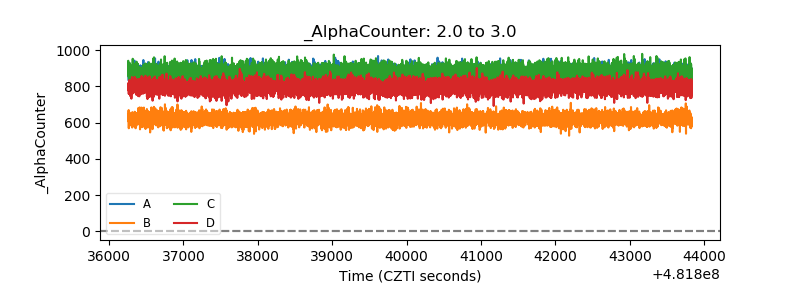 |
| _CPM_Rate | 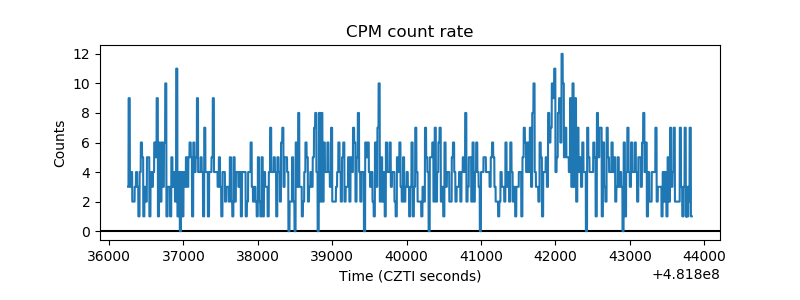 |
| CZT Counter | 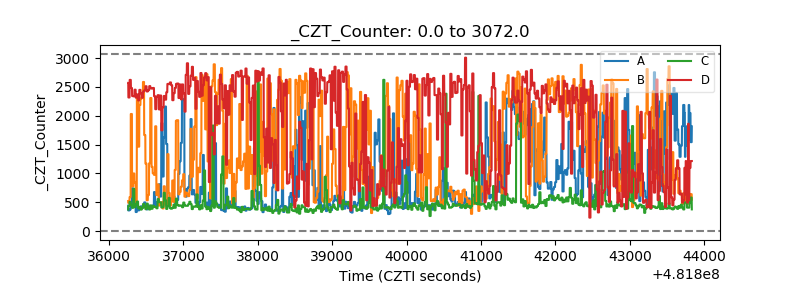 |
| +2.5 Volts monitor | 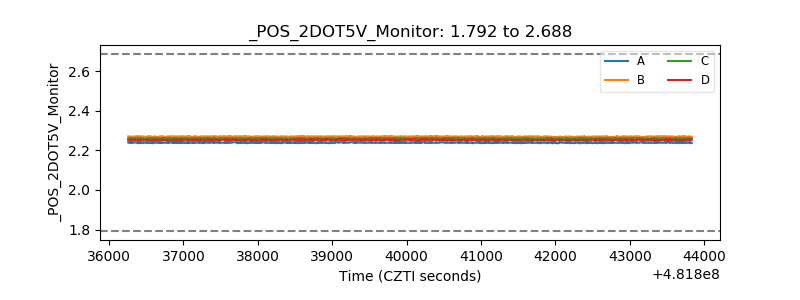 |
| +5 Volts monitor | 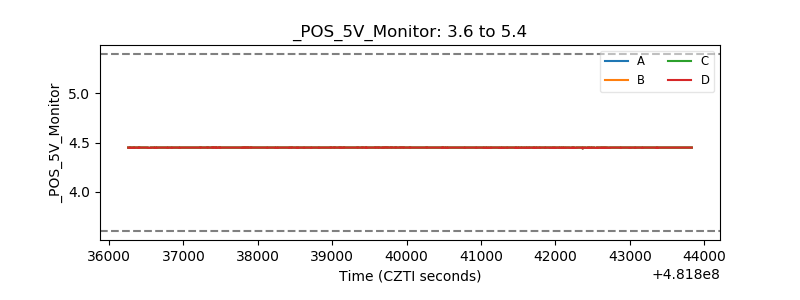 |
| _ROLL_ROT | 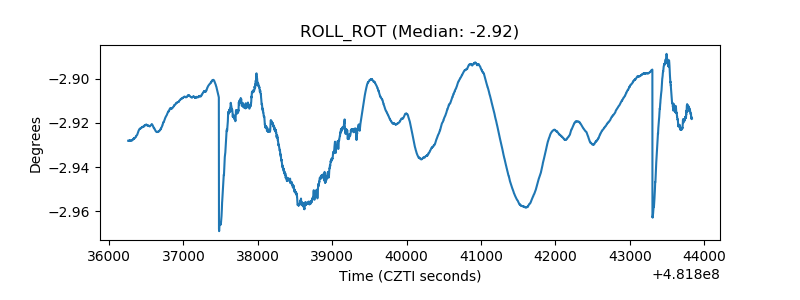 |
| _Roll_DEC | 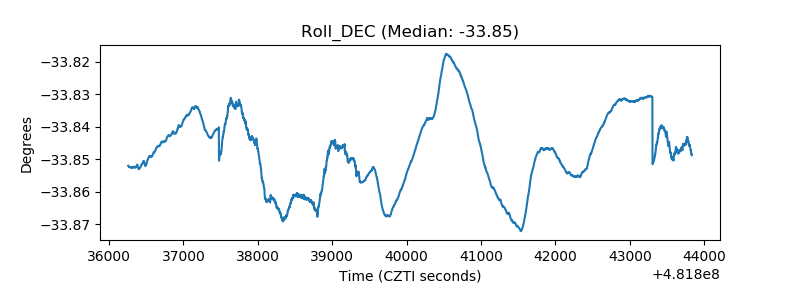 |
| _Roll_RA | 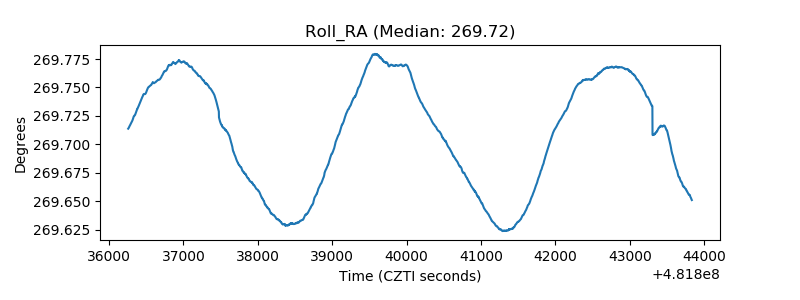 |
| Veto Counter | 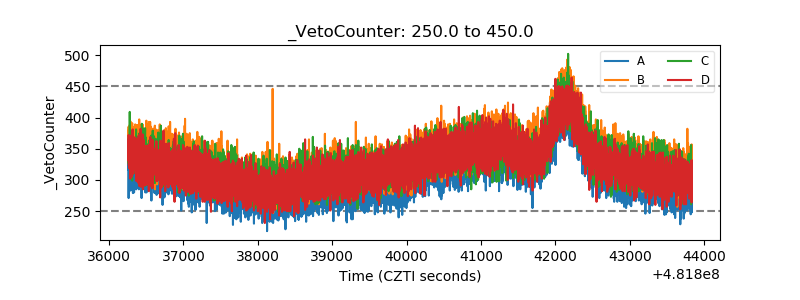 |