| Param | Original file | Final file |
|---|---|---|
| Filename | modeM0/AS1A13_090T01_9000006458_51544cztM0_level2.fits | modeM0/AS1A13_090T01_9000006458_51544cztM0_level2_quad_clean.evt |
| Size (bytes) | 870,180,480 | 104,690,880 |
| Size | 829.9 MB | 99.8 MB |
| Events in quadrant A | 8,486,804 | 704,352 |
| Events in quadrant B | 11,865,351 | 567,247 |
| Events in quadrant C | 4,073,560 | 728,068 |
| Events in quadrant D | 7,163,338 | 610,024 |
| Mode M0 | |||
|---|---|---|---|
| Quadrant | BADHDUFLAG | Total packets | Discarded packets |
| A | 0 | 30905 | 0 |
| B | 0 | 40878 | 3 |
| C | 0 | 17872 | 0 |
| D | 0 | 26968 | 0 |
| Mode SS | |||
|---|---|---|---|
| Quadrant | BADHDUFLAG | Total packets | Discarded packets |
| A | 0 | 162 | 0 |
| B | 0 | 162 | 0 |
| C | 0 | 162 | 0 |
| D | 0 | 162 | 0 |
| Quadrant | Total seconds | Saturated seconds | Saturation percentage |
|---|---|---|---|
| A | 8050 | 838 | 10.409938% |
| B | 8049 | 2883 | 35.818114% |
| C | 8049 | 83 | 1.031184% |
| D | 8050 | 1006 | 12.496894% |
Noise dominated data is calculated using 1-second bins in cleaned event files. If a bin has >2000 counts, and if more than 50% of those come from <1% of pixels, then it is considered to be noise-dominated and hence unusable.
| Quadrant | # 1 sec bins | Bins with >0 counts | Bins with >2000 counts | High rate bins dominated by noise | Noise dominated (total time) | Noise dominated (detector-on time) | Marked lightcurve |
|---|---|---|---|---|---|---|---|
| A | 8050 | 8050 | 627 | 627 | 7.79% | 7.79% | 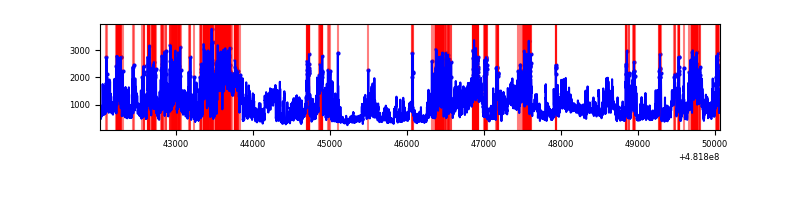 |
| B | 8049 | 8049 | 2330 | 2330 | 28.95% | 28.95% | 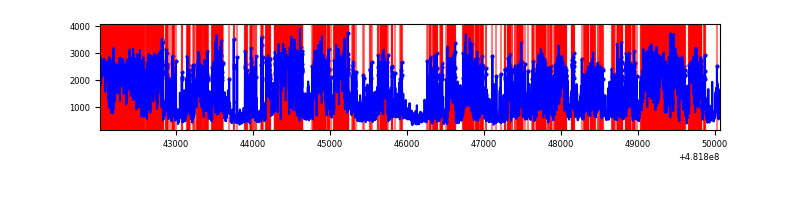 |
| C | 8049 | 8049 | 68 | 68 | 0.84% | 0.84% | 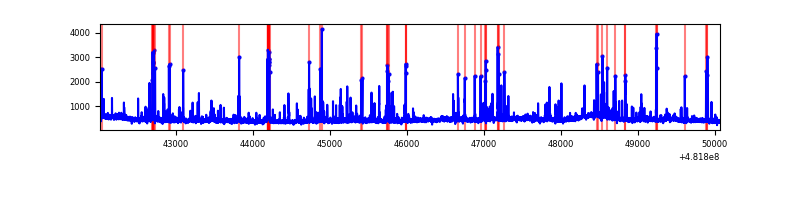 |
| D | 8050 | 8050 | 911 | 911 | 11.32% | 11.32% | 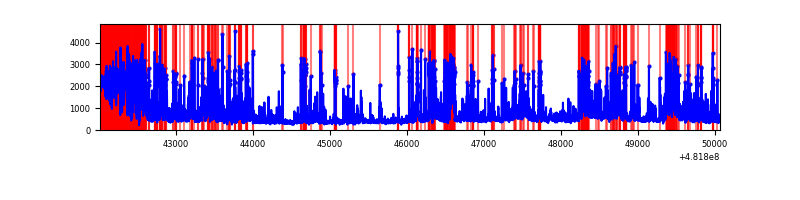 |
Top three noisy pixels from each quadrant. If the there are fewer than three noisy pixels in the level2.evt file, extra rows are filled as -1
| Pixel properties | Quadrant properties | ||||||
|---|---|---|---|---|---|---|---|
| Quadrant | DetID | PixID | Counts | Sigma | Mean | Median | Sigma |
| A | 12 | 250 | 1587060 | 7589.48 | 848 | 827 | 209.0 |
| A | 12 | 80 | 1519564 | 7266.54 | 848 | 827 | 209.0 |
| A | 12 | 3 | 662212 | 3164.46 | 848 | 827 | 209.0 |
| B | 10 | 44 | 7484360 | 46006.71 | 753 | 728 | 162.7 |
| B | 15 | 52 | 588942 | 3616.13 | 753 | 728 | 162.7 |
| B | 6 | 51 | 153627 | 939.97 | 753 | 728 | 162.7 |
| C | 13 | 3 | 381363 | 1634.12 | 852 | 844 | 232.9 |
| C | 3 | 233 | 109815 | 467.97 | 852 | 844 | 232.9 |
| C | 12 | 249 | 41672 | 175.33 | 852 | 844 | 232.9 |
| D | 8 | 176 | 2748585 | 12586.25 | 780 | 753 | 218.3 |
| D | 12 | 6 | 519108 | 2374.29 | 780 | 753 | 218.3 |
| D | 2 | 249 | 223297 | 1019.35 | 780 | 753 | 218.3 |
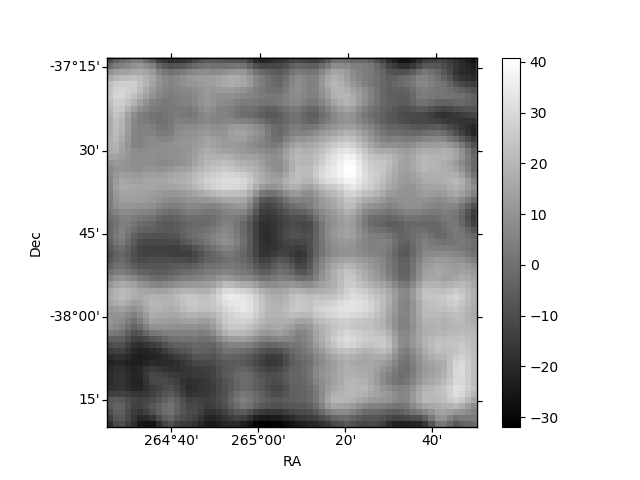
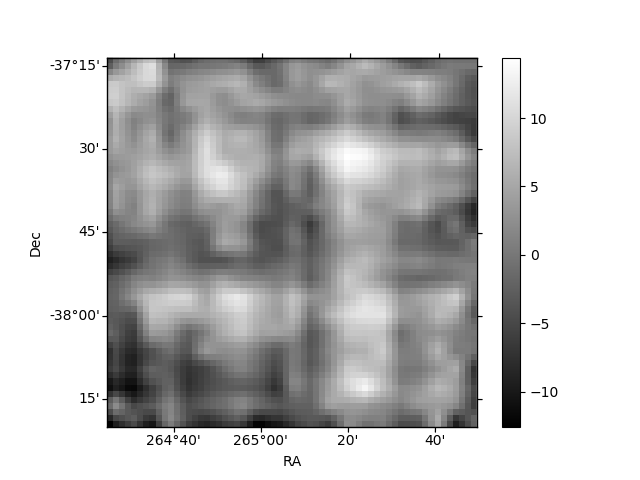
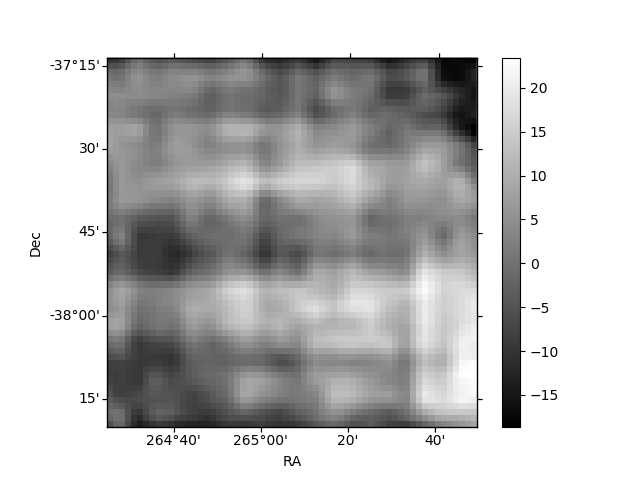
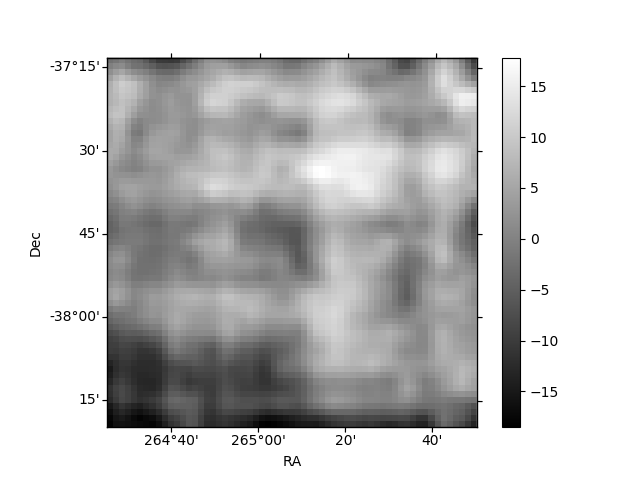
Histogram calculated using DETX and DETY for each event in the final _common_clean file
| Quadrant A | 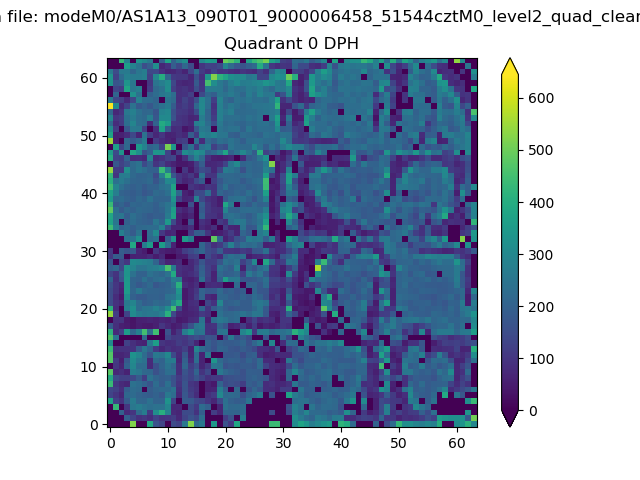 |
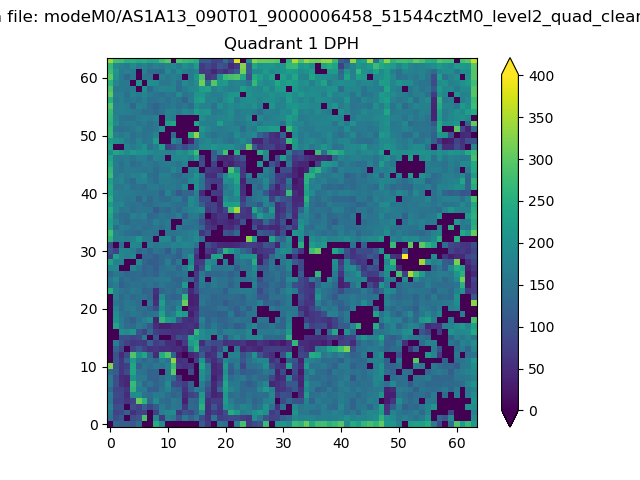 |
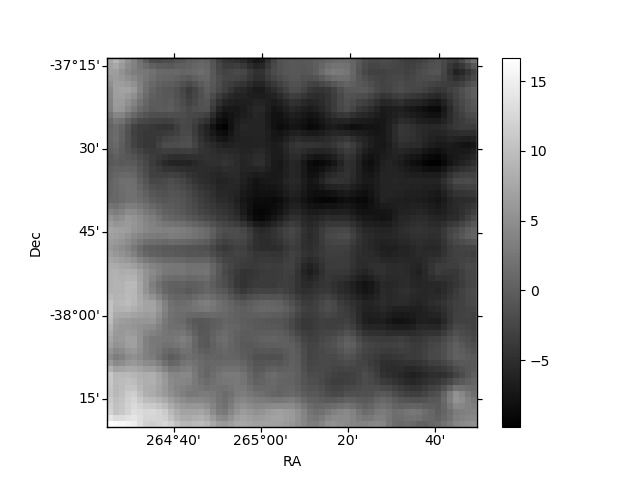
Quadrant B |
|---|---|---|---|
| Quadrant D | 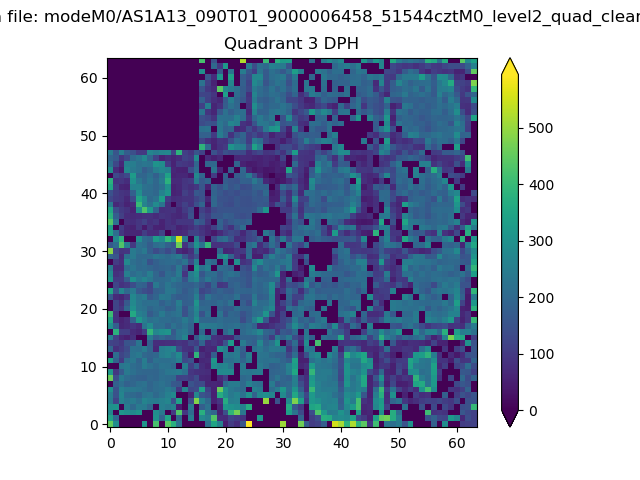 |
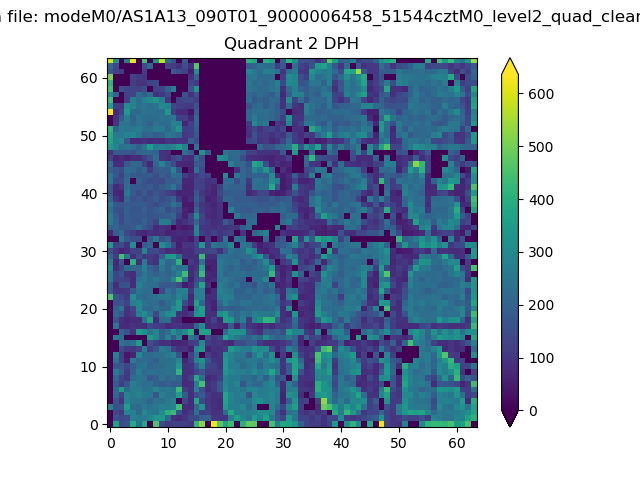 |
Quadrant C |
| Plot type | Count rate plots | Images |
|---|---|---|
| Comparison with Poisson distribution Blue bars denote a histogram of data divided into 1 sec bins. Red curve is a Poisson curve with rate = median count rate of data. |
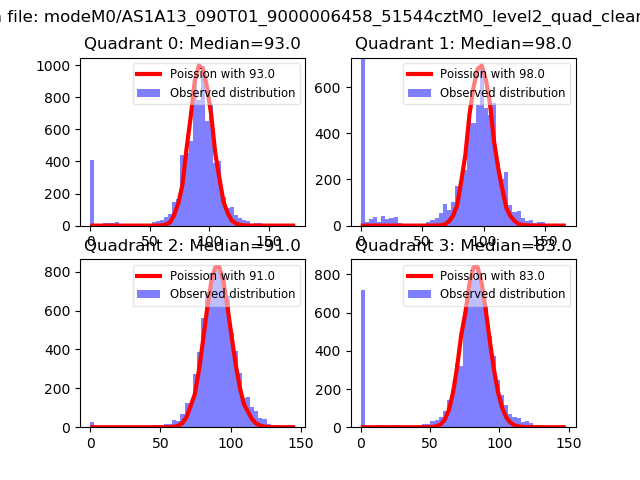 |
 |
| Quadrant-wise count rates Data is divided into 100 sec bins |
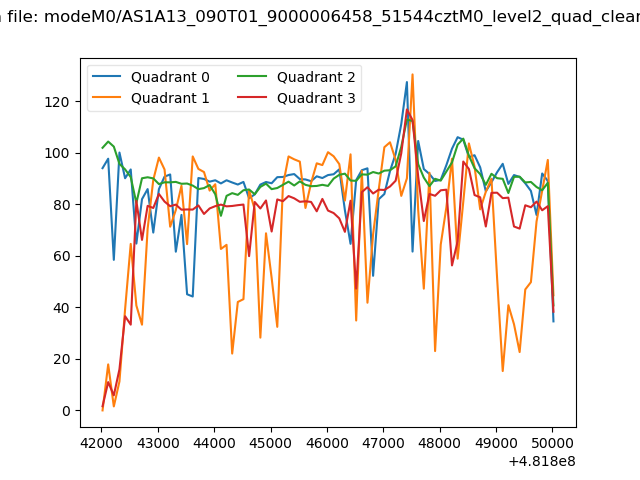 |
|
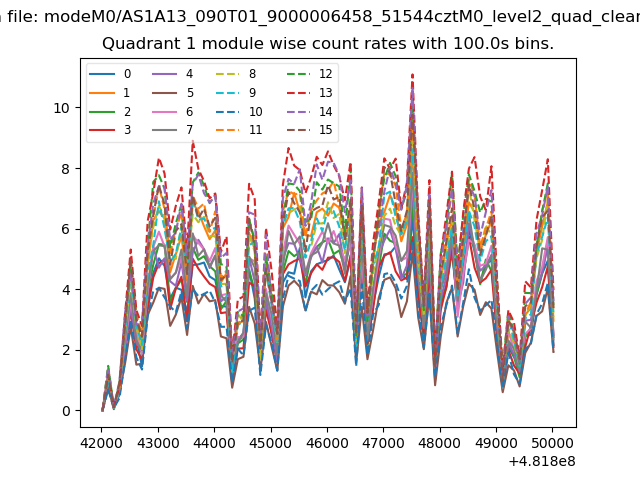
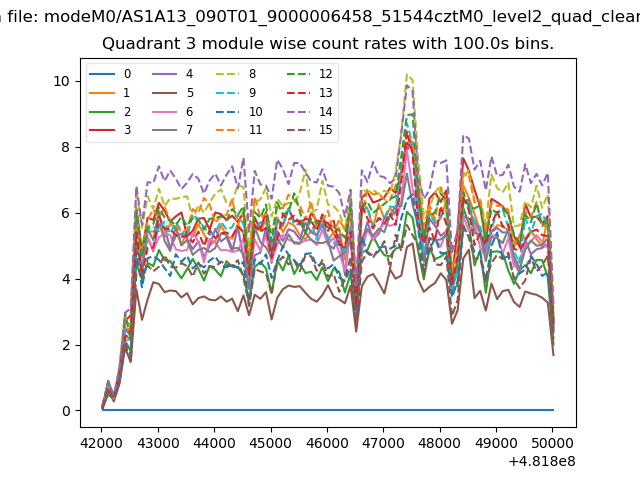
| Module-wise count rates for Quadrant A Data is divided into 100 sec bins |
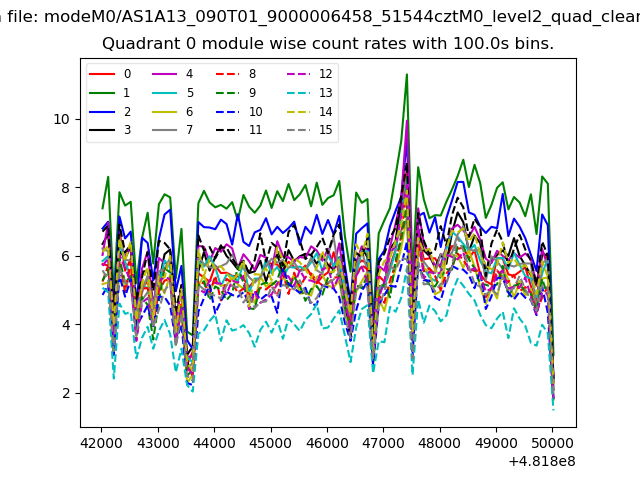 |
 |
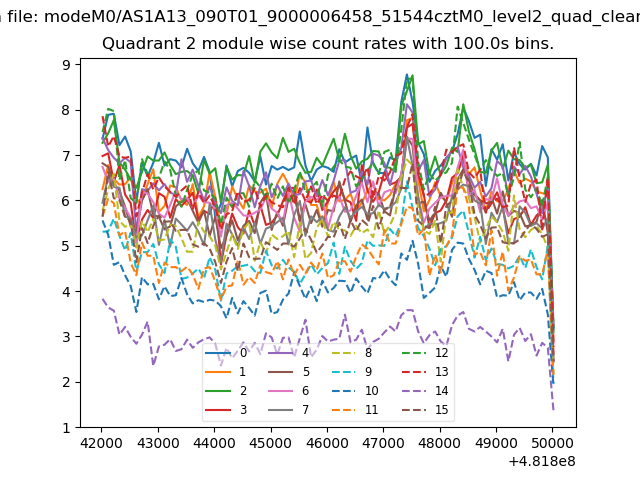
| Module-wise count rates for Quadrant B Data is divided into 100 sec bins |
 |
 |
| Module-wise count rates for Quadrant C Data is divided into 100 sec bins |
 |
 |
| Module-wise count rates for Quadrant D Data is divided into 100 sec bins |
 |
 |
| Parameter | Plot |
|---|---|
| CZT HV Monitor | 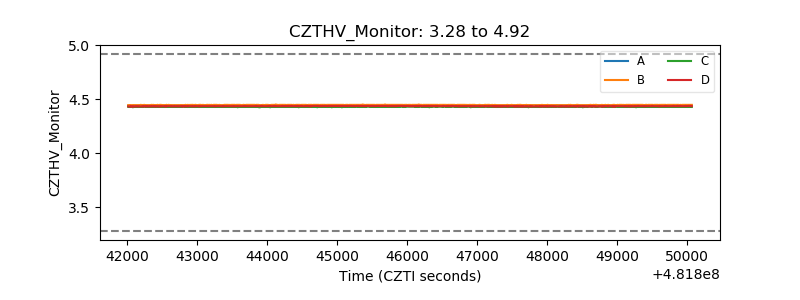 |
| D_VDD | 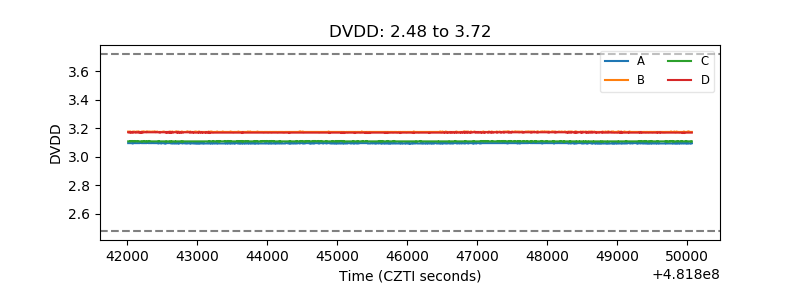 |
| Temperature 1 | 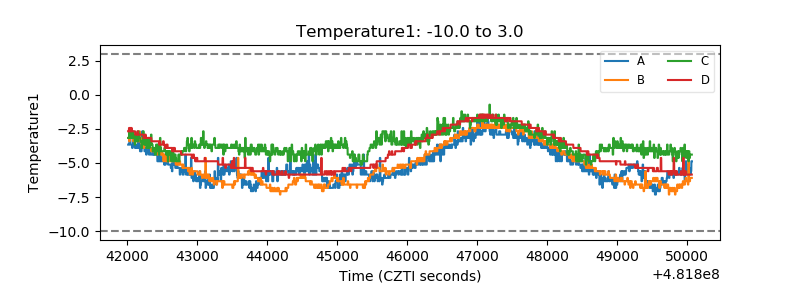 |
| Veto HV Monitor | 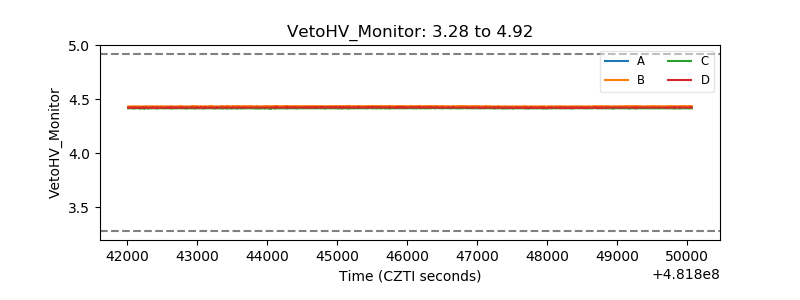 |
| Veto LLD | 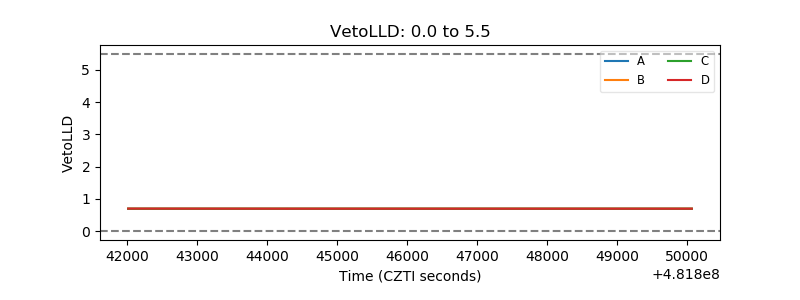 |
| Alpha Counter | 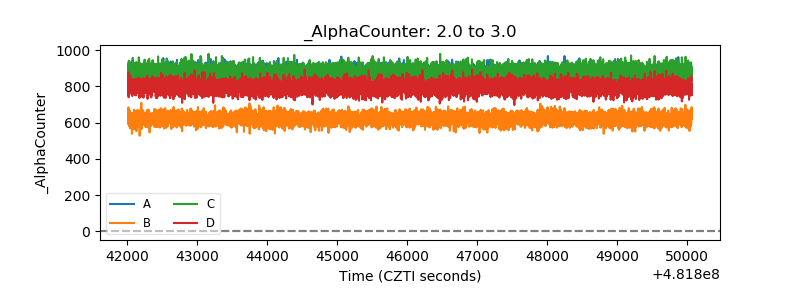 |
| _CPM_Rate | 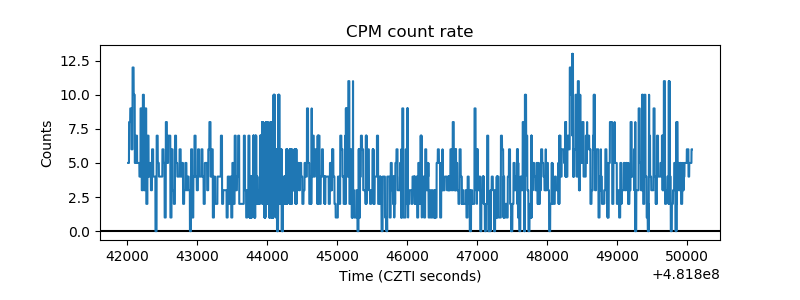 |
| CZT Counter | 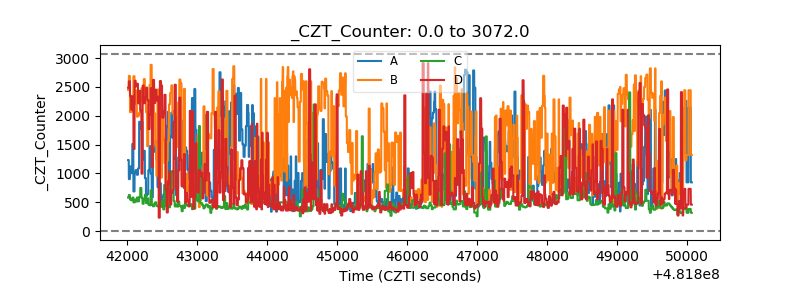 |
| +2.5 Volts monitor | 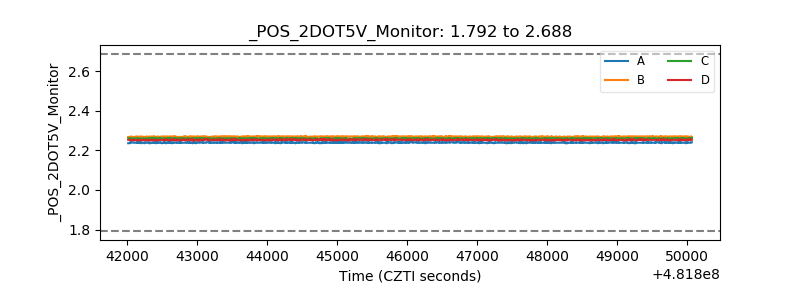 |
| +5 Volts monitor | 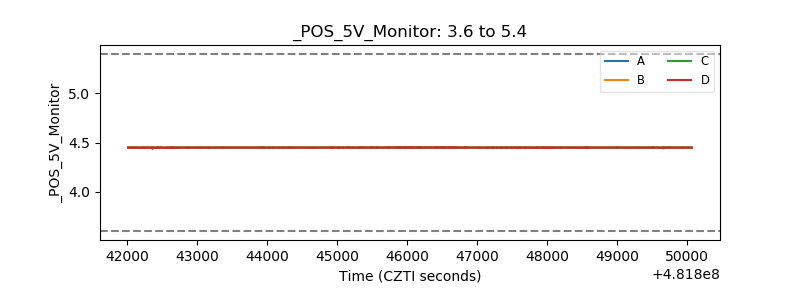 |
| _ROLL_ROT | 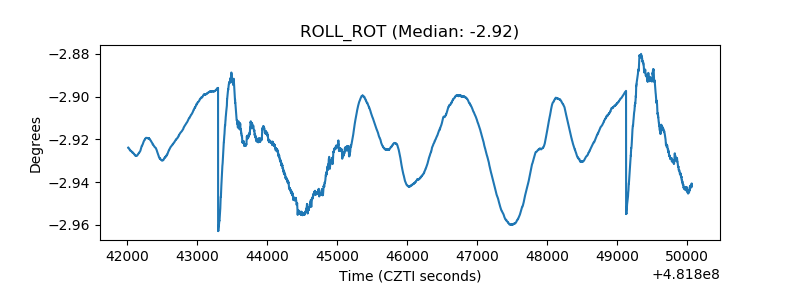 |
| _Roll_DEC | 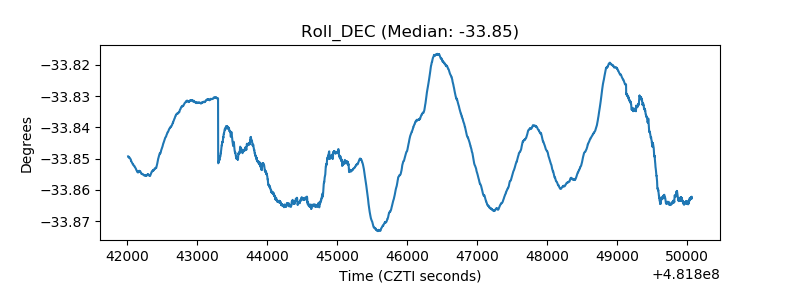 |
| _Roll_RA | 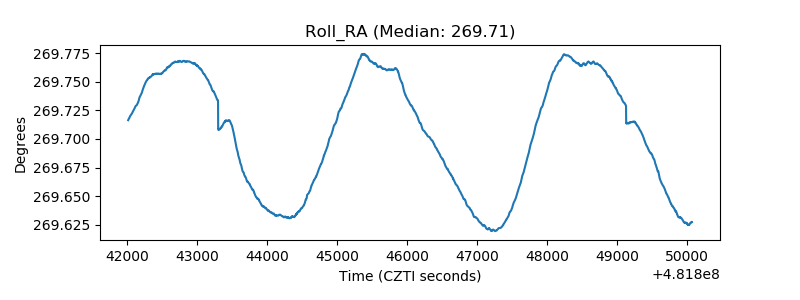 |
| Veto Counter | 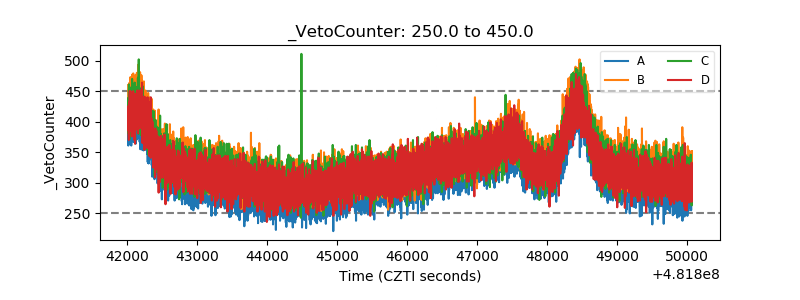 |