| Param | Original file | Final file |
|---|---|---|
| Filename | modeM0/AS1A13_090T01_9000006458_51548cztM0_level2.fits | modeM0/AS1A13_090T01_9000006458_51548cztM0_level2_quad_clean.evt |
| Size (bytes) | 948,487,680 | 117,587,520 |
| Size | 904.5 MB | 112.1 MB |
| Events in quadrant A | 10,190,177 | 750,181 |
| Events in quadrant B | 12,107,810 | 675,418 |
| Events in quadrant C | 4,716,739 | 798,129 |
| Events in quadrant D | 7,401,195 | 712,372 |
| Mode M0 | |||
|---|---|---|---|
| Quadrant | BADHDUFLAG | Total packets | Discarded packets |
| A | 0 | 37876 | 1284 |
| B | 0 | 44224 | 2022 |
| C | 0 | 21593 | 923 |
| D | 0 | 29470 | 916 |
| Mode M9 | |||
|---|---|---|---|
| Quadrant | BADHDUFLAG | Total packets | Discarded packets |
| A | 0 | 2 | 0 |
| B | 0 | 2 | 0 |
| C | 0 | 2 | 0 |
| D | 0 | 2 | 0 |
| Mode SS | |||
|---|---|---|---|
| Quadrant | BADHDUFLAG | Total packets | Discarded packets |
| A | 0 | 190 | 6 |
| B | 0 | 189 | 3 |
| C | 0 | 189 | 5 |
| D | 0 | 189 | 7 |
| Quadrant | Total seconds | Saturated seconds | Saturation percentage |
|---|---|---|---|
| A | 8980 | 1116 | 12.427617% |
| B | 8915 | 2520 | 28.266966% |
| C | 9022 | 187 | 2.072711% |
| D | 9024 | 656 | 7.269504% |
Noise dominated data is calculated using 1-second bins in cleaned event files. If a bin has >2000 counts, and if more than 50% of those come from <1% of pixels, then it is considered to be noise-dominated and hence unusable.
| Quadrant | # 1 sec bins | Bins with >0 counts | Bins with >2000 counts | High rate bins dominated by noise | Noise dominated (total time) | Noise dominated (detector-on time) | Marked lightcurve |
|---|---|---|---|---|---|---|---|
| A | 9264 | 9142 | 759 | 759 | 8.19% | 8.30% | 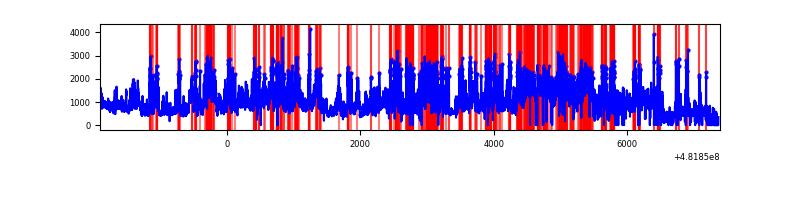 |
| B | 9276 | 9062 | 1962 | 1962 | 21.15% | 21.65% | 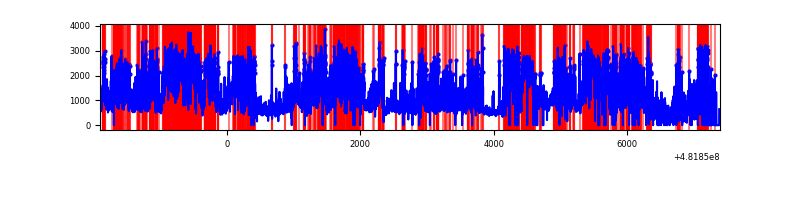 |
| C | 9267 | 9138 | 128 | 128 | 1.38% | 1.40% | 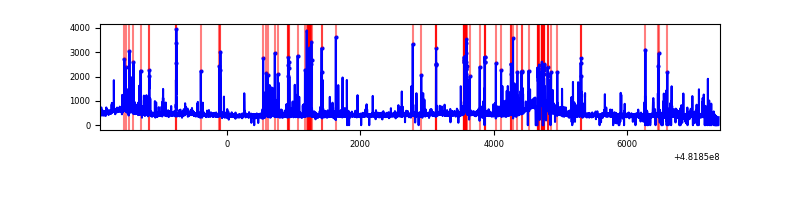 |
| D | 9287 | 9154 | 592 | 592 | 6.37% | 6.47% | 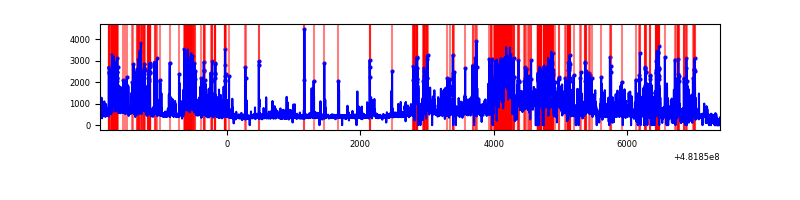 |
Top three noisy pixels from each quadrant. If the there are fewer than three noisy pixels in the level2.evt file, extra rows are filled as -1
| Pixel properties | Quadrant properties | ||||||
|---|---|---|---|---|---|---|---|
| Quadrant | DetID | PixID | Counts | Sigma | Mean | Median | Sigma |
| A | 12 | 3 | 2490224 | 10757.12 | 934 | 909 | 231.4 |
| A | 12 | 250 | 1531622 | 6614.7 | 934 | 909 | 231.4 |
| A | 12 | 17 | 1267562 | 5473.61 | 934 | 909 | 231.4 |
| B | 10 | 44 | 6042548 | 32391.2 | 869 | 840 | 186.5 |
| B | 15 | 52 | 797198 | 4269.49 | 869 | 840 | 186.5 |
| B | 4 | 81 | 726234 | 3889.03 | 869 | 840 | 186.5 |
| C | 13 | 3 | 452392 | 1688.68 | 960 | 952 | 267.3 |
| C | 3 | 233 | 102871 | 381.24 | 960 | 952 | 267.3 |
| C | 10 | 19 | 71165 | 262.64 | 960 | 952 | 267.3 |
| D | 8 | 176 | 2401517 | 9296.78 | 921 | 891 | 258.2 |
| D | 12 | 6 | 429295 | 1659.06 | 921 | 891 | 258.2 |
| D | 7 | 60 | 270169 | 1042.82 | 921 | 891 | 258.2 |
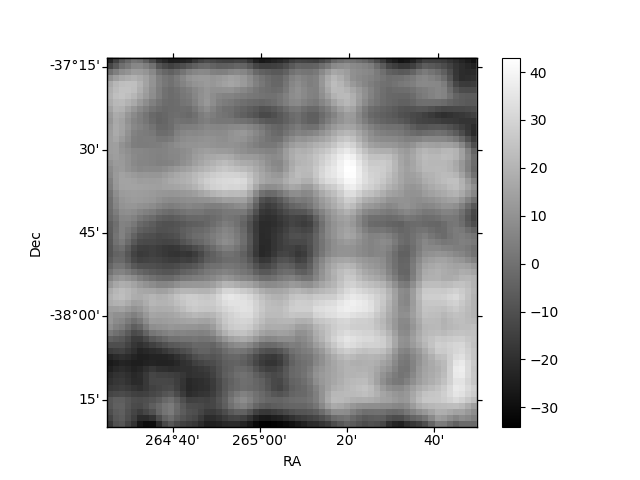
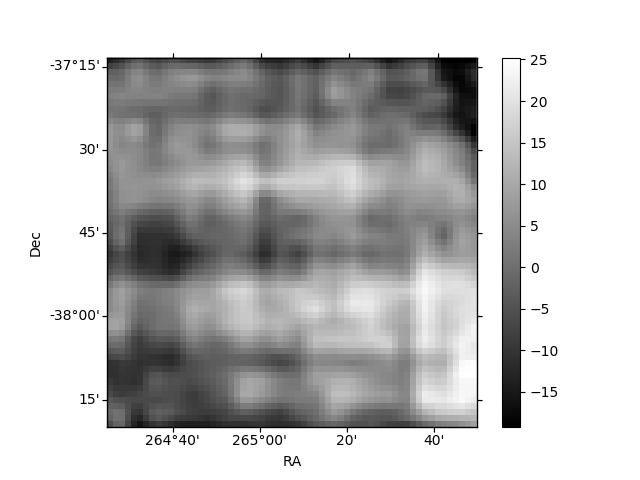
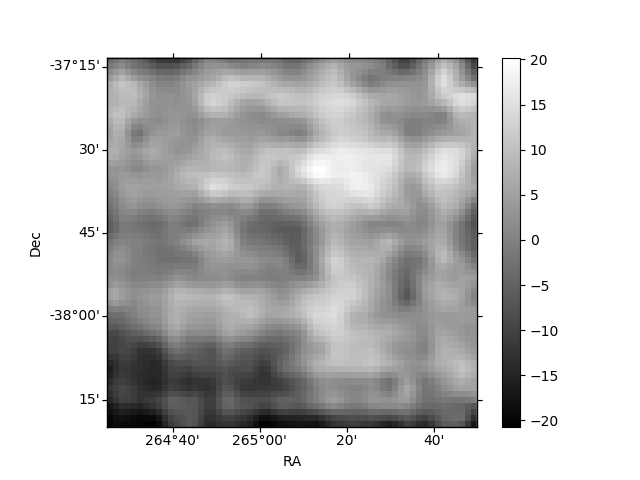
Histogram calculated using DETX and DETY for each event in the final _common_clean file
| Quadrant A | 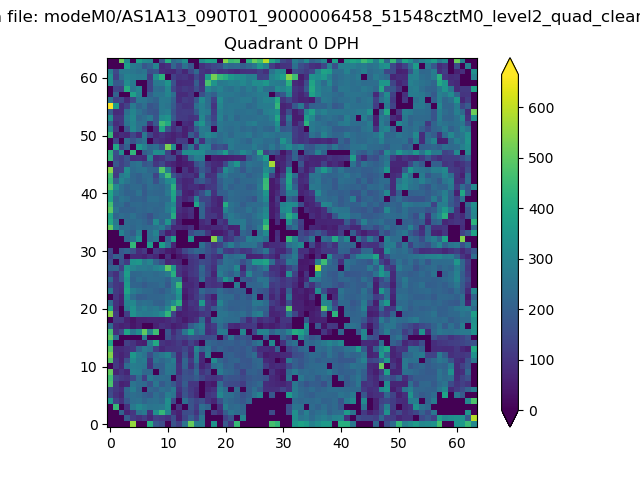 |
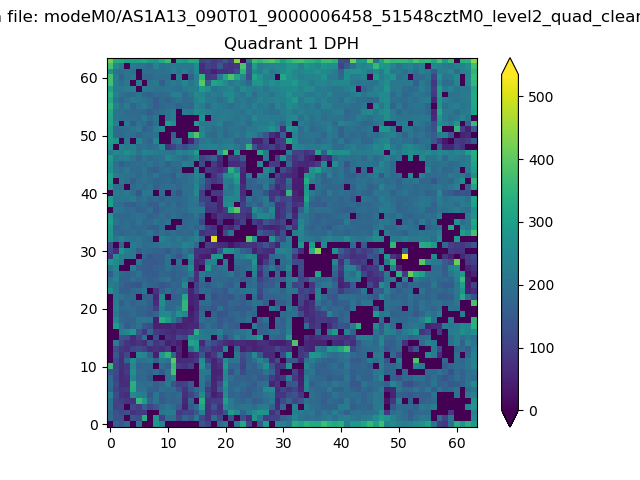 |
Quadrant B |
|---|---|---|---|
| Quadrant D | 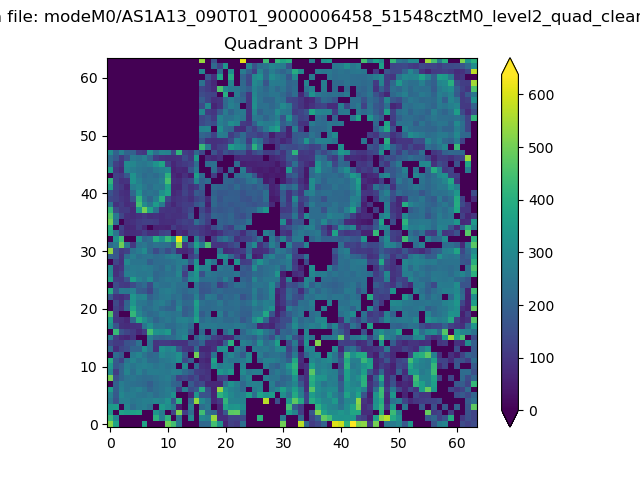 |
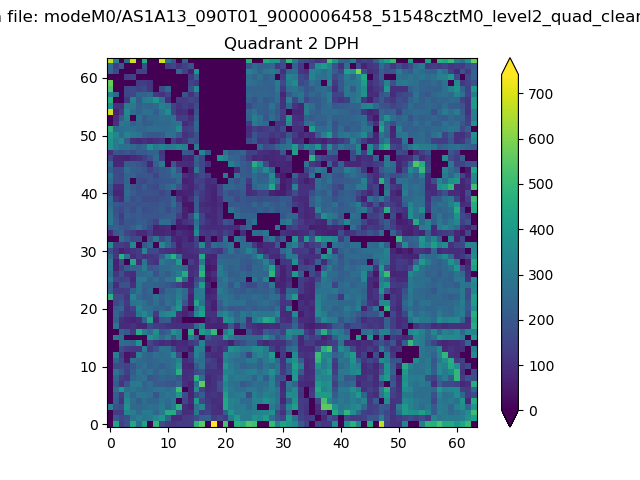 |
Quadrant C |
| Plot type | Count rate plots | Images |
|---|---|---|
| Comparison with Poisson distribution Blue bars denote a histogram of data divided into 1 sec bins. Red curve is a Poisson curve with rate = median count rate of data. |
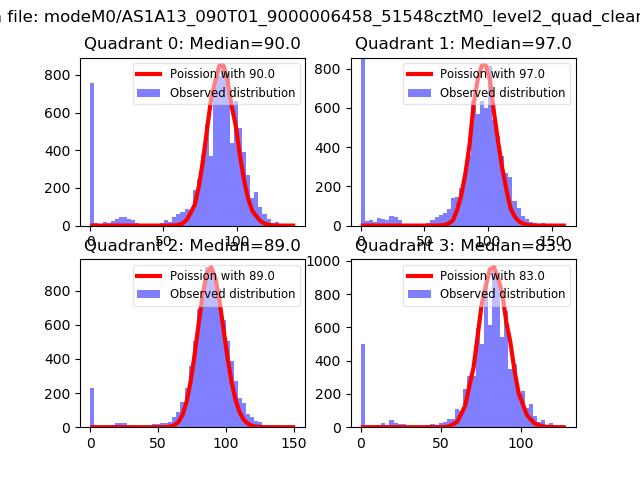 |
 |
| Quadrant-wise count rates Data is divided into 100 sec bins |
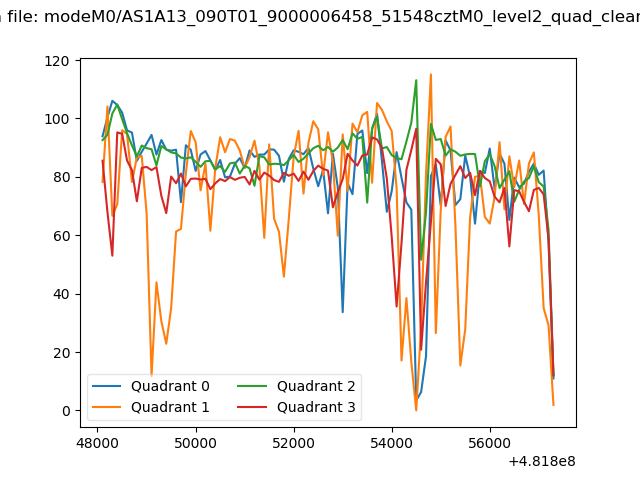 |
|
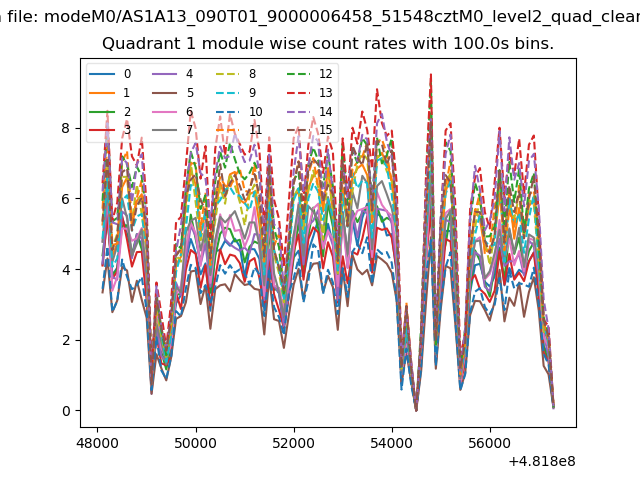
| Module-wise count rates for Quadrant A Data is divided into 100 sec bins |
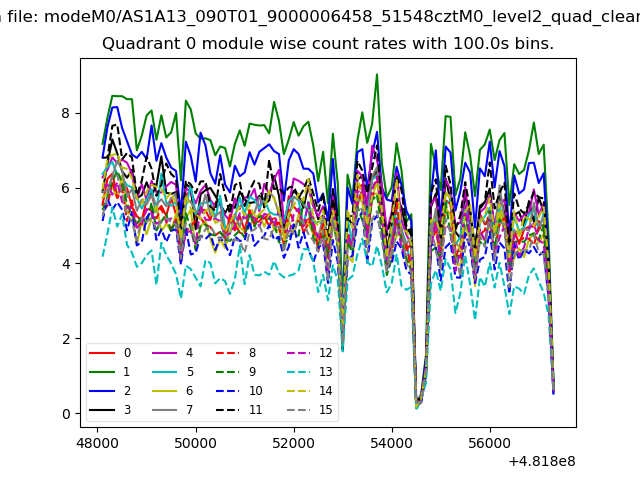 |
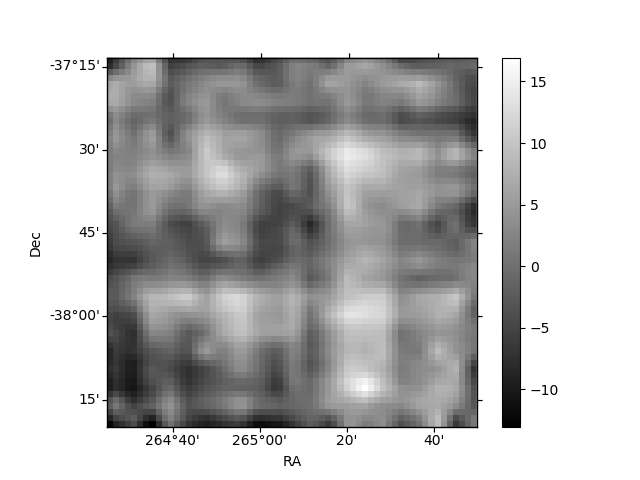 |
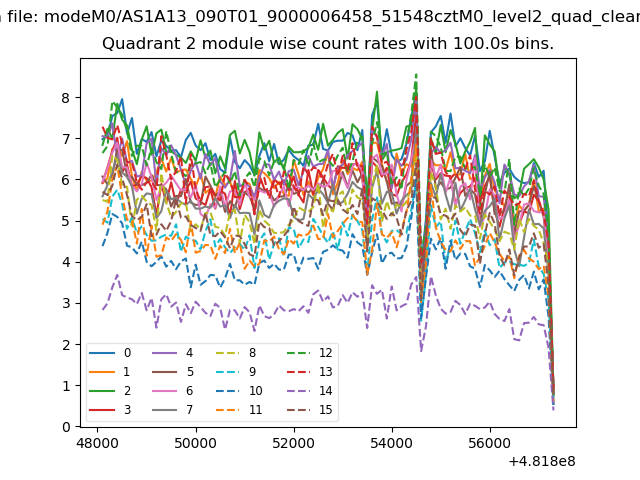
| Module-wise count rates for Quadrant B Data is divided into 100 sec bins |
 |
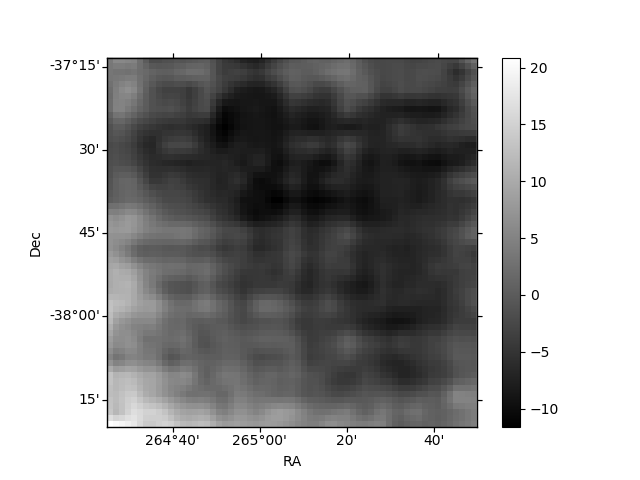 |
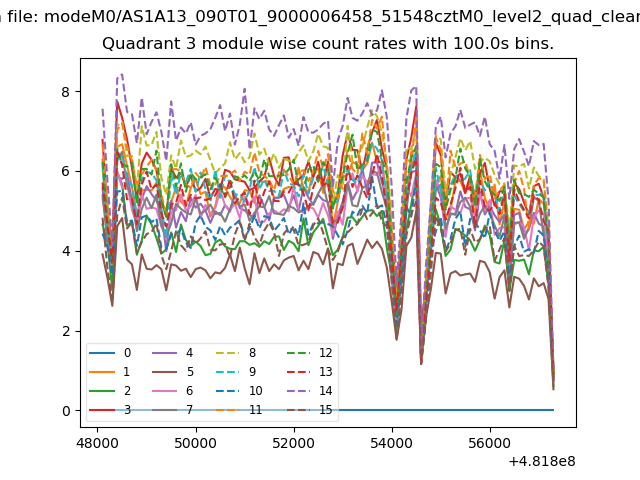
| Module-wise count rates for Quadrant C Data is divided into 100 sec bins |
 |
 |
| Module-wise count rates for Quadrant D Data is divided into 100 sec bins |
 |
 |
| Parameter | Plot |
|---|---|
| CZT HV Monitor | 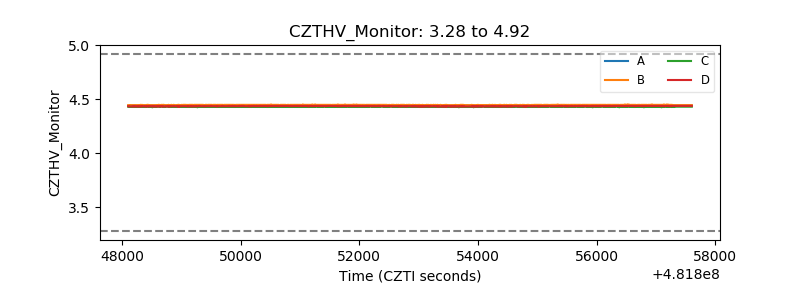 |
| D_VDD | 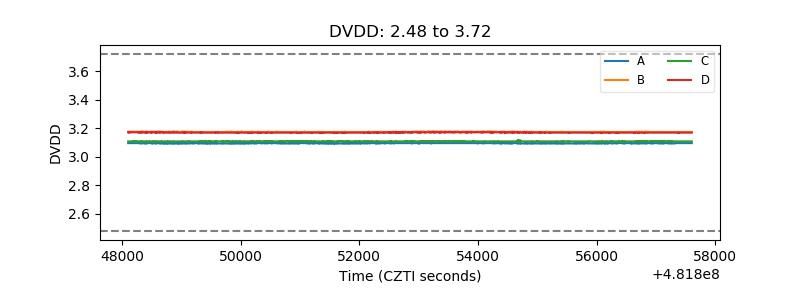 |
| Temperature 1 | 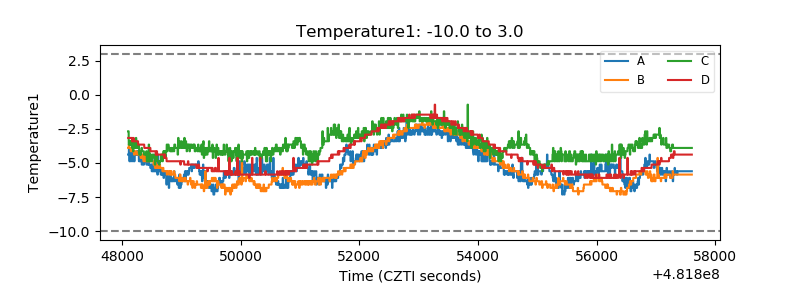 |
| Veto HV Monitor | 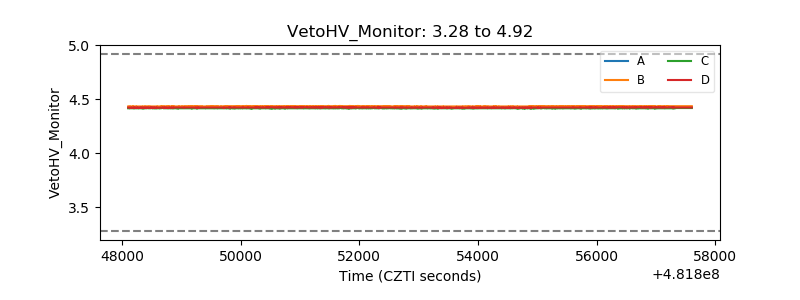 |
| Veto LLD | 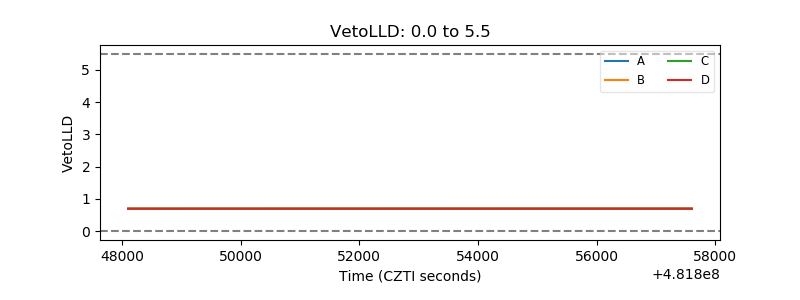 |
| Alpha Counter | 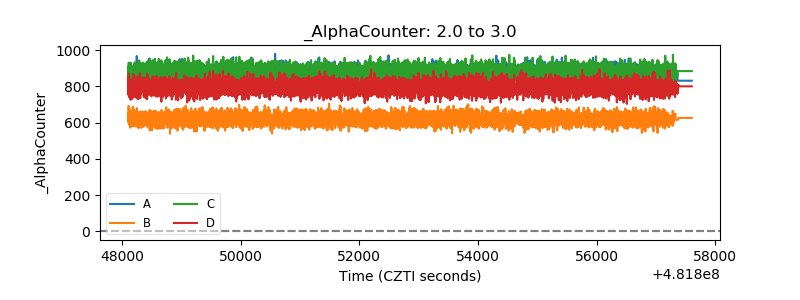 |
| _CPM_Rate | 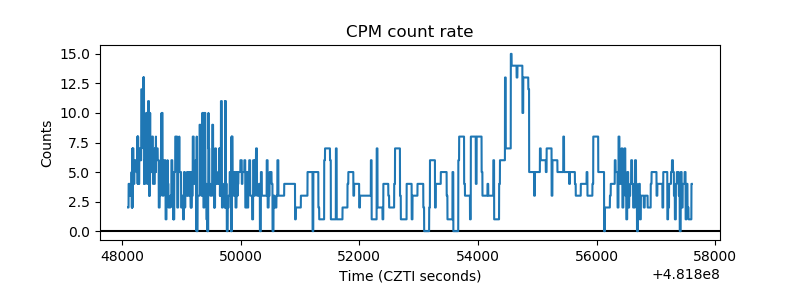 |
| CZT Counter | 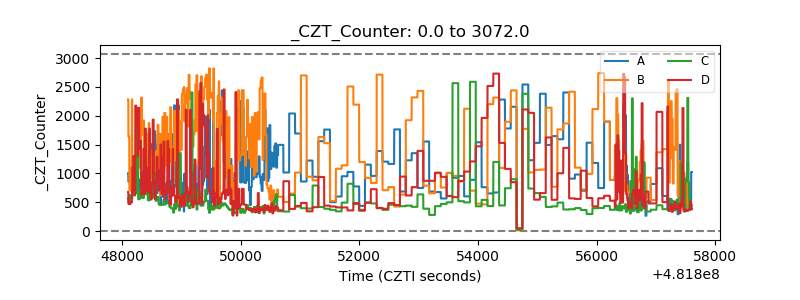 |
| +2.5 Volts monitor | 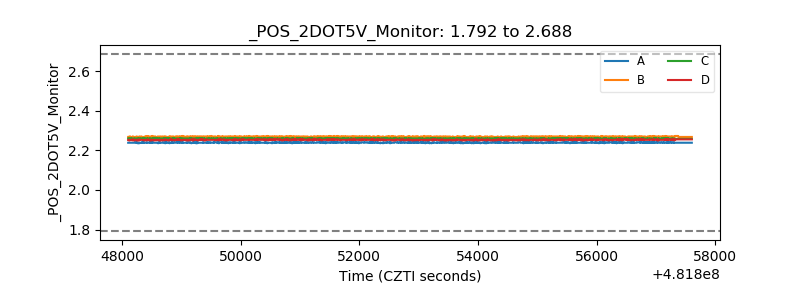 |
| +5 Volts monitor | 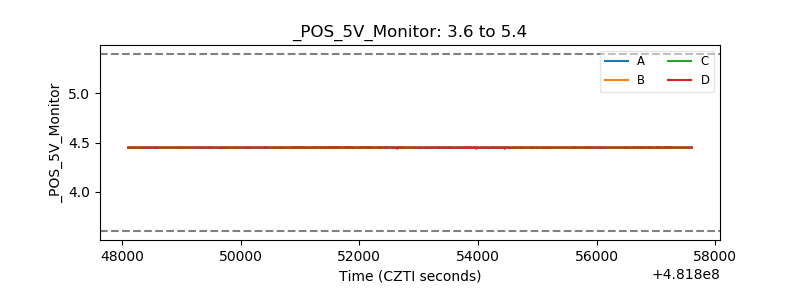 |
| _ROLL_ROT | 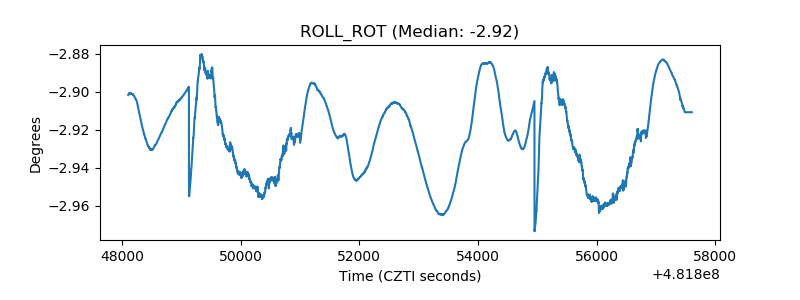 |
| _Roll_DEC | 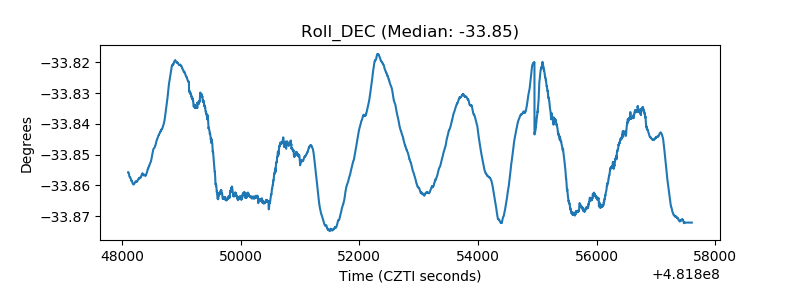 |
| _Roll_RA | 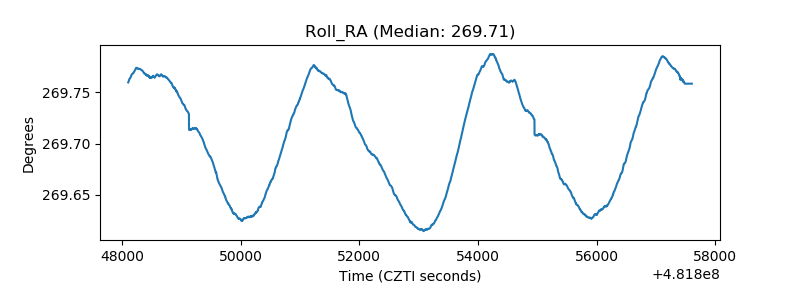 |
| Veto Counter | 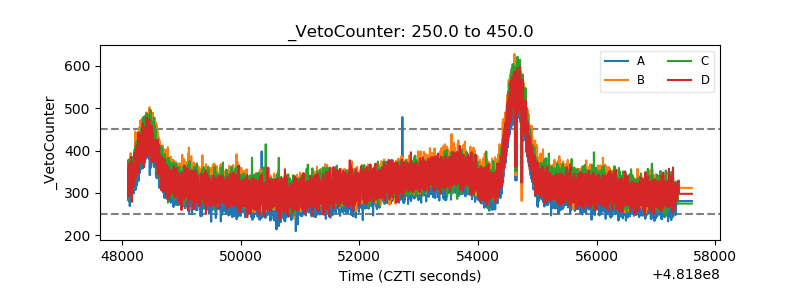 |