| Param | Original file | Final file |
|---|---|---|
| Filename | modeM0/AS1A13_090T01_9000006458_51550cztM0_level2.fits | modeM0/AS1A13_090T01_9000006458_51550cztM0_level2_quad_clean.evt |
| Size (bytes) | 1,978,899,840 | 201,502,080 |
| Size | 1.8 GB | 192.2 MB |
| Events in quadrant A | 24,320,519 | 1,052,271 |
| Events in quadrant B | 20,801,234 | 1,260,262 |
| Events in quadrant C | 9,981,549 | 1,462,354 |
| Events in quadrant D | 16,870,530 | 1,179,747 |
| Mode M0 | |||
|---|---|---|---|
| Quadrant | BADHDUFLAG | Total packets | Discarded packets |
| A | 0 | 83818 | 3 |
| B | 0 | 73191 | 3 |
| C | 0 | 41389 | 5 |
| D | 0 | 61762 | 3 |
| Mode M9 | |||
|---|---|---|---|
| Quadrant | BADHDUFLAG | Total packets | Discarded packets |
| A | 0 | 16 | 0 |
| B | 0 | 16 | 0 |
| C | 0 | 16 | 0 |
| D | 0 | 16 | 0 |
| Mode SS | |||
|---|---|---|---|
| Quadrant | BADHDUFLAG | Total packets | Discarded packets |
| A | 0 | 340 | 0 |
| B | 0 | 340 | 0 |
| C | 0 | 340 | 0 |
| D | 0 | 340 | 0 |
| Quadrant | Total seconds | Saturated seconds | Saturation percentage |
|---|---|---|---|
| A | 16600 | 5760 | 34.698795% |
| B | 16600 | 4339 | 26.138554% |
| C | 16599 | 420 | 2.530273% |
| D | 16600 | 2619 | 15.777108% |
Noise dominated data is calculated using 1-second bins in cleaned event files. If a bin has >2000 counts, and if more than 50% of those come from <1% of pixels, then it is considered to be noise-dominated and hence unusable.
| Quadrant | # 1 sec bins | Bins with >0 counts | Bins with >2000 counts | High rate bins dominated by noise | Noise dominated (total time) | Noise dominated (detector-on time) | Marked lightcurve |
|---|---|---|---|---|---|---|---|
| A | 18324 | 16600 | 5005 | 5005 | 27.31% | 30.15% | 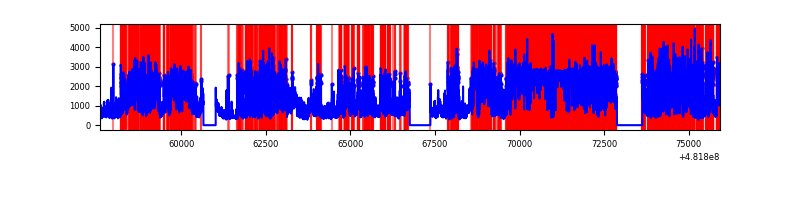 |
| B | 18325 | 16602 | 3627 | 3627 | 19.79% | 21.85% | 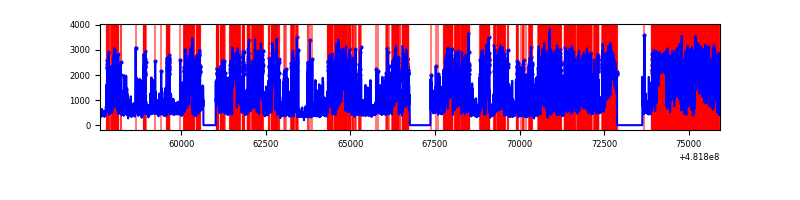 |
| C | 18324 | 16601 | 273 | 273 | 1.49% | 1.64% | 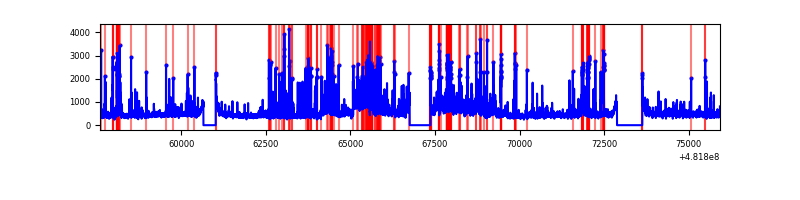 |
| D | 18325 | 16602 | 2481 | 2481 | 13.54% | 14.94% | 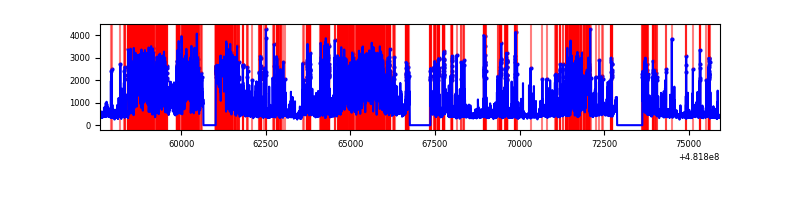 |
Top three noisy pixels from each quadrant. If the there are fewer than three noisy pixels in the level2.evt file, extra rows are filled as -1
| Pixel properties | Quadrant properties | ||||||
|---|---|---|---|---|---|---|---|
| Quadrant | DetID | PixID | Counts | Sigma | Mean | Median | Sigma |
| A | 7 | 64 | 7594606 | 20518.76 | 1496 | 1459 | 370.1 |
| A | 15 | 32 | 3502900 | 9461.85 | 1496 | 1459 | 370.1 |
| A | 12 | 3 | 3045489 | 8225.8 | 1496 | 1459 | 370.1 |
| B | 10 | 44 | 12319559 | 35873.54 | 1609 | 1548 | 343.4 |
| B | 5 | 172 | 455880 | 1323.14 | 1609 | 1548 | 343.4 |
| B | 0 | 171 | 257240 | 744.65 | 1609 | 1548 | 343.4 |
| C | 9 | 38 | 1253171 | 2584.14 | 1751 | 1732 | 484.3 |
| C | 13 | 3 | 818788 | 1687.17 | 1751 | 1732 | 484.3 |
| C | 3 | 233 | 380144 | 781.4 | 1751 | 1732 | 484.3 |
| D | 8 | 176 | 7639452 | 16529.44 | 1644 | 1585 | 462.1 |
| D | 12 | 6 | 1291070 | 2790.63 | 1644 | 1585 | 462.1 |
| D | 6 | 42 | 373019 | 803.84 | 1644 | 1585 | 462.1 |
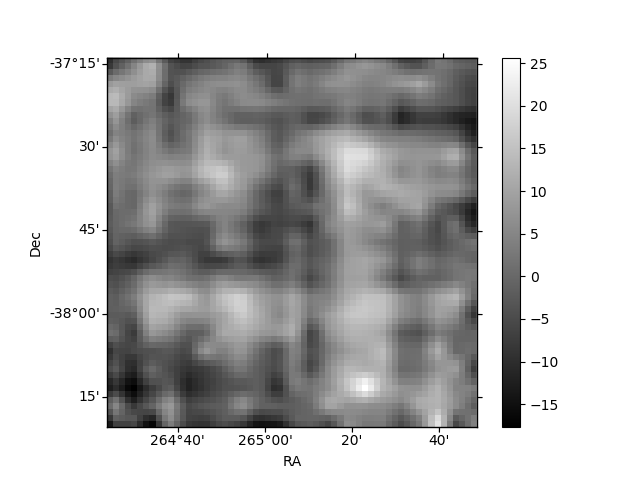
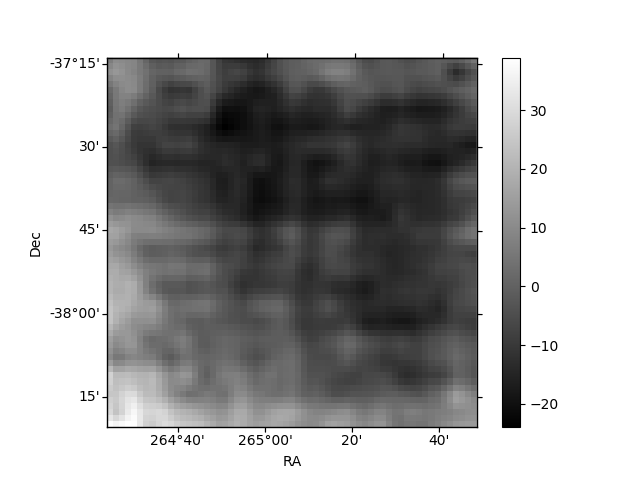
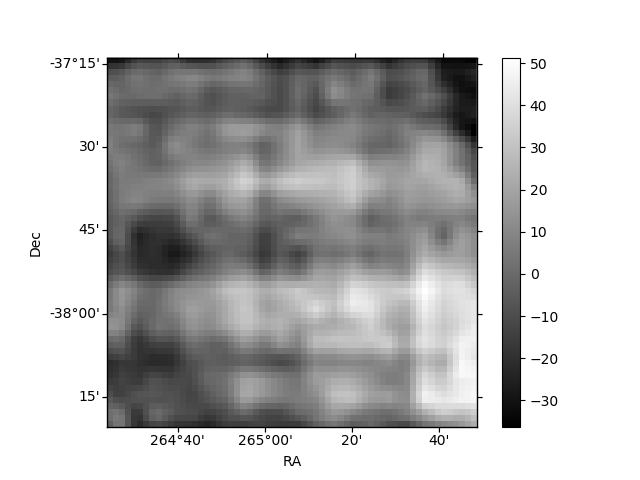
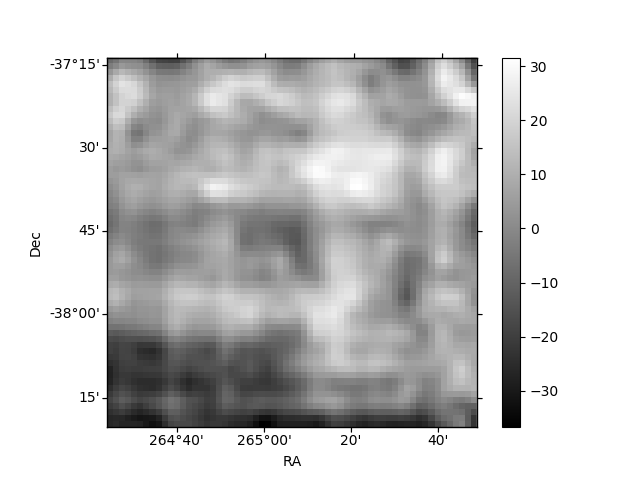
Histogram calculated using DETX and DETY for each event in the final _common_clean file
| Quadrant A | 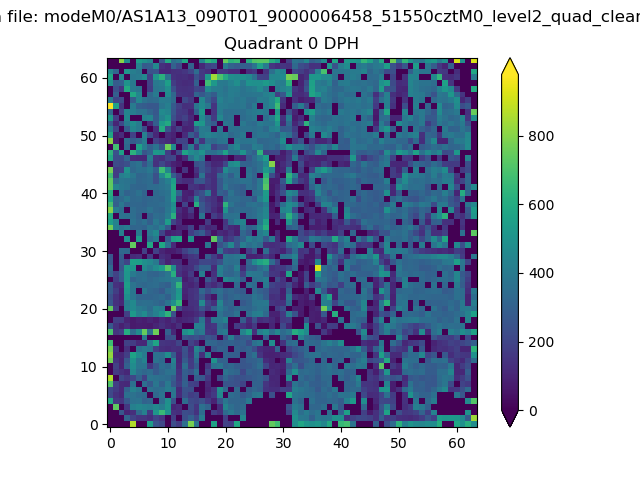 |
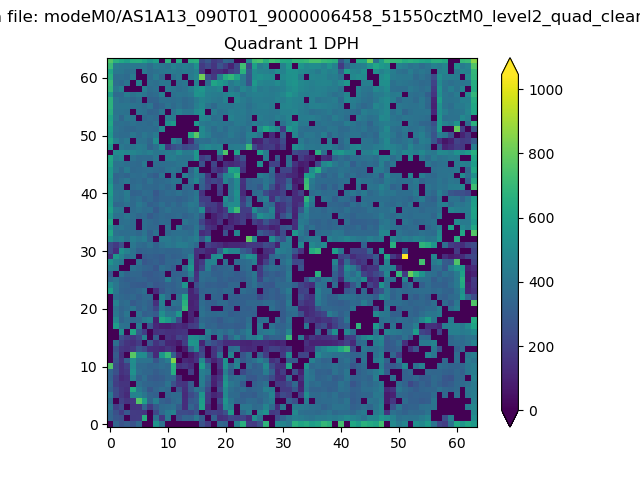 |
Quadrant B |
|---|---|---|---|
| Quadrant D | 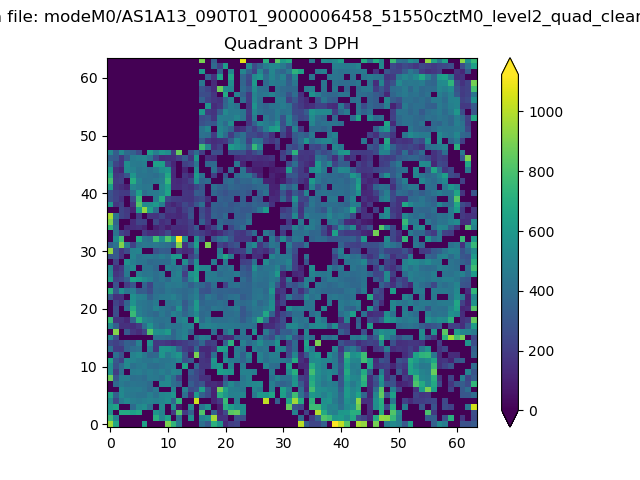 |
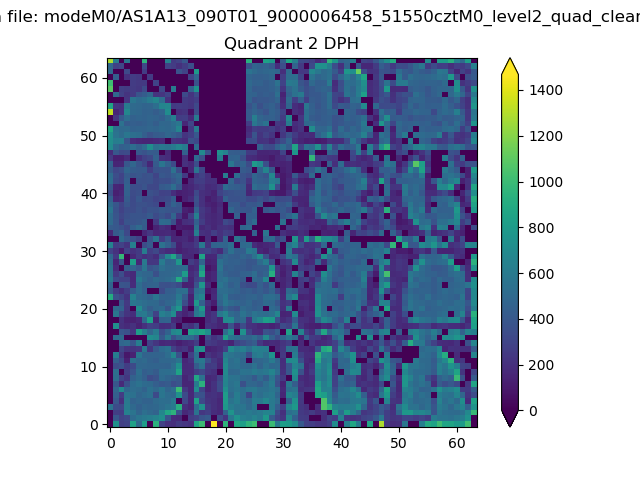 |
Quadrant C |
| Plot type | Count rate plots | Images |
|---|---|---|
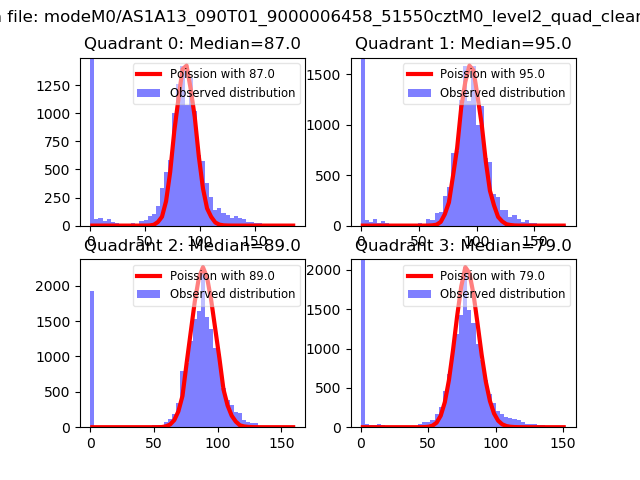
| Comparison with Poisson distribution Blue bars denote a histogram of data divided into 1 sec bins. Red curve is a Poisson curve with rate = median count rate of data. |
 |
 |
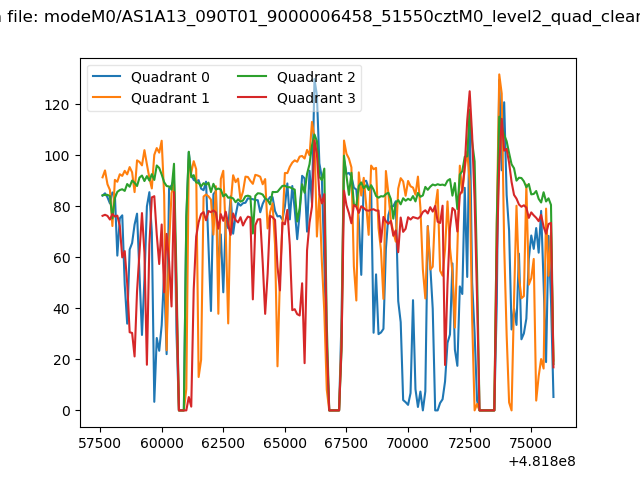
| Quadrant-wise count rates Data is divided into 100 sec bins |
 |
|
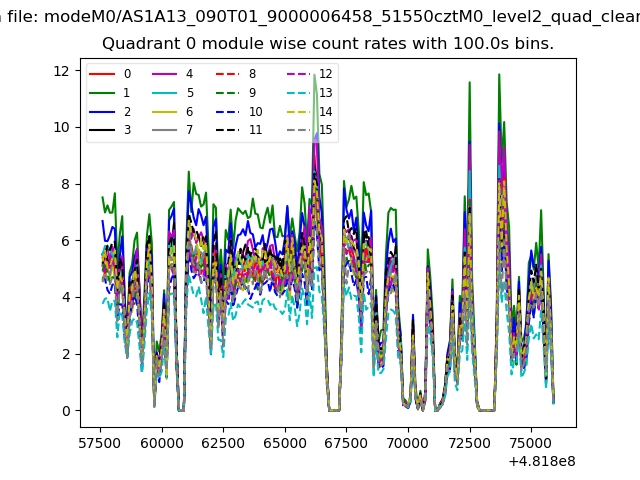
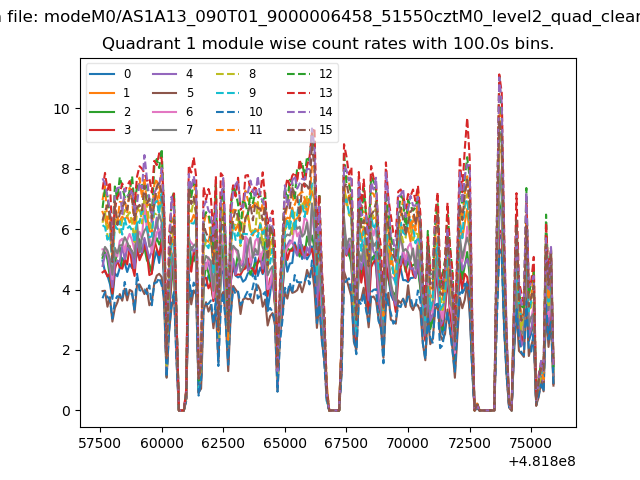
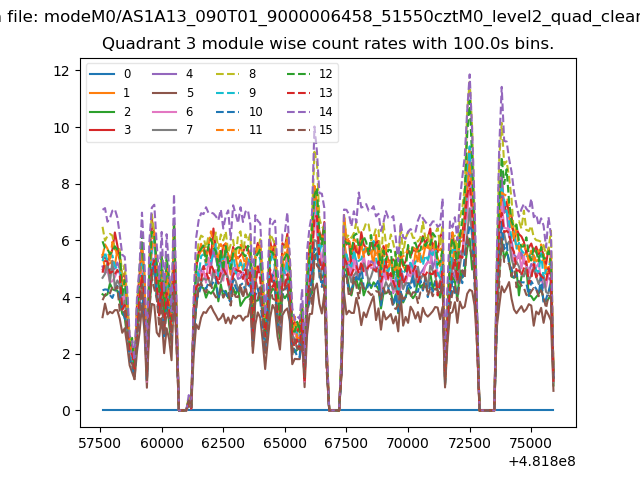
| Module-wise count rates for Quadrant A Data is divided into 100 sec bins |
 |
 |
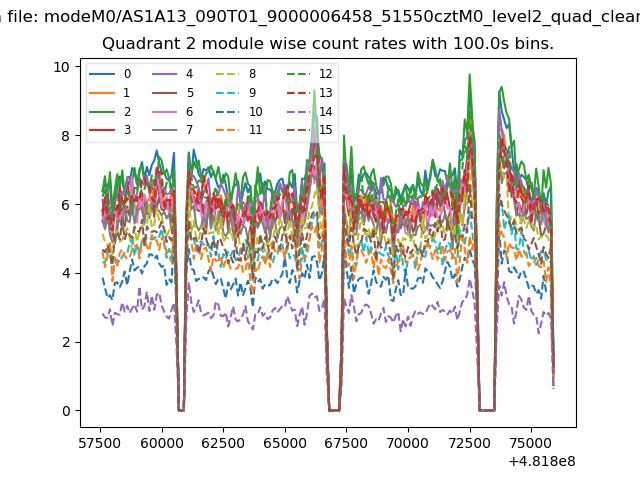
| Module-wise count rates for Quadrant B Data is divided into 100 sec bins |
 |
 |
| Module-wise count rates for Quadrant C Data is divided into 100 sec bins |
 |
 |
| Module-wise count rates for Quadrant D Data is divided into 100 sec bins |
 |
 |
| Parameter | Plot |
|---|---|
| CZT HV Monitor | 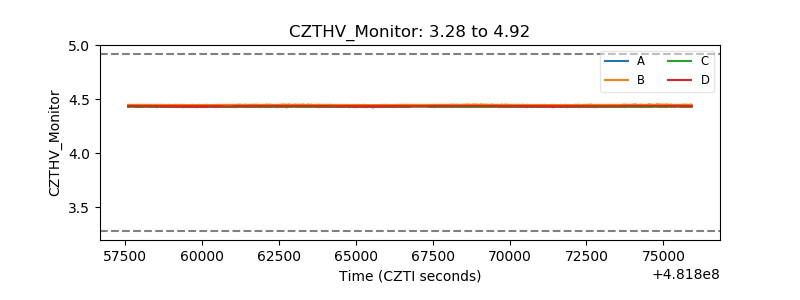 |
| D_VDD | 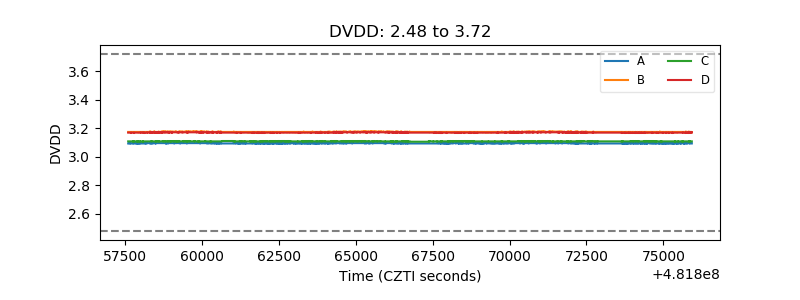 |
| Temperature 1 | 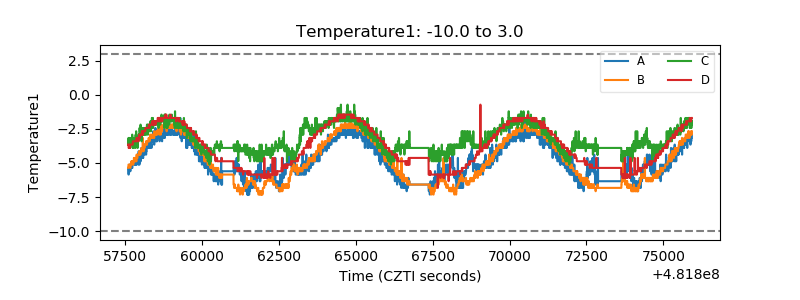 |
| Veto HV Monitor | 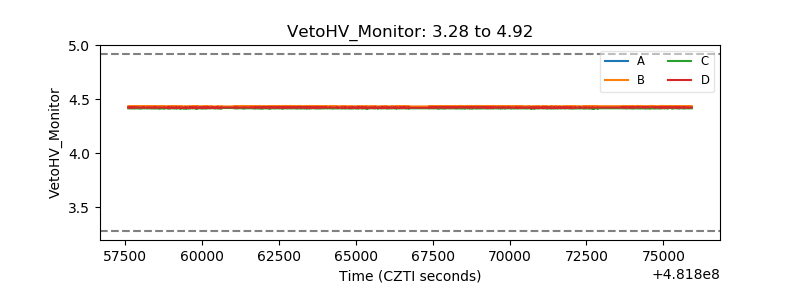 |
| Veto LLD | 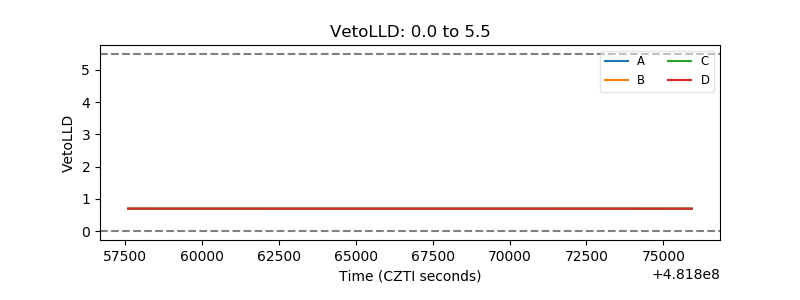 |
| Alpha Counter | 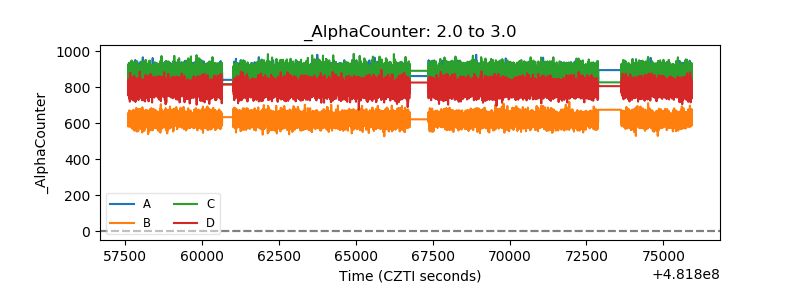 |
| _CPM_Rate | 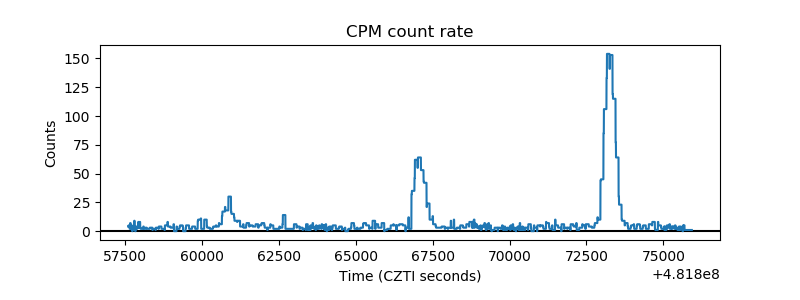 |
| CZT Counter | 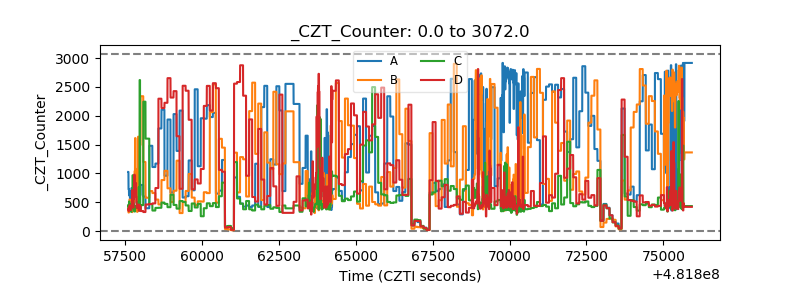 |
| +2.5 Volts monitor | 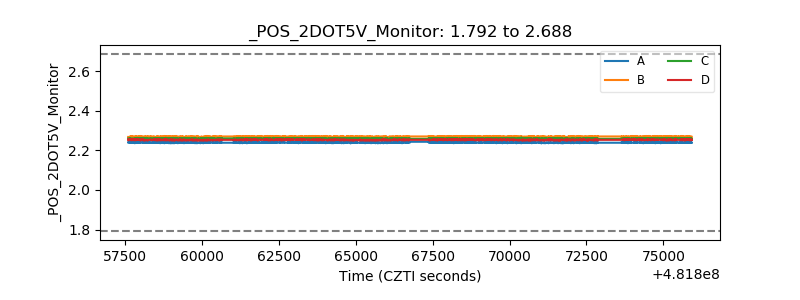 |
| +5 Volts monitor | 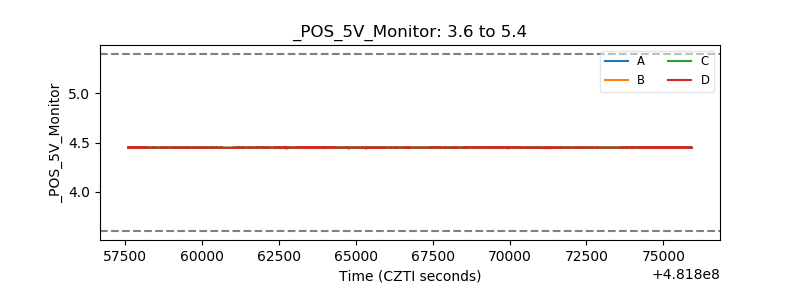 |
| _ROLL_ROT | 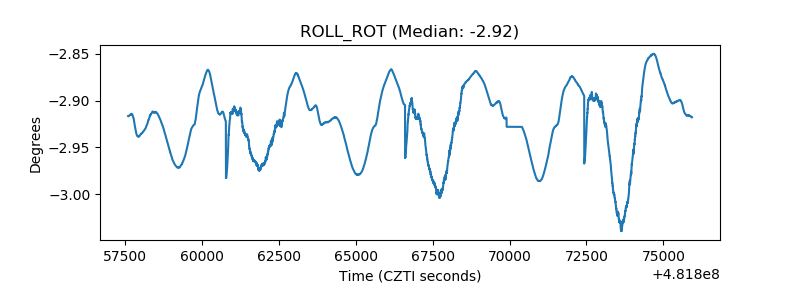 |
| _Roll_DEC | 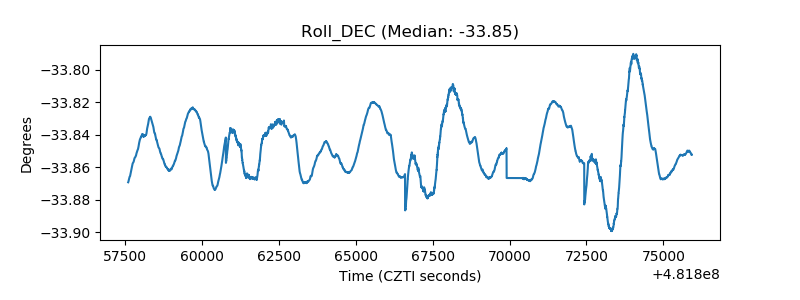 |
| _Roll_RA | 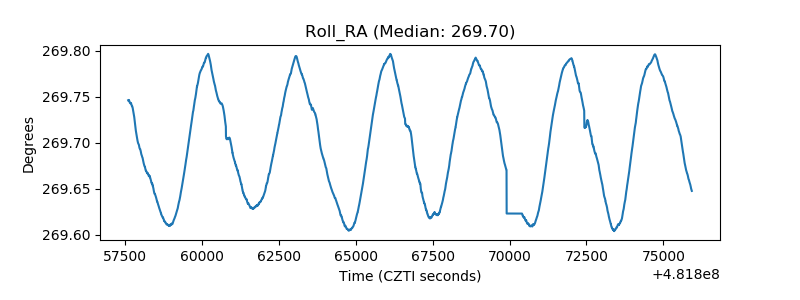 |
| Veto Counter | 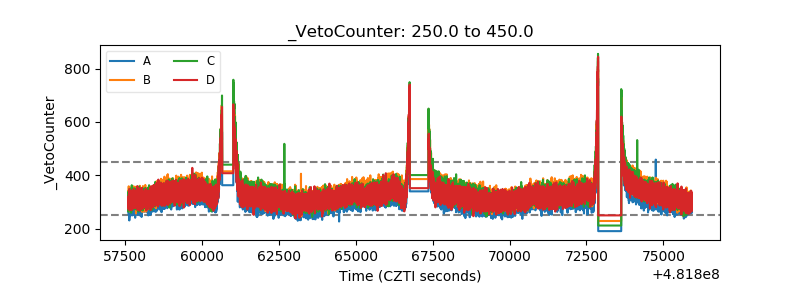 |