| Param | Original file | Final file |
|---|---|---|
| Filename | modeM0/AS1A13_037T05_9000006460cztM0_level2.fits | modeM0/AS1A13_037T05_9000006460cztM0_level2_quad_clean.evt |
| Size (bytes) | 4,373,758,080 | 2,115,463,680 |
| Size | 4.1 GB | 2.0 GB |
| Events in quadrant A | 25,097,338 | 7,015,212 |
| Events in quadrant B | 25,005,274 | 7,623,172 |
| Events in quadrant C | 23,149,032 | 6,284,782 |
| Events in quadrant D | 22,126,320 | 6,151,797 |
| Mode M9 | |||
|---|---|---|---|
| Quadrant | BADHDUFLAG | Total packets | Discarded packets |
| A | 0 | 633 | 0 |
| B | 0 | 634 | 0 |
| C | 0 | 635 | 0 |
| D | 0 | 634 | 0 |
| Mode M0 | |||
|---|---|---|---|
| Quadrant | BADHDUFLAG | Total packets | Discarded packets |
| A | 0 | 1921755 | 0 |
| B | 0 | 1553947 | 0 |
| C | 0 | 1725476 | 0 |
| D | 0 | 1698418 | 0 |
| Mode SS | |||
|---|---|---|---|
| Quadrant | BADHDUFLAG | Total packets | Discarded packets |
| A | 0 | 10820 | 0 |
| B | 0 | 10970 | 0 |
| C | 0 | 10955 | 0 |
| D | 0 | 10819 | 0 |
| Quadrant | Total seconds | Saturated seconds | Saturation percentage |
|---|---|---|---|
| A | 539751 | 74529 | 13.808034% |
| B | 540103 | 44117 | 8.168257% |
| C | 539970 | 91863 | 17.012612% |
| D | 539905 | 49657 | 9.197359% |
Noise dominated data is calculated using 1-second bins in cleaned event files. If a bin has >2000 counts, and if more than 50% of those come from <1% of pixels, then it is considered to be noise-dominated and hence unusable.
| Quadrant | # 1 sec bins | Bins with >0 counts | Bins with >2000 counts | High rate bins dominated by noise | Noise dominated (total time) | Noise dominated (detector-on time) | Marked lightcurve |
|---|---|---|---|---|---|---|---|
| A | 633787 | 538986 | 0 | 0 | 0.00% | 0.00% | 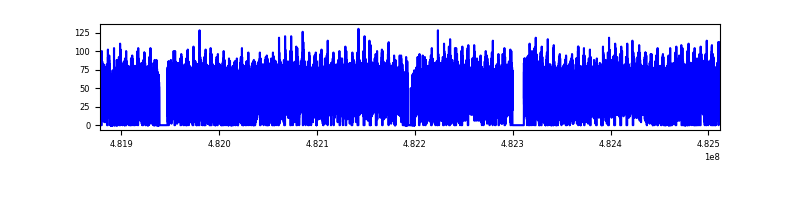 |
| B | 633788 | 540071 | 0 | 0 | 0.00% | 0.00% | 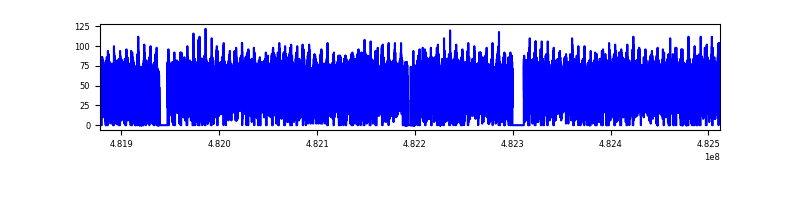 |
| C | 633788 | 521306 | 0 | 0 | 0.00% | 0.00% | 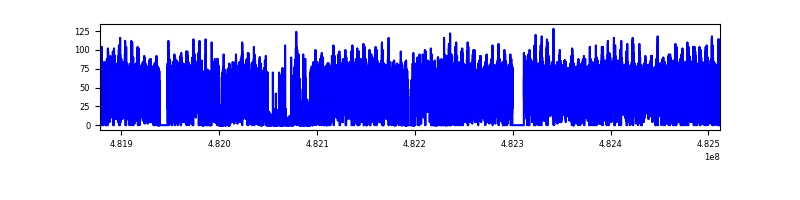 |
| D | 633788 | 539355 | 0 | 0 | 0.00% | 0.00% | 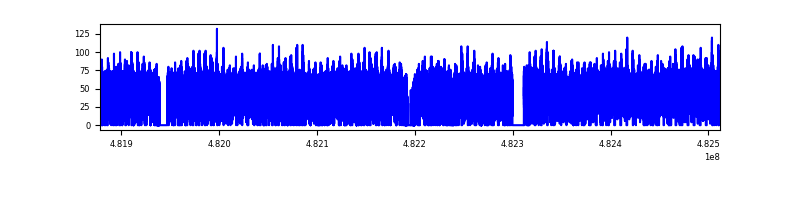 |
Top three noisy pixels from each quadrant. If the there are fewer than three noisy pixels in the level2.evt file, extra rows are filled as -1
| Pixel properties | Quadrant properties | ||||||
|---|---|---|---|---|---|---|---|
| Quadrant | DetID | PixID | Counts | Sigma | Mean | Median | Sigma |
| A | 14 | 188 | 26175 | 9.35 | 6650 | 6156 | 2139.9 |
| A | 9 | 255 | 25266 | 8.93 | 6650 | 6156 | 2139.9 |
| A | 14 | 95 | 21327 | 7.09 | 6650 | 6156 | 2139.9 |
| B | 2 | 9 | 28621 | 14.46 | 6640 | 6264 | 1546.0 |
| B | 2 | 8 | 25875 | 12.69 | 6640 | 6264 | 1546.0 |
| B | 9 | 173 | 20512 | 9.22 | 6640 | 6264 | 1546.0 |
| C | 15 | 127 | 18315 | 6.12 | 6230 | 5689 | 2061.9 |
| C | 7 | 111 | 17924 | 5.93 | 6230 | 5689 | 2061.9 |
| C | 7 | 221 | 17918 | 5.93 | 6230 | 5689 | 2061.9 |
| D | 6 | 218 | 28045 | 10.58 | 6354 | 5644 | 2117.8 |
| D | 3 | 30 | 21440 | 7.46 | 6354 | 5644 | 2117.8 |
| D | 15 | 11 | 20072 | 6.81 | 6354 | 5644 | 2117.8 |
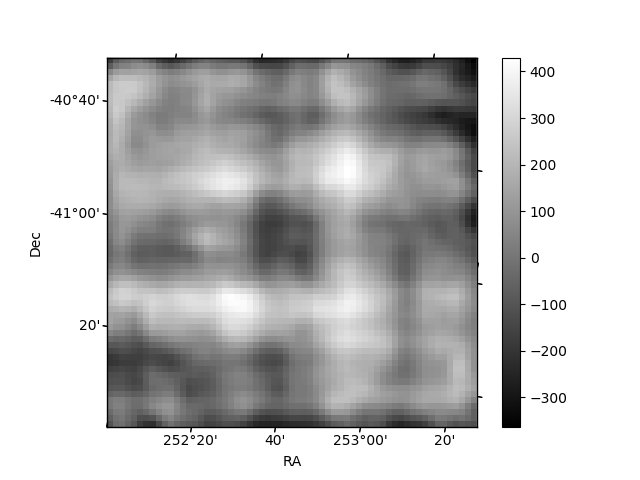
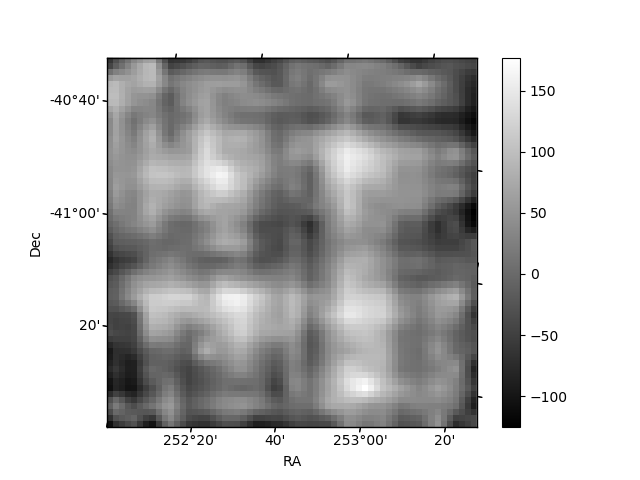
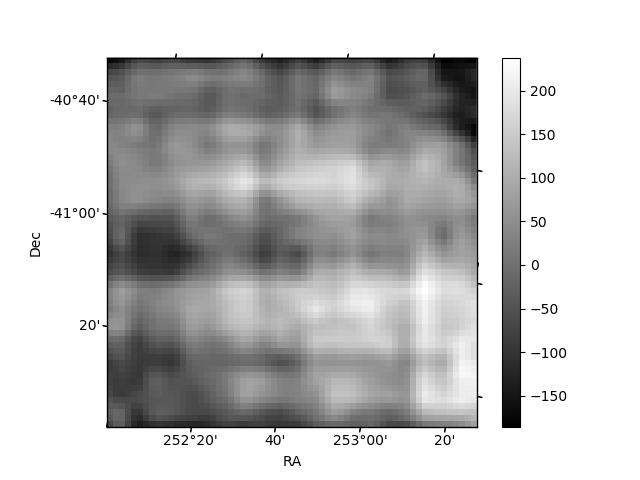
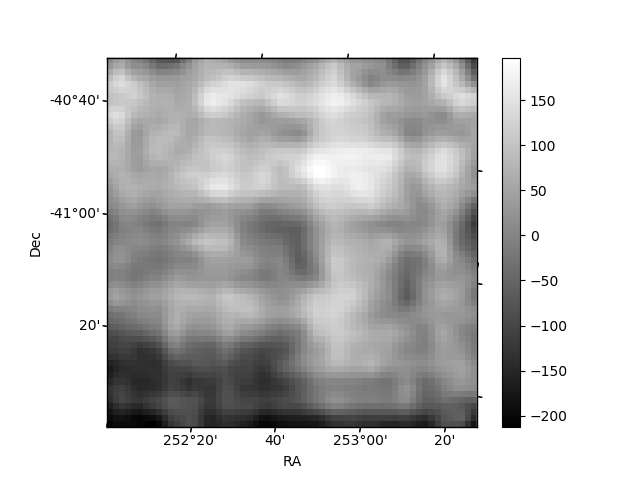
Histogram calculated using DETX and DETY for each event in the final _common_clean file
| Quadrant A | 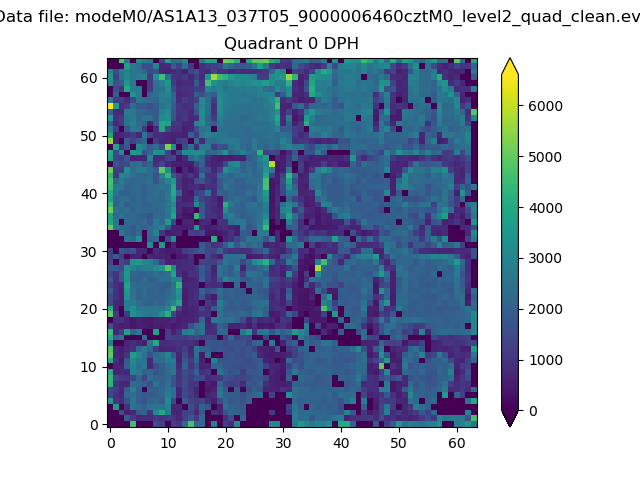 |
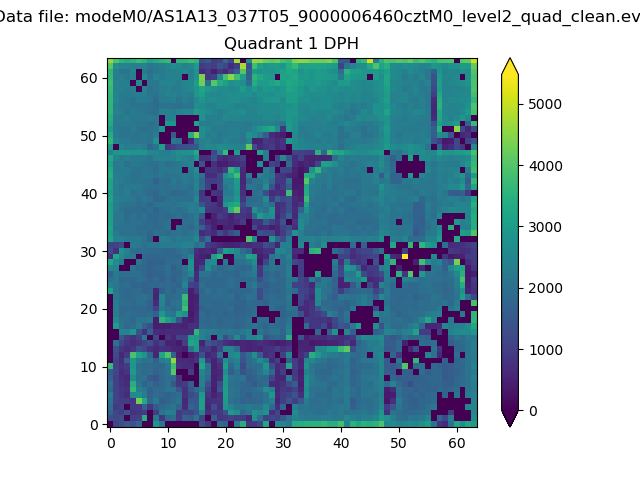 |
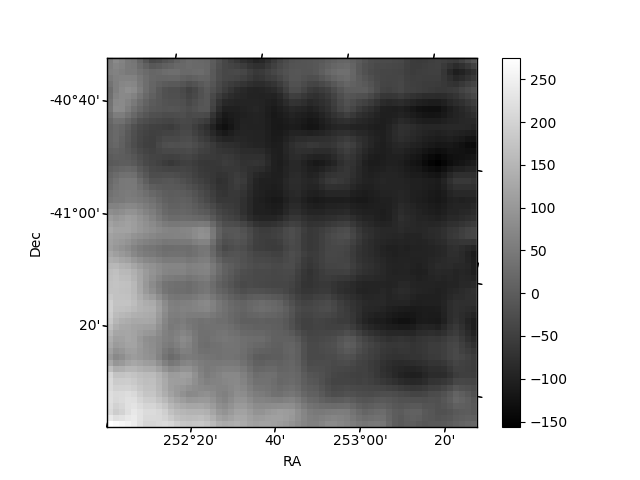
Quadrant B |
|---|---|---|---|
| Quadrant D | 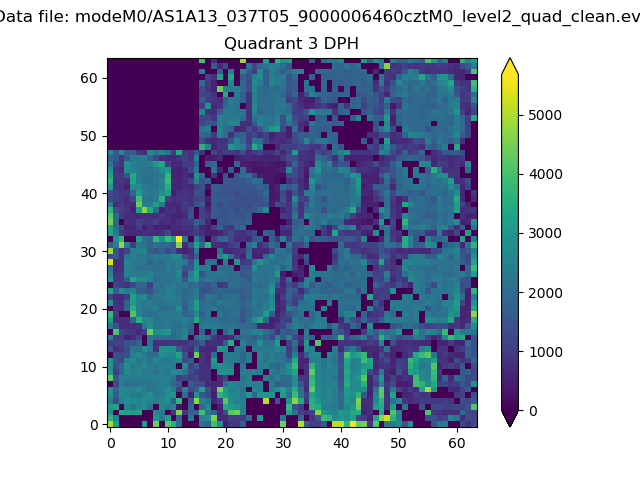 |
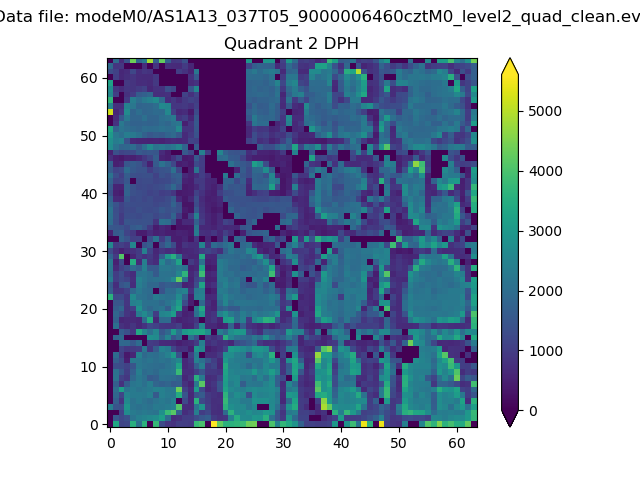 |
Quadrant C |
| Plot type | Count rate plots | Images |
|---|---|---|
| Comparison with Poisson distribution Blue bars denote a histogram of data divided into 1 sec bins. Red curve is a Poisson curve with rate = median count rate of data. |
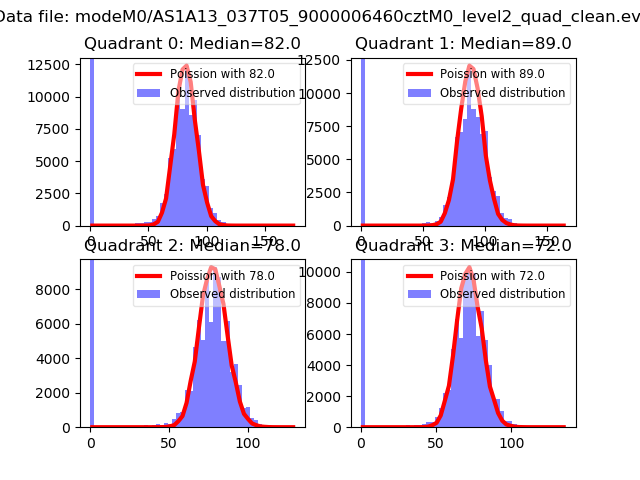 |
 |
| Quadrant-wise count rates Data is divided into 100 sec bins |
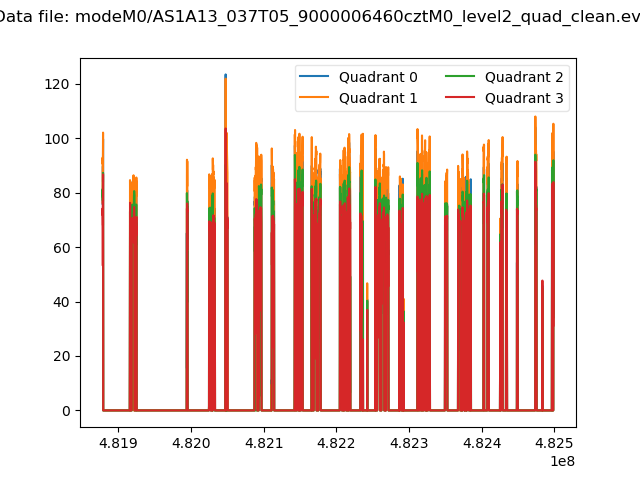 |
|
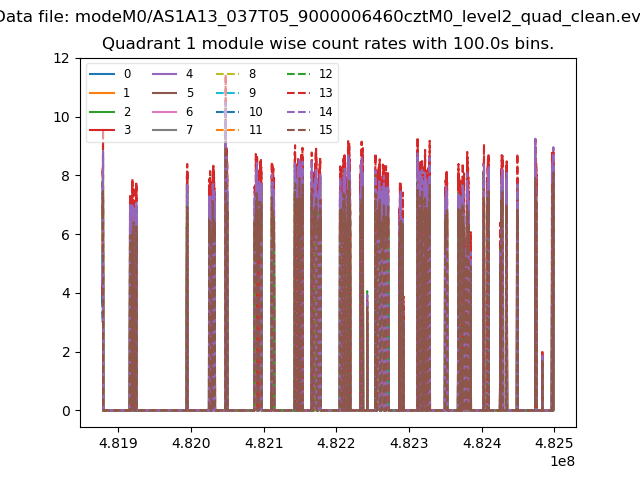
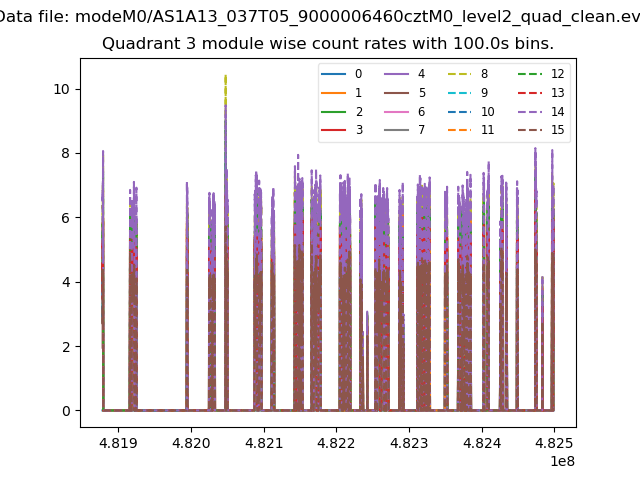
| Module-wise count rates for Quadrant A Data is divided into 100 sec bins |
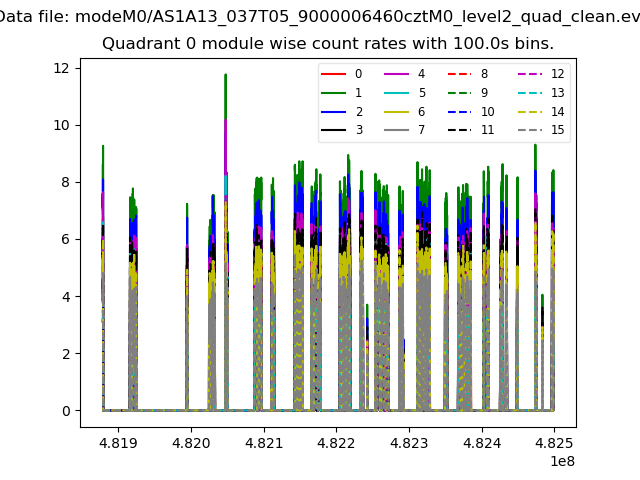 |
 |
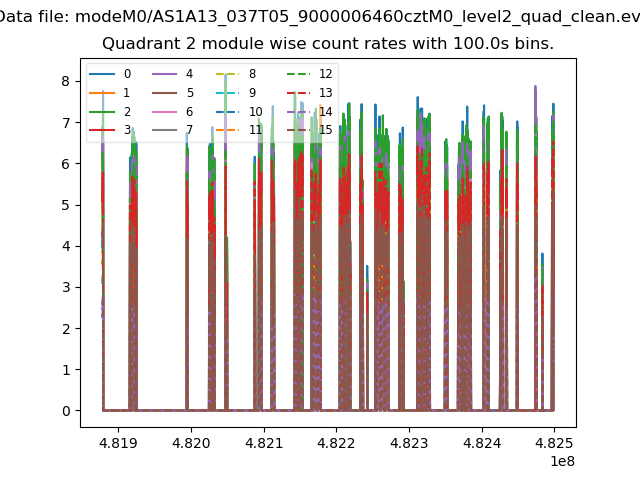
| Module-wise count rates for Quadrant B Data is divided into 100 sec bins |
 |
 |
| Module-wise count rates for Quadrant C Data is divided into 100 sec bins |
 |
 |
| Module-wise count rates for Quadrant D Data is divided into 100 sec bins |
 |
 |
| Parameter | Plot |
|---|---|
| CZT HV Monitor | 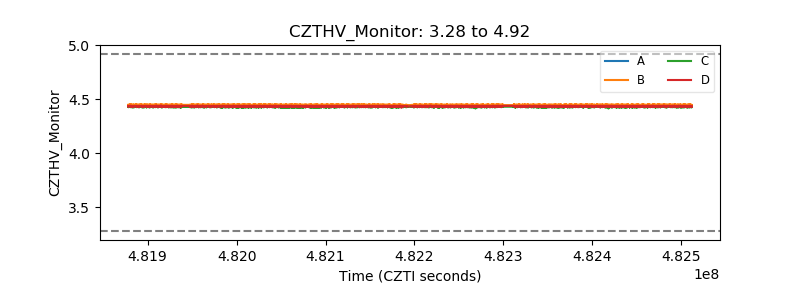 |
| D_VDD | 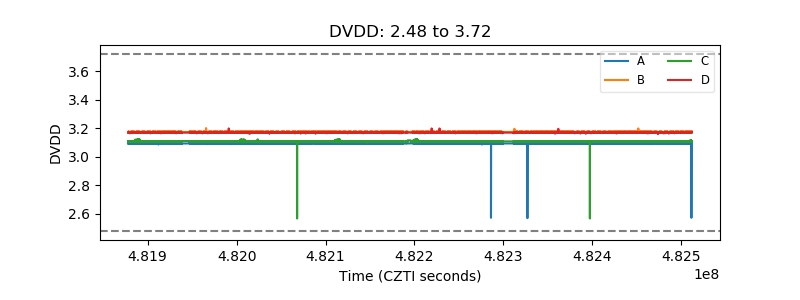 |
| Temperature 1 | 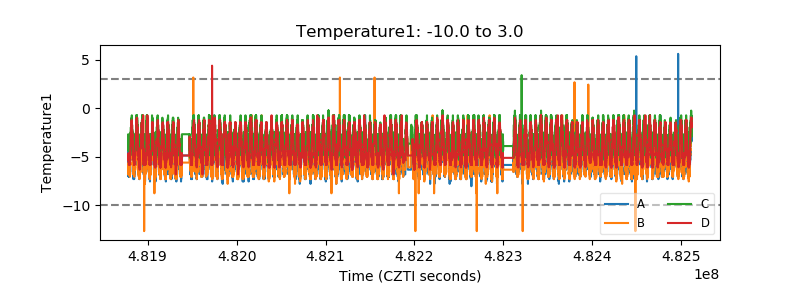 |
| Veto HV Monitor | 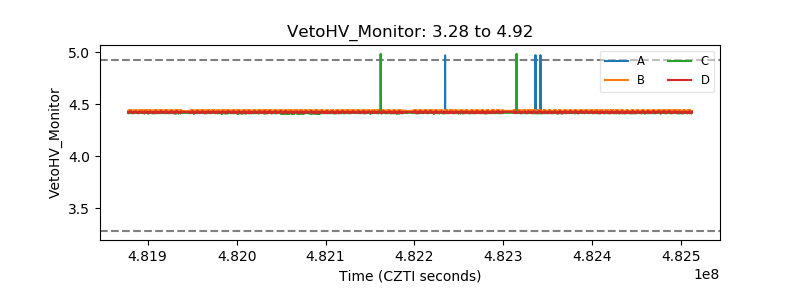 |
| Veto LLD | 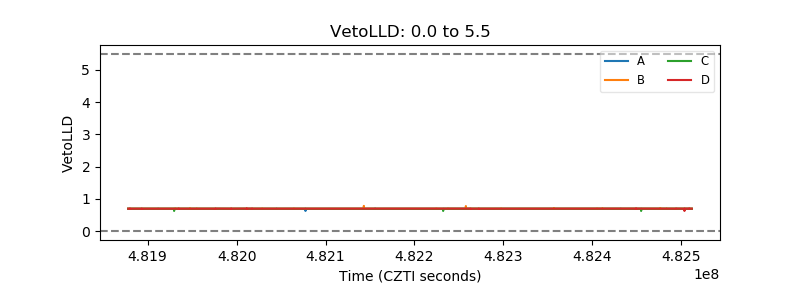 |
| Alpha Counter | 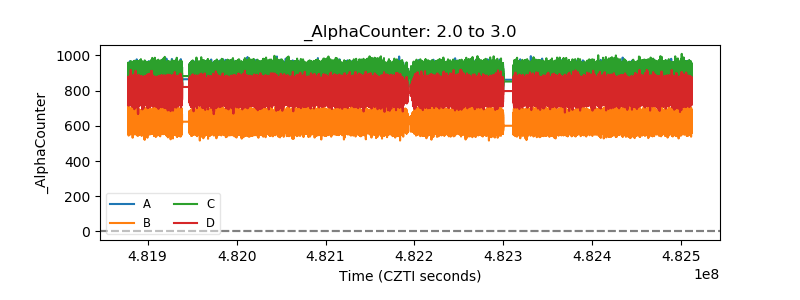 |
| _CPM_Rate | 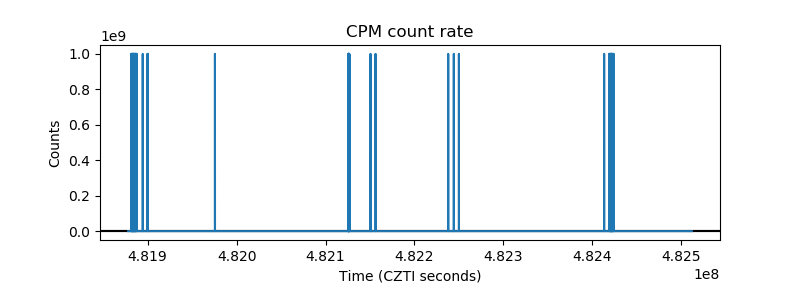 |
| CZT Counter | 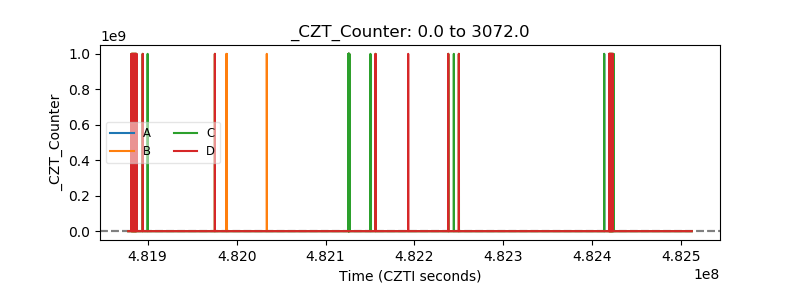 |
| +2.5 Volts monitor | 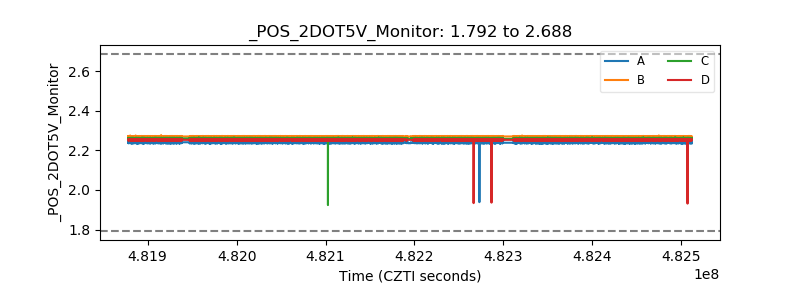 |
| +5 Volts monitor | 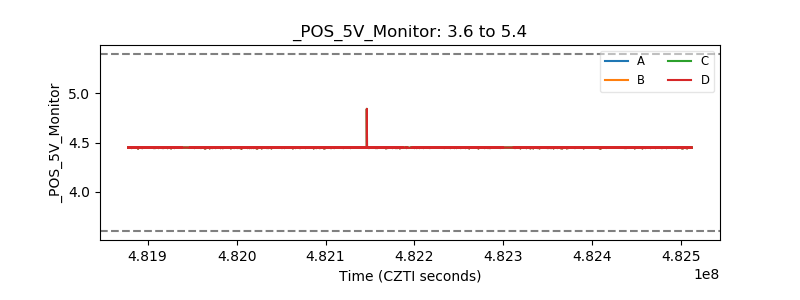 |
| _ROLL_ROT | 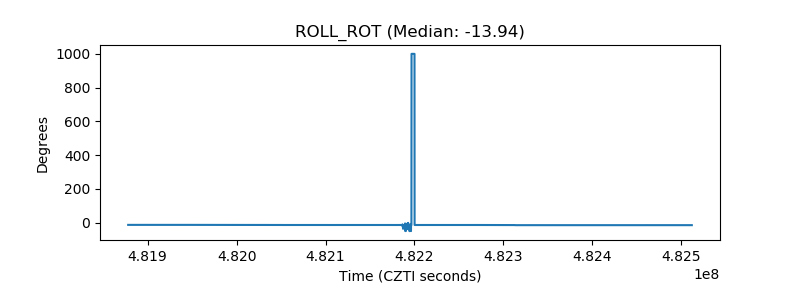 |
| _Roll_DEC | 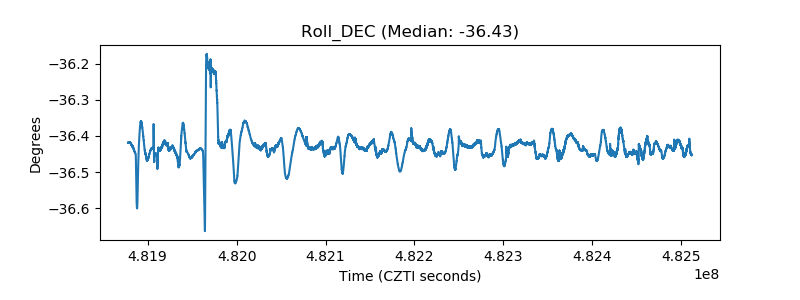 |
| _Roll_RA | 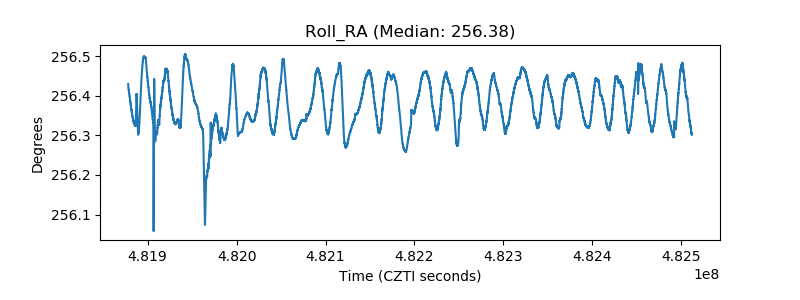 |
| Veto Counter | 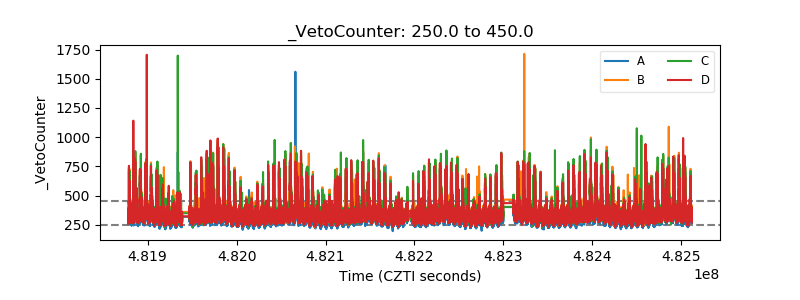 |