| Param | Original file | Final file |
|---|---|---|
| Filename | modeM0/AS1A13_037T05_9000006460_51551cztM0_level2.fits | modeM0/AS1A13_037T05_9000006460_51551cztM0_level2_quad_clean.evt |
| Size (bytes) | 707,849,280 | 111,490,560 |
| Size | 675.1 MB | 106.3 MB |
| Events in quadrant A | 8,024,060 | 711,645 |
| Events in quadrant B | 6,465,140 | 763,351 |
| Events in quadrant C | 4,278,256 | 720,506 |
| Events in quadrant D | 6,831,870 | 638,453 |
| Mode M9 | |||
|---|---|---|---|
| Quadrant | BADHDUFLAG | Total packets | Discarded packets |
| A | 0 | 19 | 0 |
| B | 0 | 19 | 0 |
| C | 0 | 19 | 0 |
| D | 0 | 19 | 0 |
| Mode M0 | |||
|---|---|---|---|
| Quadrant | BADHDUFLAG | Total packets | Discarded packets |
| A | 0 | 29276 | 2 |
| B | 0 | 24418 | 2 |
| C | 0 | 18284 | 2 |
| D | 0 | 25695 | 2 |
| Mode SS | |||
|---|---|---|---|
| Quadrant | BADHDUFLAG | Total packets | Discarded packets |
| A | 0 | 160 | 0 |
| B | 0 | 160 | 0 |
| C | 0 | 160 | 0 |
| D | 0 | 160 | 0 |
| Quadrant | Total seconds | Saturated seconds | Saturation percentage |
|---|---|---|---|
| A | 7792 | 735 | 9.432752% |
| B | 7792 | 846 | 10.857290% |
| C | 7791 | 292 | 3.747914% |
| D | 7791 | 772 | 9.908869% |
Noise dominated data is calculated using 1-second bins in cleaned event files. If a bin has >2000 counts, and if more than 50% of those come from <1% of pixels, then it is considered to be noise-dominated and hence unusable.
| Quadrant | # 1 sec bins | Bins with >0 counts | Bins with >2000 counts | High rate bins dominated by noise | Noise dominated (total time) | Noise dominated (detector-on time) | Marked lightcurve |
|---|---|---|---|---|---|---|---|
| A | 9707 | 7792 | 451 | 451 | 4.65% | 5.79% | 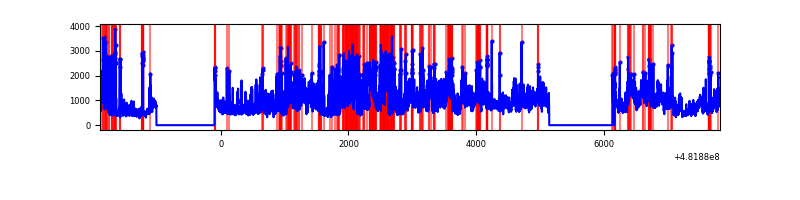 |
| B | 9707 | 7794 | 634 | 634 | 6.53% | 8.13% | 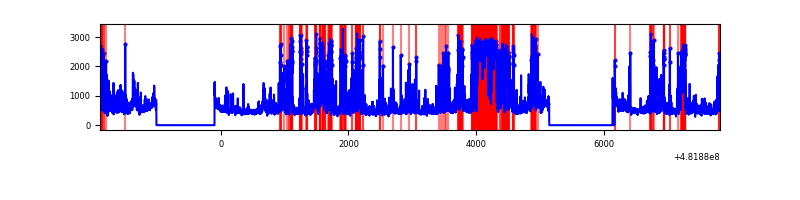 |
| C | 9706 | 7792 | 172 | 172 | 1.77% | 2.21% | 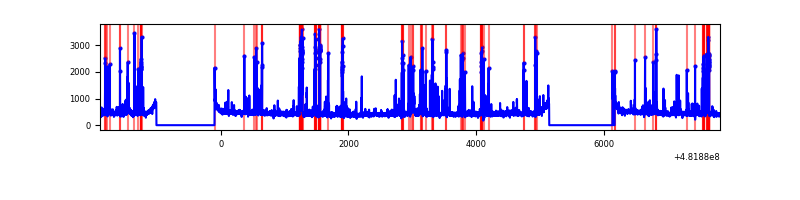 |
| D | 9706 | 7792 | 682 | 682 | 7.03% | 8.75% | 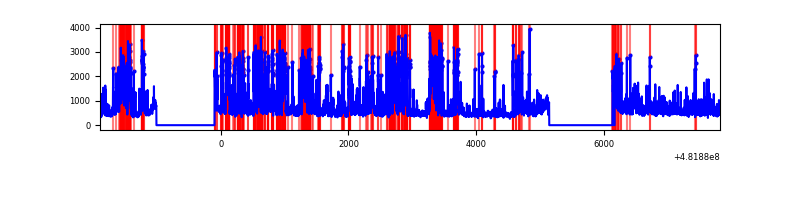 |
Top three noisy pixels from each quadrant. If the there are fewer than three noisy pixels in the level2.evt file, extra rows are filled as -1
| Pixel properties | Quadrant properties | ||||||
|---|---|---|---|---|---|---|---|
| Quadrant | DetID | PixID | Counts | Sigma | Mean | Median | Sigma |
| A | 12 | 3 | 1925144 | 9149.93 | 845 | 825 | 210.3 |
| A | 12 | 250 | 763112 | 3624.59 | 845 | 825 | 210.3 |
| A | 15 | 32 | 502000 | 2383.03 | 845 | 825 | 210.3 |
| B | 10 | 44 | 2284970 | 12956.89 | 827 | 799 | 176.3 |
| B | 0 | 171 | 208596 | 1178.72 | 827 | 799 | 176.3 |
| B | 5 | 173 | 133767 | 754.26 | 827 | 799 | 176.3 |
| C | 13 | 3 | 586960 | 2525.41 | 842 | 835 | 232.1 |
| C | 15 | 1 | 181468 | 778.29 | 842 | 835 | 232.1 |
| C | 3 | 233 | 50112 | 212.32 | 842 | 835 | 232.1 |
| D | 8 | 176 | 1490309 | 6491.01 | 817 | 789 | 229.5 |
| D | 6 | 42 | 1032373 | 4495.42 | 817 | 789 | 229.5 |
| D | 12 | 6 | 677267 | 2947.95 | 817 | 789 | 229.5 |
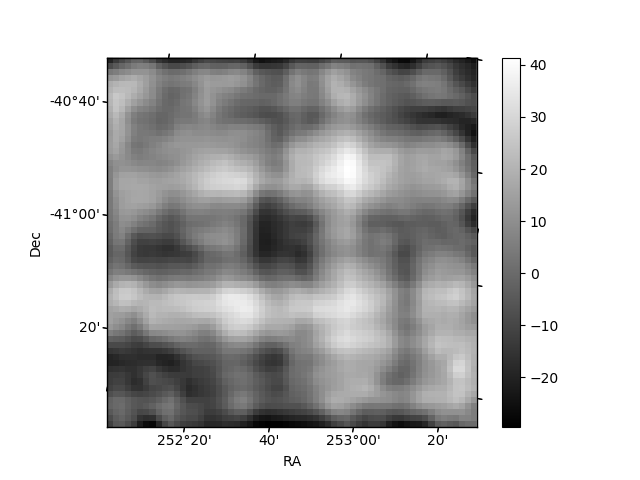
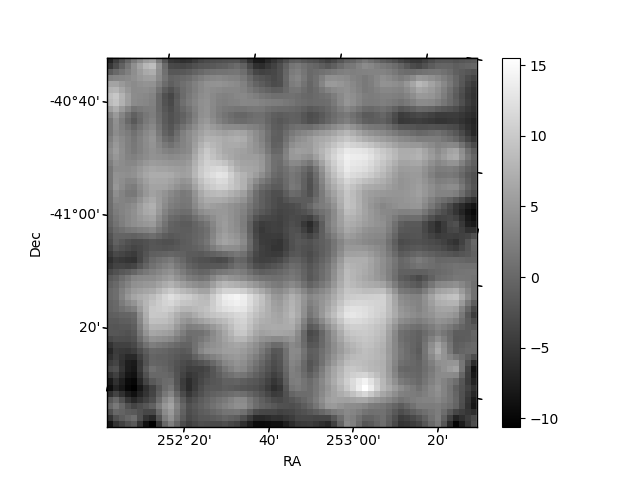
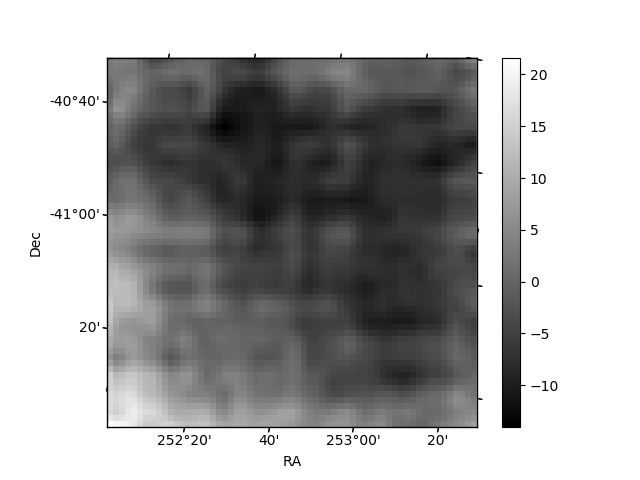
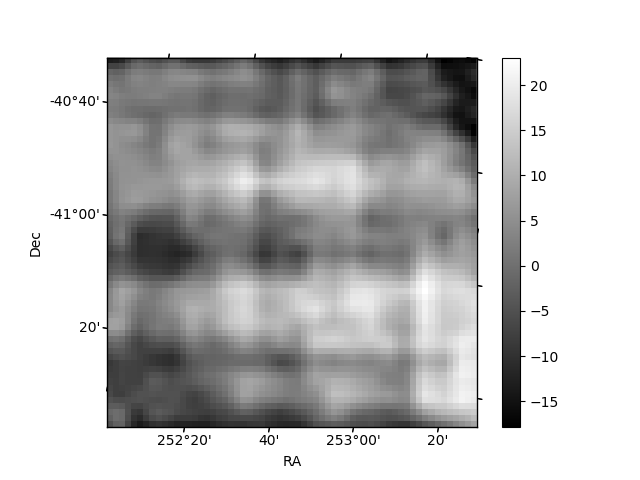
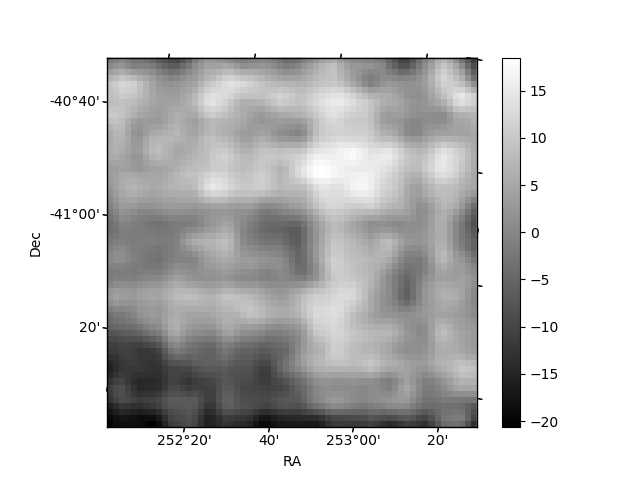
Histogram calculated using DETX and DETY for each event in the final _common_clean file
| Quadrant A | 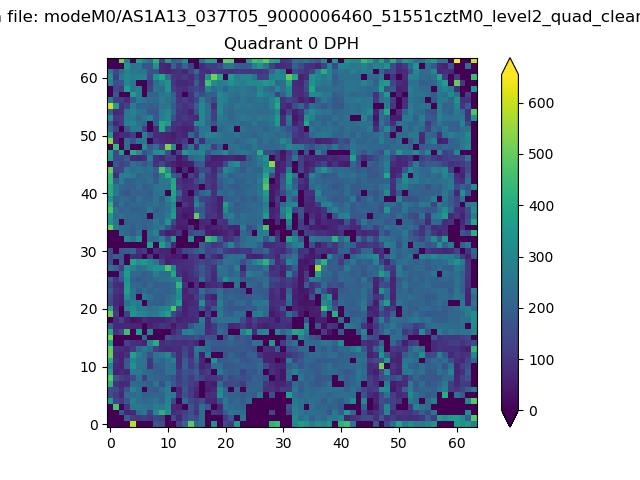 |
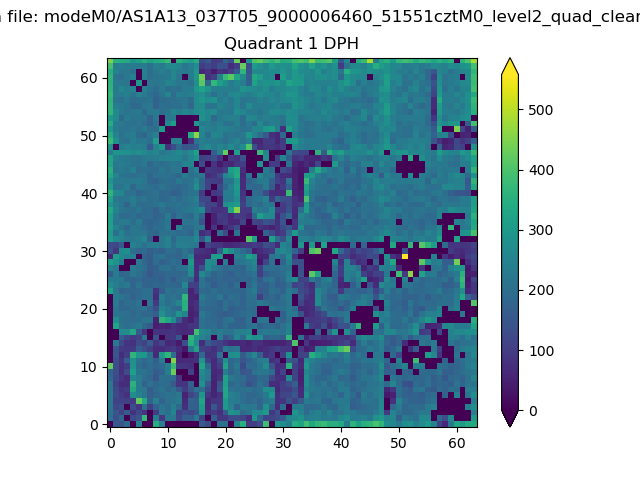 |
Quadrant B |
|---|---|---|---|
| Quadrant D | 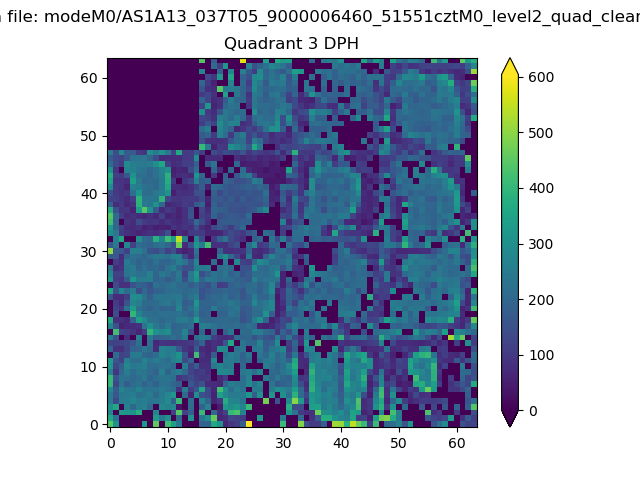 |
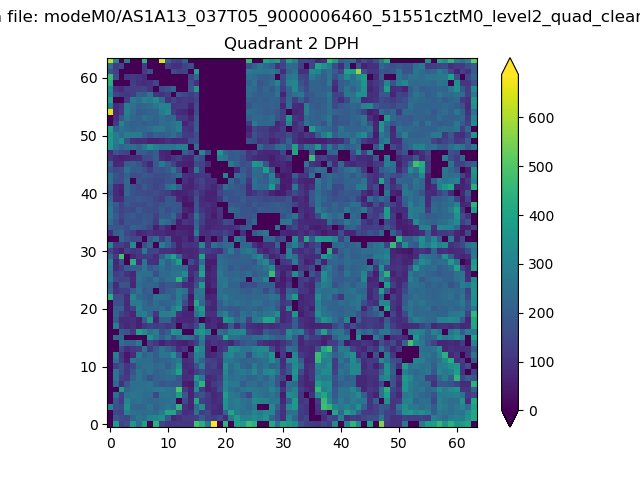 |
Quadrant C |
| Plot type | Count rate plots | Images |
|---|---|---|
| Comparison with Poisson distribution Blue bars denote a histogram of data divided into 1 sec bins. Red curve is a Poisson curve with rate = median count rate of data. |
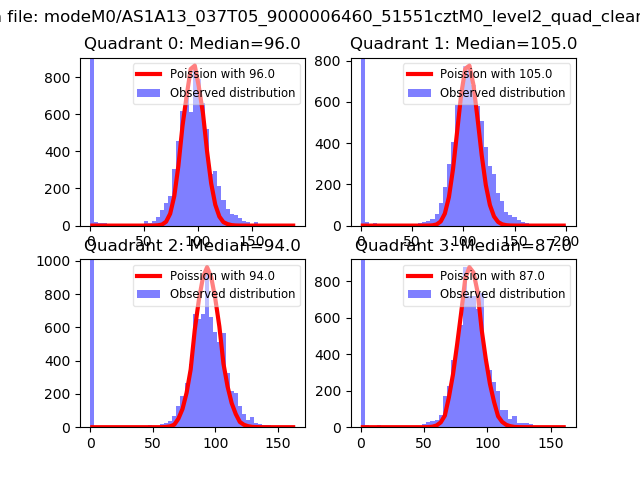 |
 |
| Quadrant-wise count rates Data is divided into 100 sec bins |
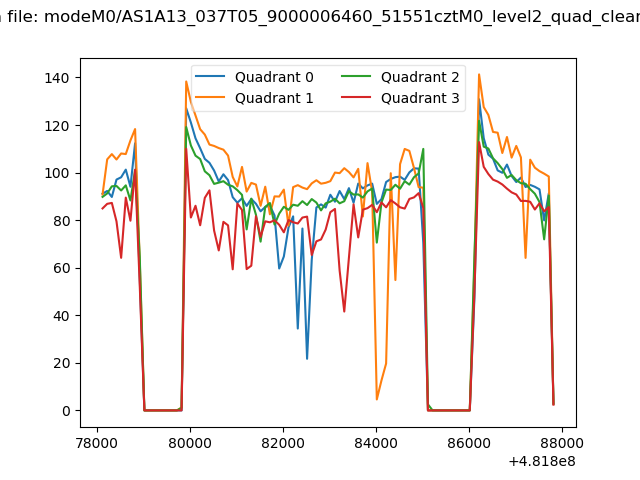 |
|
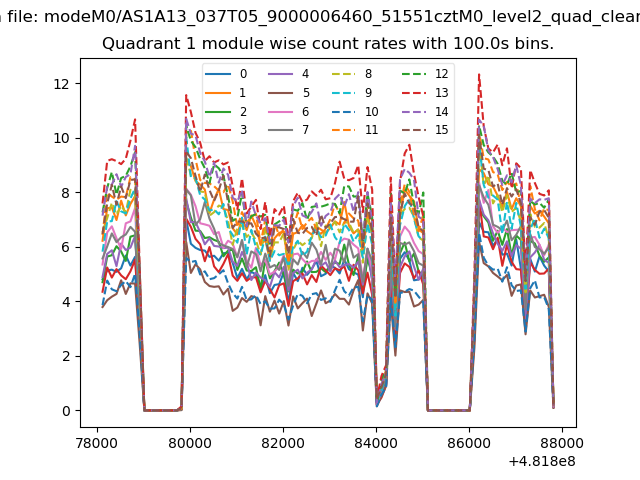
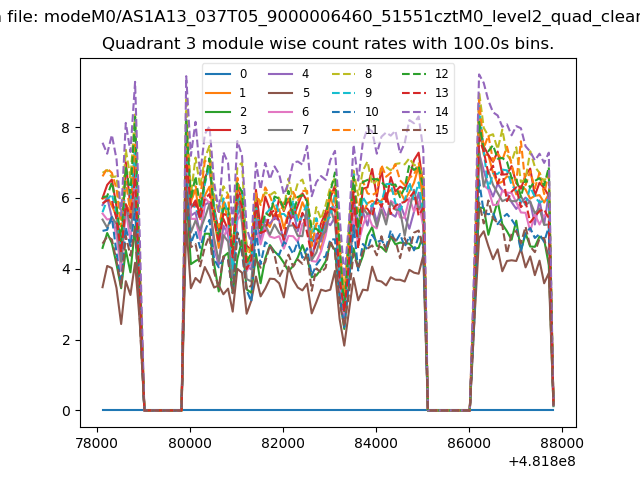
| Module-wise count rates for Quadrant A Data is divided into 100 sec bins |
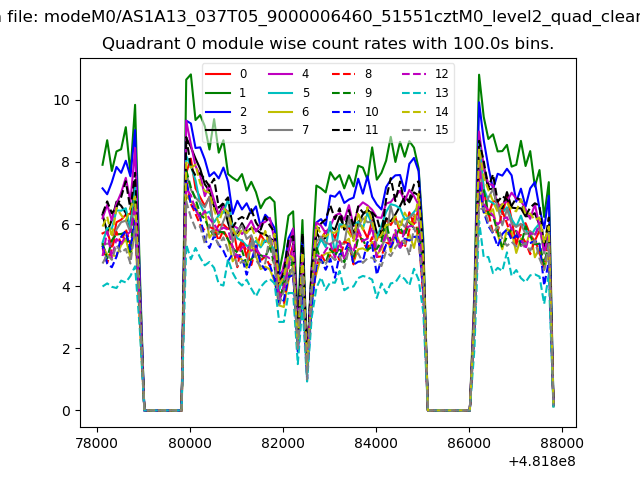 |
 |
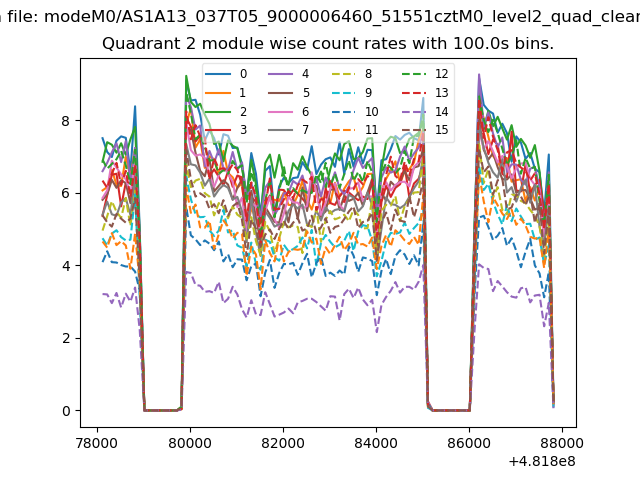
| Module-wise count rates for Quadrant B Data is divided into 100 sec bins |
 |
 |
| Module-wise count rates for Quadrant C Data is divided into 100 sec bins |
 |
 |
| Module-wise count rates for Quadrant D Data is divided into 100 sec bins |
 |
 |
| Parameter | Plot |
|---|---|
| CZT HV Monitor | 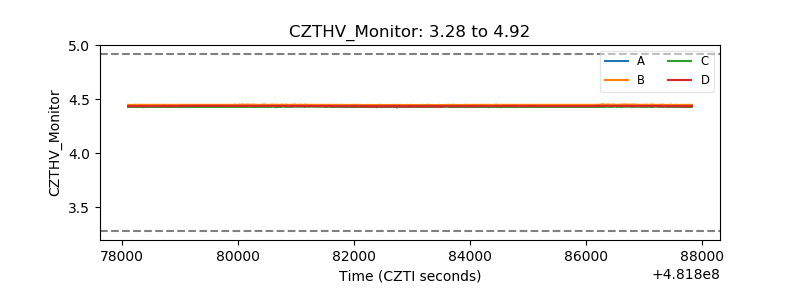 |
| D_VDD | 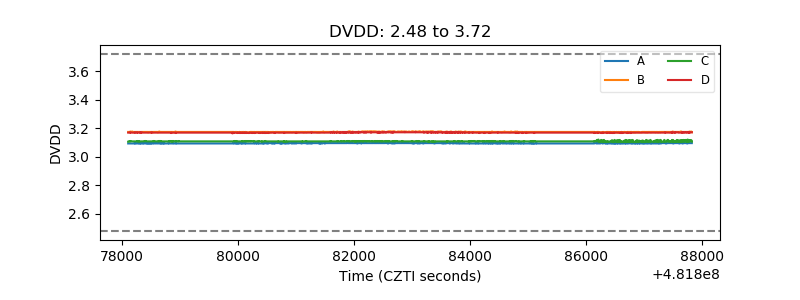 |
| Temperature 1 | 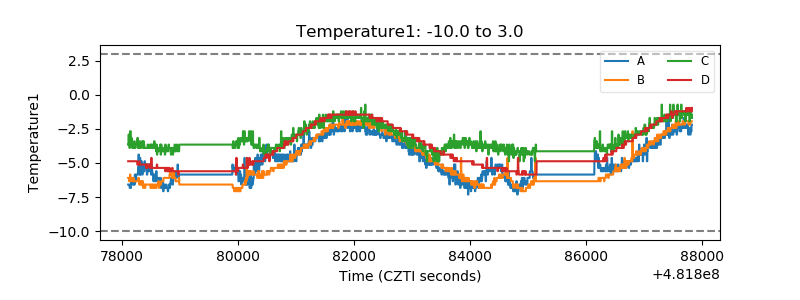 |
| Veto HV Monitor | 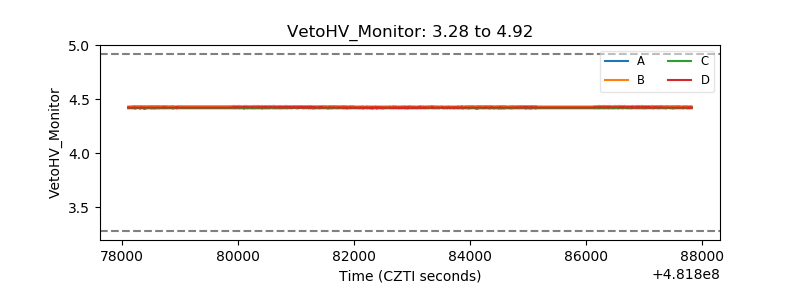 |
| Veto LLD | 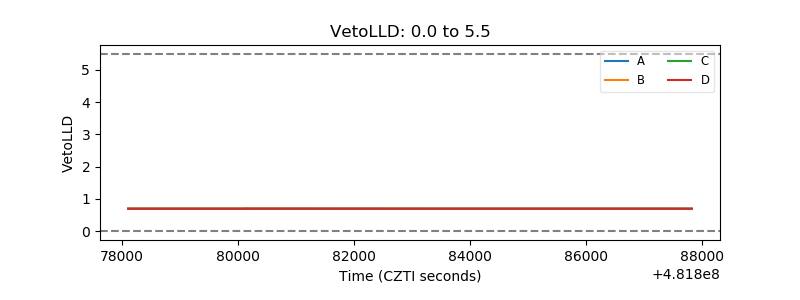 |
| Alpha Counter | 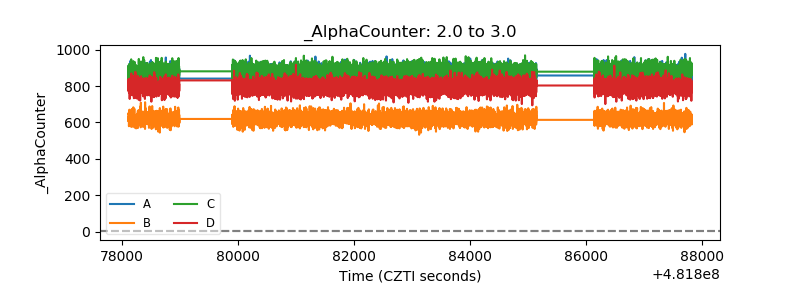 |
| _CPM_Rate | 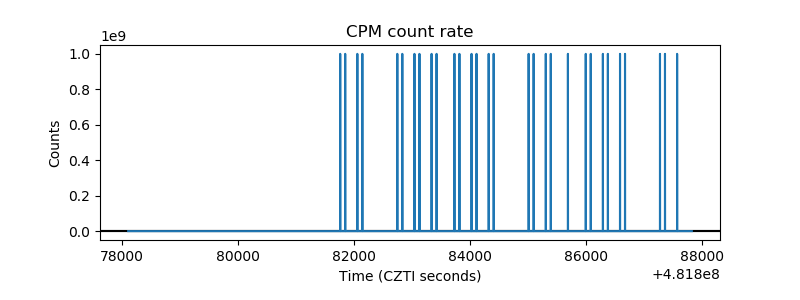 |
| CZT Counter | 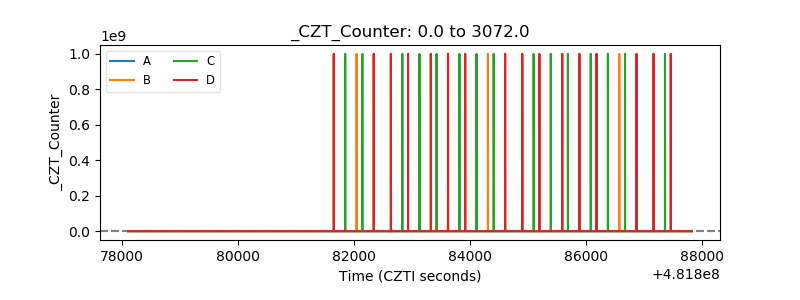 |
| +2.5 Volts monitor | 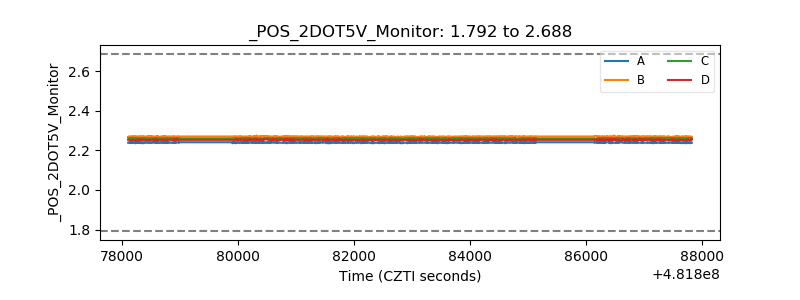 |
| +5 Volts monitor | 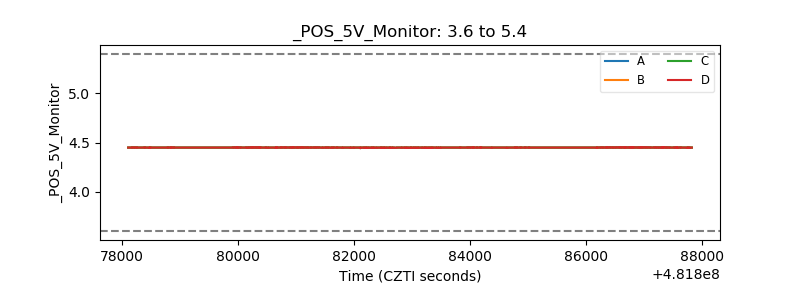 |
| _ROLL_ROT | 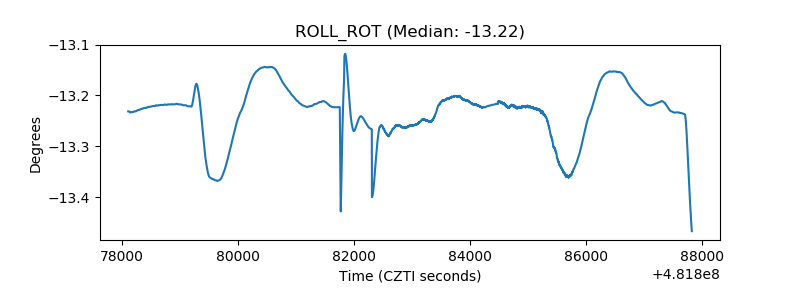 |
| _Roll_DEC | 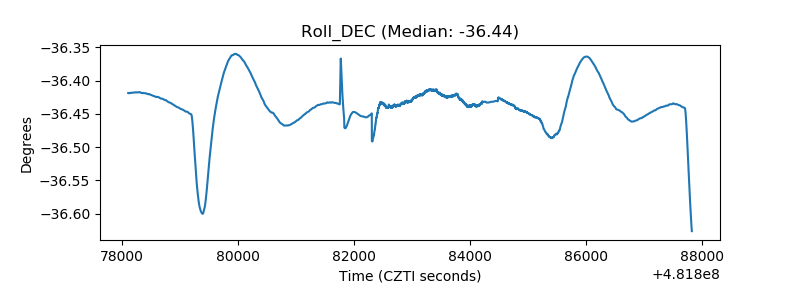 |
| _Roll_RA | 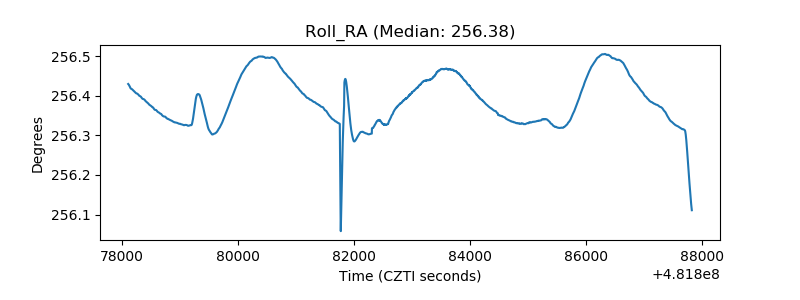 |
| Veto Counter | 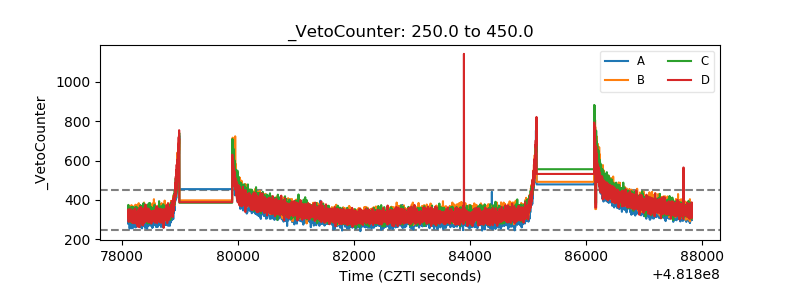 |