| Param | Original file | Final file |
|---|---|---|
| Filename | modeM0/AS1A13_037T05_9000006460_51552cztM0_level2.fits | modeM0/AS1A13_037T05_9000006460_51552cztM0_level2_quad_clean.evt |
| Size (bytes) | 756,564,480 | 79,992,000 |
| Size | 721.5 MB | 76.3 MB |
| Events in quadrant A | 13,164,400 | 230,183 |
| Events in quadrant B | 6,524,862 | 600,491 |
| Events in quadrant C | 3,242,717 | 601,003 |
| Events in quadrant D | 4,579,857 | 545,723 |
| Mode M9 | |||
|---|---|---|---|
| Quadrant | BADHDUFLAG | Total packets | Discarded packets |
| A | 0 | 11 | 0 |
| B | 0 | 11 | 0 |
| C | 0 | 11 | 0 |
| D | 0 | 11 | 0 |
| Mode M0 | |||
|---|---|---|---|
| Quadrant | BADHDUFLAG | Total packets | Discarded packets |
| A | 0 | 43481 | 7 |
| B | 0 | 23772 | 1 |
| C | 0 | 14281 | 1 |
| D | 0 | 17919 | 1 |
| Mode SS | |||
|---|---|---|---|
| Quadrant | BADHDUFLAG | Total packets | Discarded packets |
| A | 0 | 130 | 0 |
| B | 0 | 130 | 0 |
| C | 0 | 130 | 0 |
| D | 0 | 130 | 0 |
| Quadrant | Total seconds | Saturated seconds | Saturation percentage |
|---|---|---|---|
| A | 6370 | 4148 | 65.117739% |
| B | 6370 | 980 | 15.384615% |
| C | 6370 | 130 | 2.040816% |
| D | 6371 | 297 | 4.661749% |
Noise dominated data is calculated using 1-second bins in cleaned event files. If a bin has >2000 counts, and if more than 50% of those come from <1% of pixels, then it is considered to be noise-dominated and hence unusable.
| Quadrant | # 1 sec bins | Bins with >0 counts | Bins with >2000 counts | High rate bins dominated by noise | Noise dominated (total time) | Noise dominated (detector-on time) | Marked lightcurve |
|---|---|---|---|---|---|---|---|
| A | 7444 | 6369 | 3990 | 3990 | 53.60% | 62.65% | 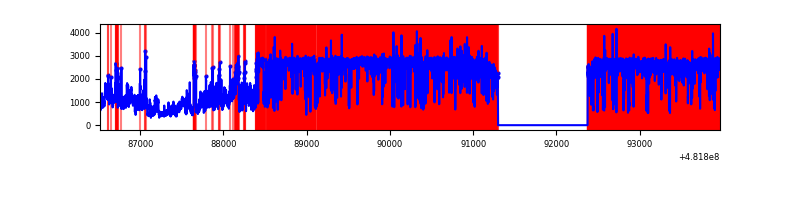 |
| B | 7445 | 6370 | 753 | 753 | 10.11% | 11.82% | 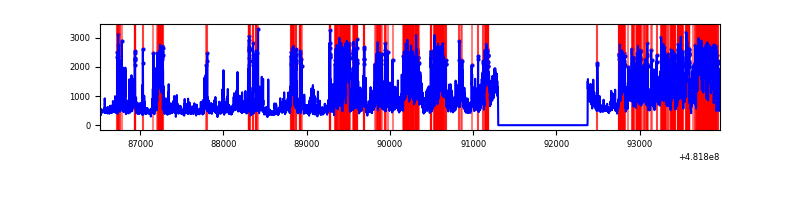 |
| C | 7445 | 6370 | 73 | 73 | 0.98% | 1.15% | 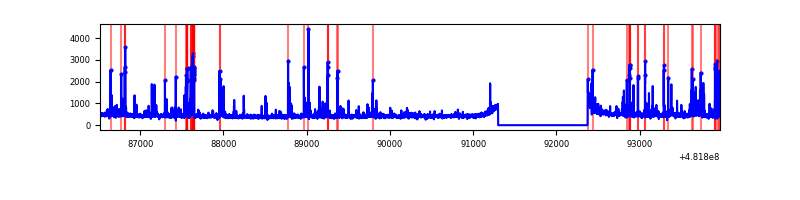 |
| D | 7446 | 6371 | 244 | 244 | 3.28% | 3.83% | 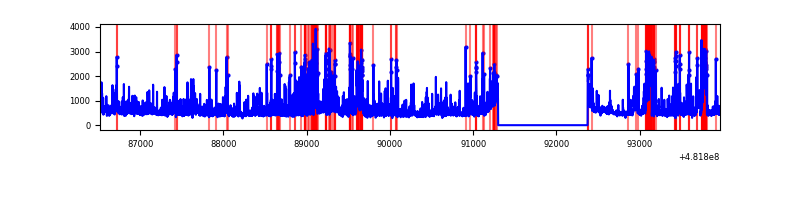 |
Top three noisy pixels from each quadrant. If the there are fewer than three noisy pixels in the level2.evt file, extra rows are filled as -1
| Pixel properties | Quadrant properties | ||||||
|---|---|---|---|---|---|---|---|
| Quadrant | DetID | PixID | Counts | Sigma | Mean | Median | Sigma |
| A | 15 | 32 | 9049957 | 86402.14 | 423 | 413 | 104.7 |
| A | 12 | 3 | 1632189 | 15579.67 | 423 | 413 | 104.7 |
| A | 12 | 194 | 198586 | 1892.09 | 423 | 413 | 104.7 |
| B | 10 | 44 | 2739053 | 19299.77 | 670 | 646 | 141.9 |
| B | 0 | 171 | 300986 | 2116.74 | 670 | 646 | 141.9 |
| B | 1 | 207 | 149072 | 1046.08 | 670 | 646 | 141.9 |
| C | 13 | 3 | 391197 | 2070.74 | 689 | 683 | 188.6 |
| C | 3 | 233 | 39161 | 204.03 | 689 | 683 | 188.6 |
| C | 14 | 245 | 15644 | 79.33 | 689 | 683 | 188.6 |
| D | 8 | 176 | 769929 | 4068.59 | 674 | 649 | 189.1 |
| D | 12 | 6 | 306737 | 1618.85 | 674 | 649 | 189.1 |
| D | 6 | 42 | 254620 | 1343.21 | 674 | 649 | 189.1 |
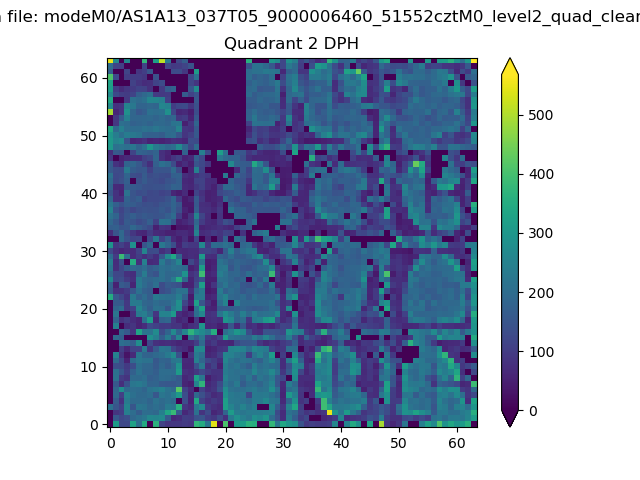
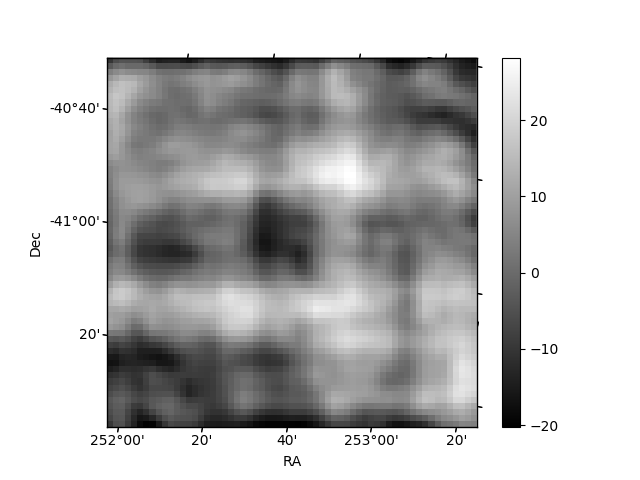
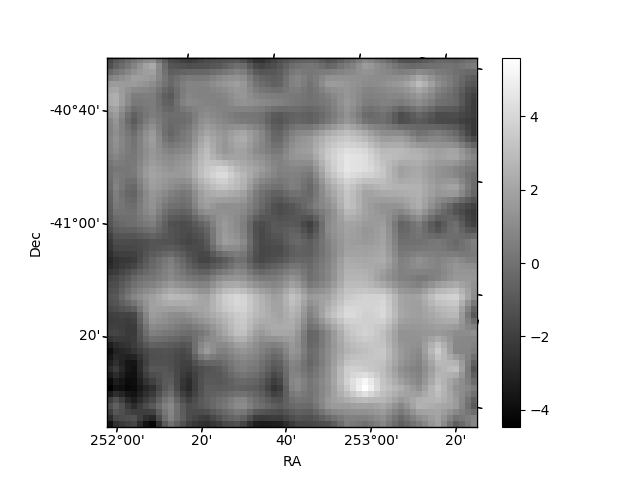
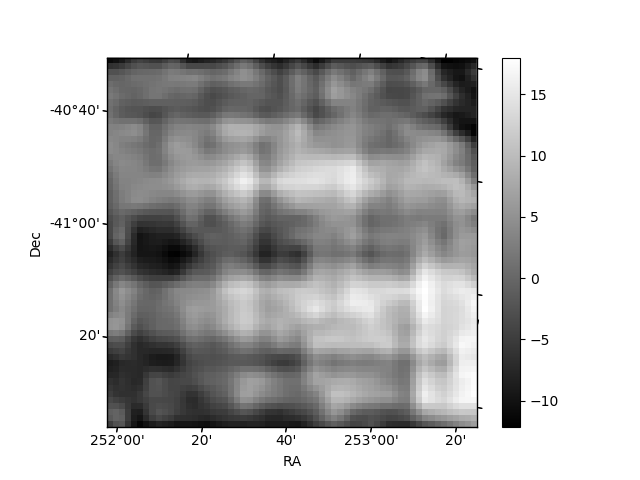
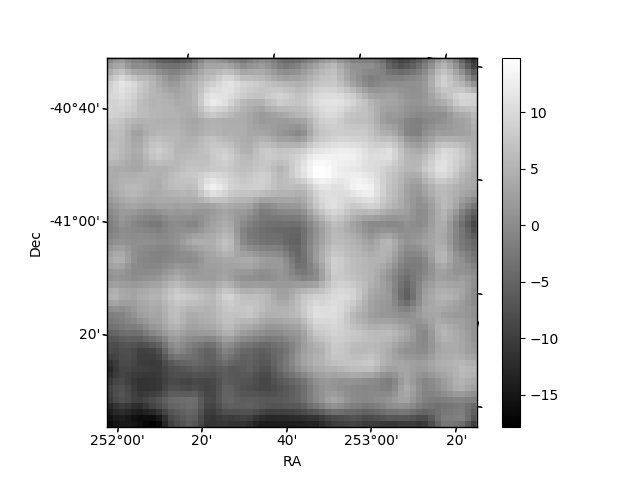
Histogram calculated using DETX and DETY for each event in the final _common_clean file
| Quadrant A | 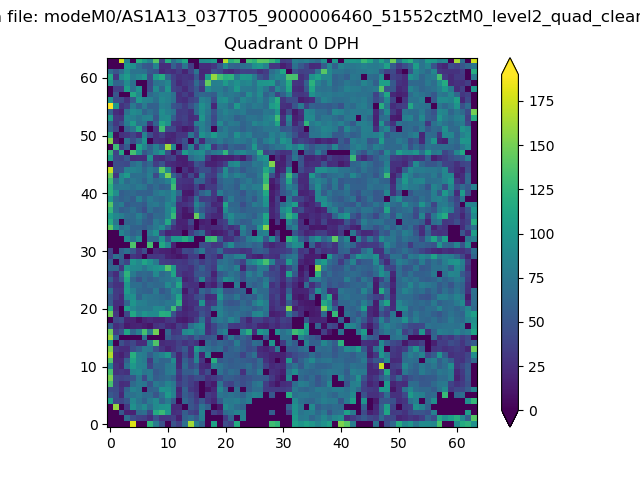 |
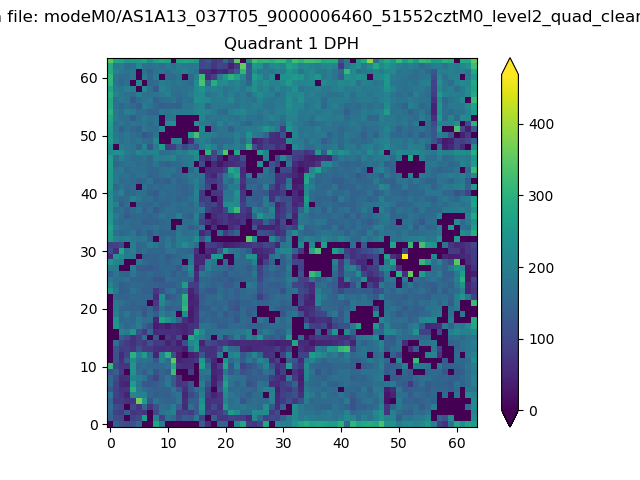 |
Quadrant B |
|---|---|---|---|
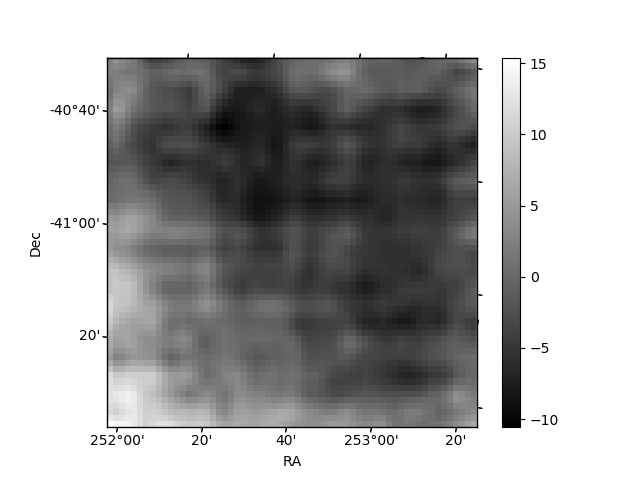
| Quadrant D | 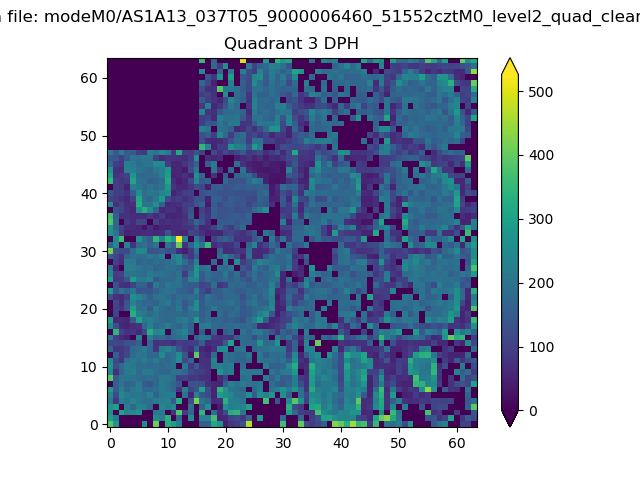 |
 |
Quadrant C |
| Plot type | Count rate plots | Images |
|---|---|---|
| Comparison with Poisson distribution Blue bars denote a histogram of data divided into 1 sec bins. Red curve is a Poisson curve with rate = median count rate of data. |
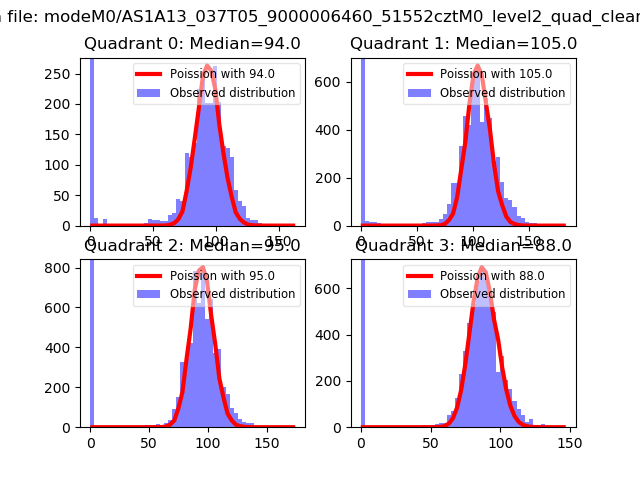 |
 |
| Quadrant-wise count rates Data is divided into 100 sec bins |
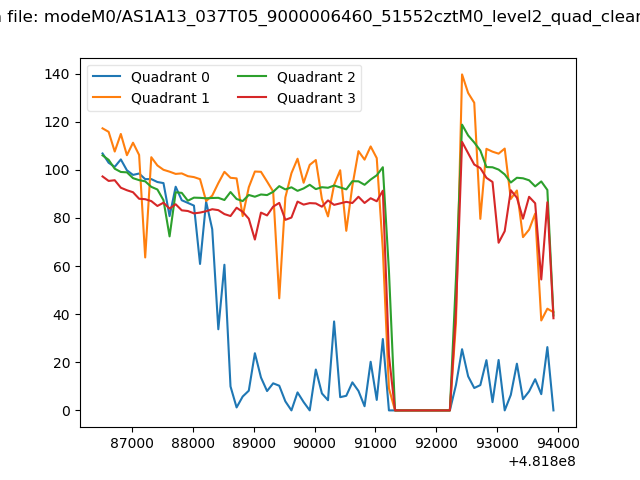 |
|
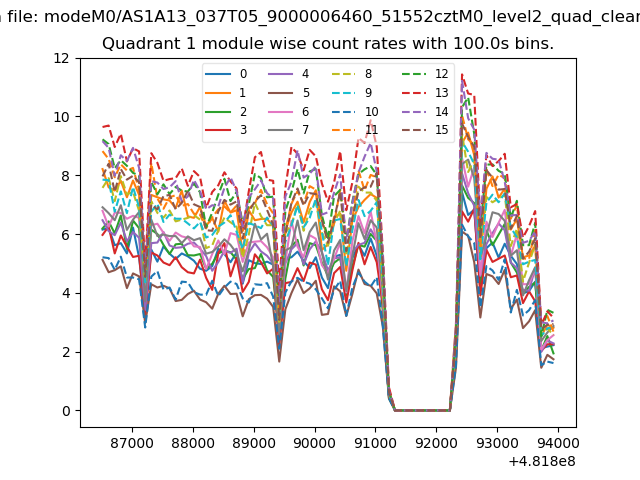
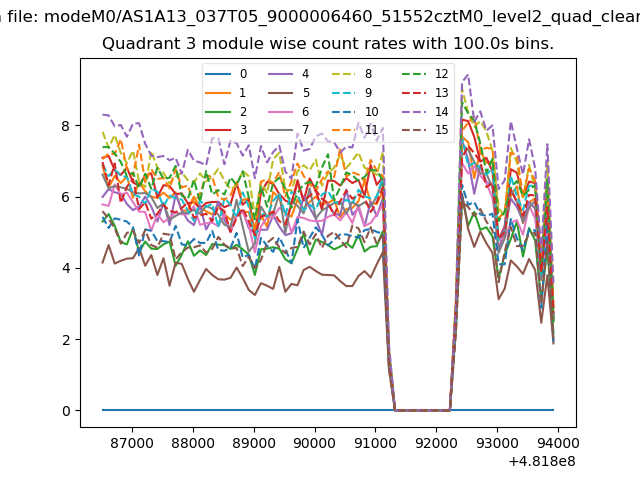
| Module-wise count rates for Quadrant A Data is divided into 100 sec bins |
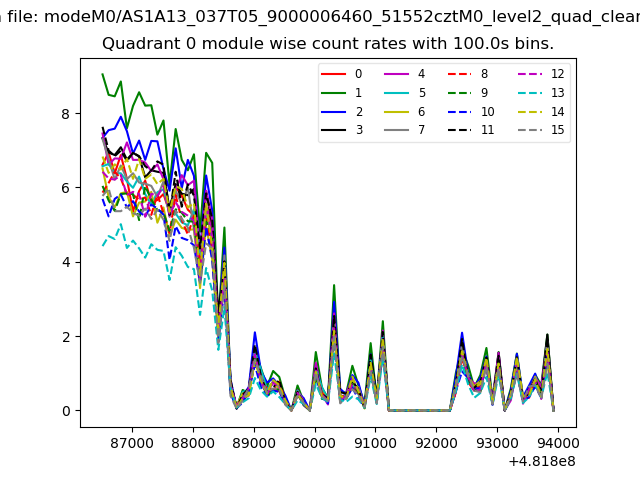 |
 |
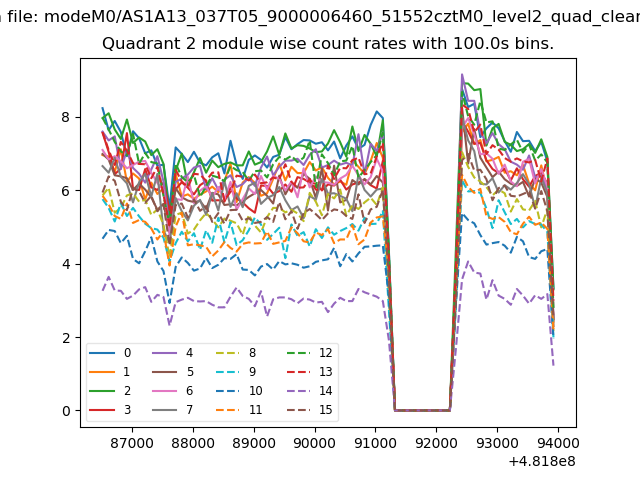
| Module-wise count rates for Quadrant B Data is divided into 100 sec bins |
 |
 |
| Module-wise count rates for Quadrant C Data is divided into 100 sec bins |
 |
 |
| Module-wise count rates for Quadrant D Data is divided into 100 sec bins |
 |
 |
| Parameter | Plot |
|---|---|
| CZT HV Monitor | 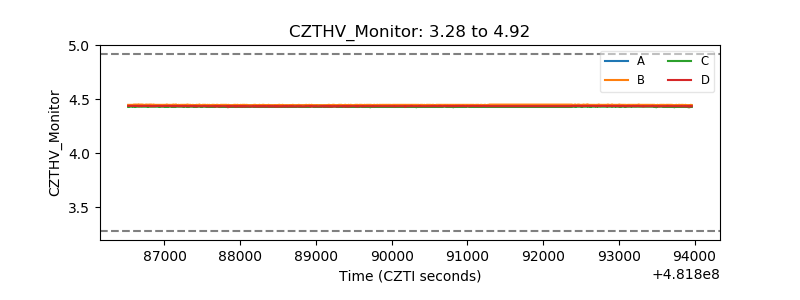 |
| D_VDD | 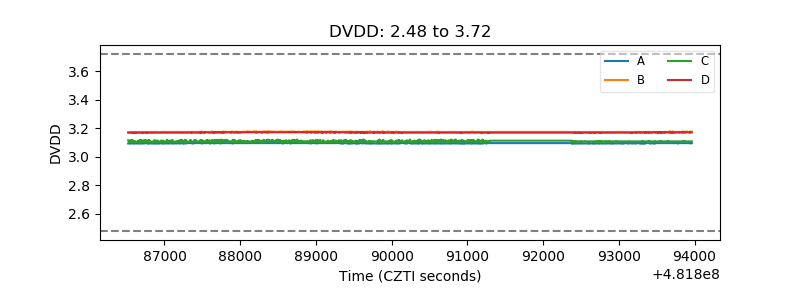 |
| Temperature 1 | 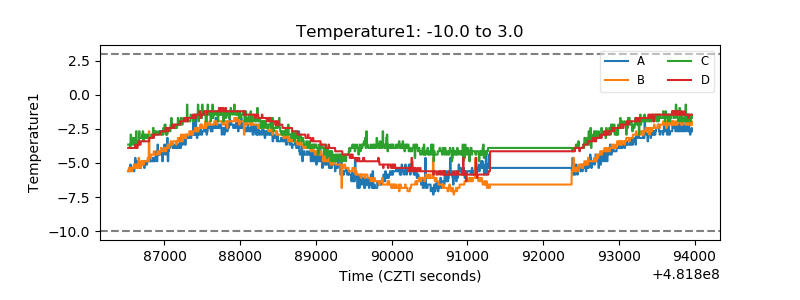 |
| Veto HV Monitor | 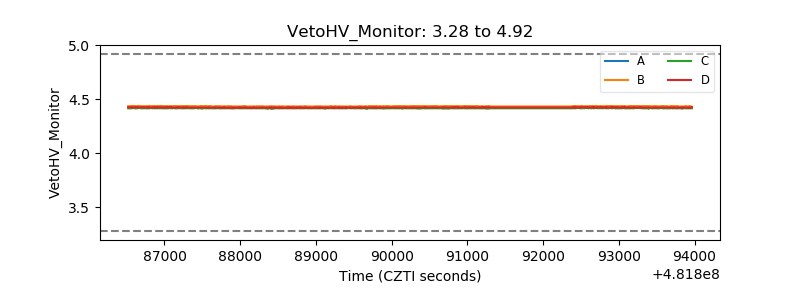 |
| Veto LLD | 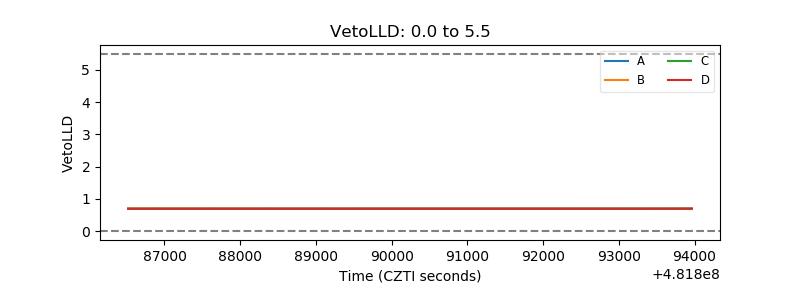 |
| Alpha Counter | 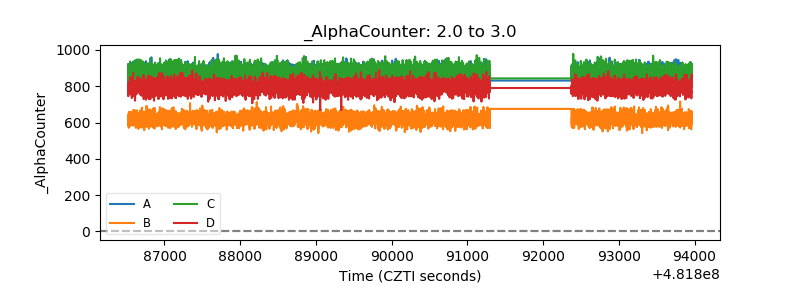 |
| _CPM_Rate |  |
| CZT Counter | 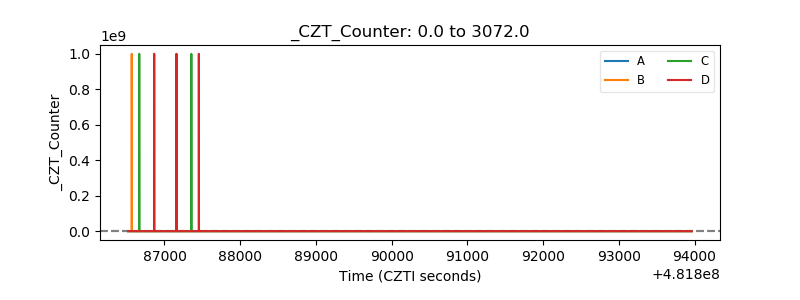 |
| +2.5 Volts monitor | 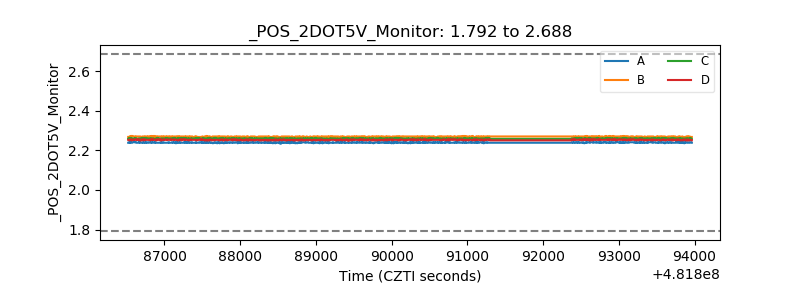 |
| +5 Volts monitor | 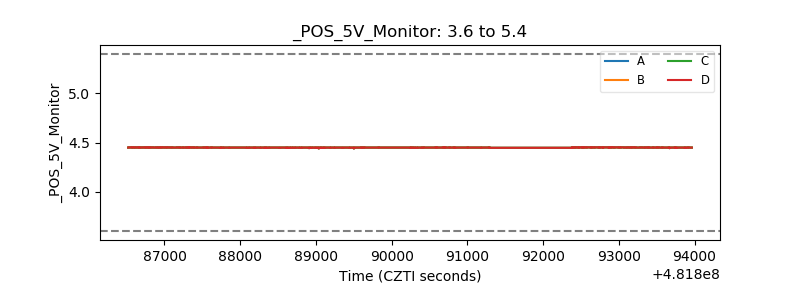 |
| _ROLL_ROT | 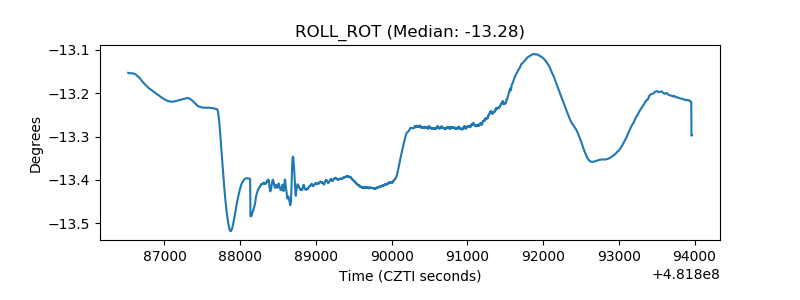 |
| _Roll_DEC | 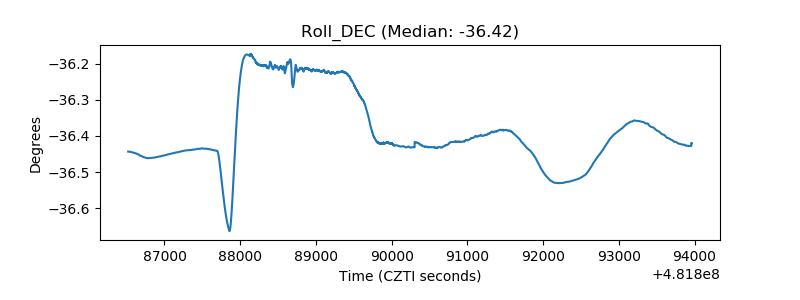 |
| _Roll_RA | 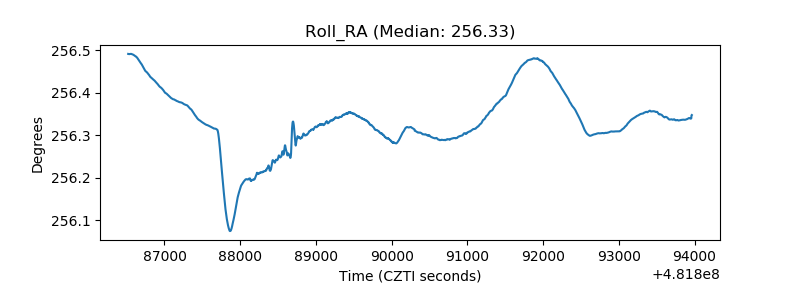 |
| Veto Counter | 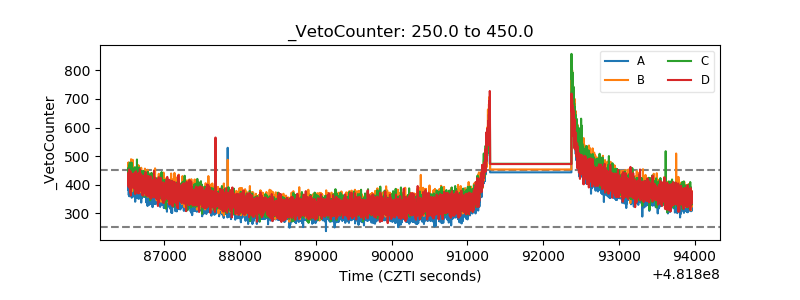 |