| Param | Original file | Final file |
|---|---|---|
| Filename | modeM0/AS1A13_037T05_9000006460_51553cztM0_level2.fits | modeM0/AS1A13_037T05_9000006460_51553cztM0_level2_quad_clean.evt |
| Size (bytes) | 715,731,840 | 81,074,880 |
| Size | 682.6 MB | 77.3 MB |
| Events in quadrant A | 11,281,345 | 323,803 |
| Events in quadrant B | 7,394,232 | 551,754 |
| Events in quadrant C | 3,145,598 | 598,151 |
| Events in quadrant D | 4,181,611 | 539,047 |
| Mode M9 | |||
|---|---|---|---|
| Quadrant | BADHDUFLAG | Total packets | Discarded packets |
| A | 0 | 11 | 0 |
| B | 0 | 11 | 0 |
| C | 0 | 11 | 0 |
| D | 0 | 11 | 0 |
| Mode M0 | |||
|---|---|---|---|
| Quadrant | BADHDUFLAG | Total packets | Discarded packets |
| A | 0 | 37916 | 1 |
| B | 0 | 26318 | 1 |
| C | 0 | 14004 | 1 |
| D | 0 | 16803 | 1 |
| Mode SS | |||
|---|---|---|---|
| Quadrant | BADHDUFLAG | Total packets | Discarded packets |
| A | 0 | 128 | 0 |
| B | 0 | 128 | 0 |
| C | 0 | 128 | 0 |
| D | 0 | 128 | 0 |
| Quadrant | Total seconds | Saturated seconds | Saturation percentage |
|---|---|---|---|
| A | 6335 | 3267 | 51.570639% |
| B | 6336 | 1413 | 22.301136% |
| C | 6336 | 112 | 1.767677% |
| D | 6336 | 391 | 6.171086% |
Noise dominated data is calculated using 1-second bins in cleaned event files. If a bin has >2000 counts, and if more than 50% of those come from <1% of pixels, then it is considered to be noise-dominated and hence unusable.
| Quadrant | # 1 sec bins | Bins with >0 counts | Bins with >2000 counts | High rate bins dominated by noise | Noise dominated (total time) | Noise dominated (detector-on time) | Marked lightcurve |
|---|---|---|---|---|---|---|---|
| A | 7425 | 6335 | 3089 | 3089 | 41.60% | 48.76% | 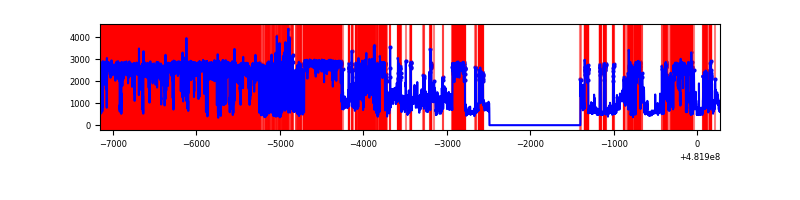 |
| B | 7426 | 6336 | 1110 | 1110 | 14.95% | 17.52% | 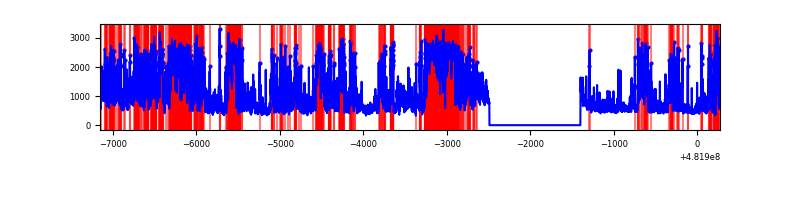 |
| C | 7426 | 6336 | 48 | 48 | 0.65% | 0.76% | 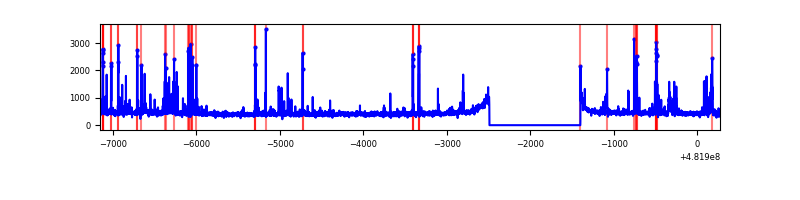 |
| D | 7426 | 6336 | 292 | 292 | 3.93% | 4.61% | 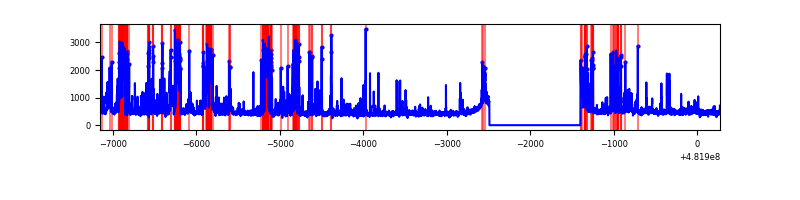 |
Top three noisy pixels from each quadrant. If the there are fewer than three noisy pixels in the level2.evt file, extra rows are filled as -1
| Pixel properties | Quadrant properties | ||||||
|---|---|---|---|---|---|---|---|
| Quadrant | DetID | PixID | Counts | Sigma | Mean | Median | Sigma |
| A | 15 | 32 | 6839124 | 53936.93 | 516 | 504 | 126.8 |
| A | 12 | 3 | 1298214 | 10235.18 | 516 | 504 | 126.8 |
| A | 12 | 250 | 341881 | 2692.48 | 516 | 504 | 126.8 |
| B | 10 | 44 | 3539013 | 25542.41 | 651 | 628 | 138.5 |
| B | 8 | 128 | 342584 | 2468.47 | 651 | 628 | 138.5 |
| B | 4 | 81 | 188931 | 1359.3 | 651 | 628 | 138.5 |
| C | 13 | 3 | 246847 | 1304.73 | 691 | 686 | 188.7 |
| C | 14 | 245 | 73829 | 387.68 | 691 | 686 | 188.7 |
| C | 1 | 12 | 18671 | 95.32 | 691 | 686 | 188.7 |
| D | 6 | 42 | 474259 | 2583.16 | 670 | 648 | 183.3 |
| D | 12 | 6 | 267284 | 1454.28 | 670 | 648 | 183.3 |
| D | 8 | 176 | 205153 | 1115.41 | 670 | 648 | 183.3 |
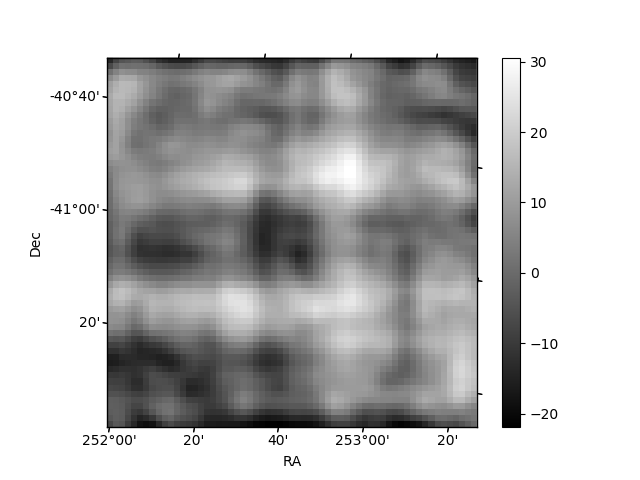
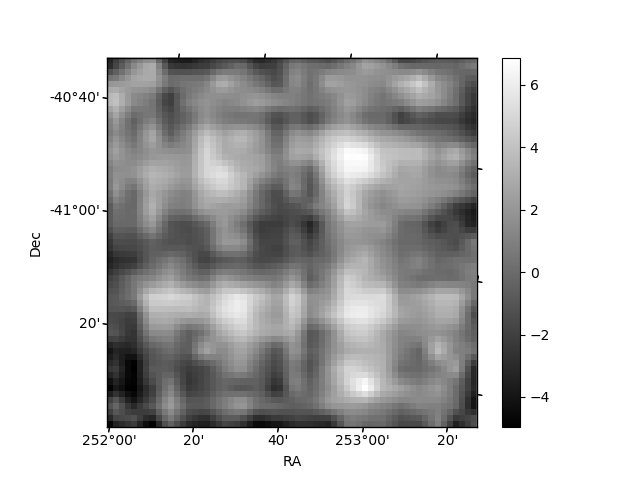
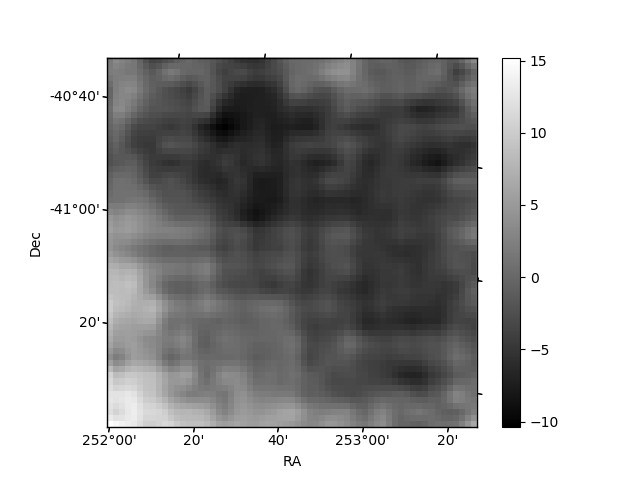
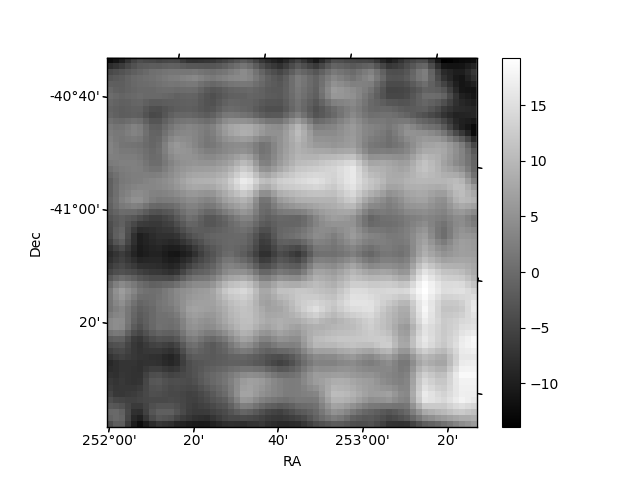
Histogram calculated using DETX and DETY for each event in the final _common_clean file
| Quadrant A | 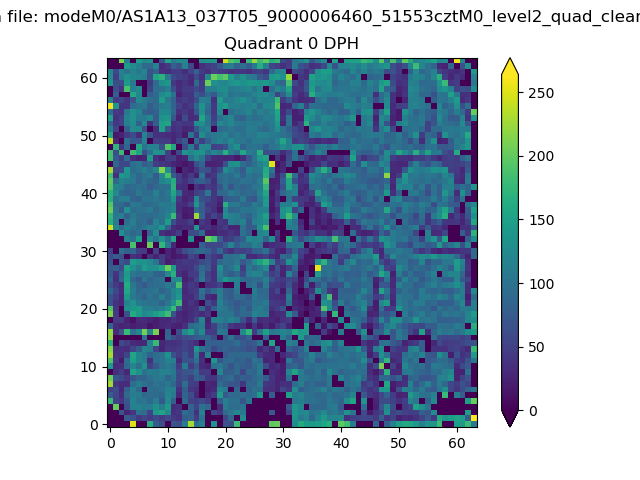 |
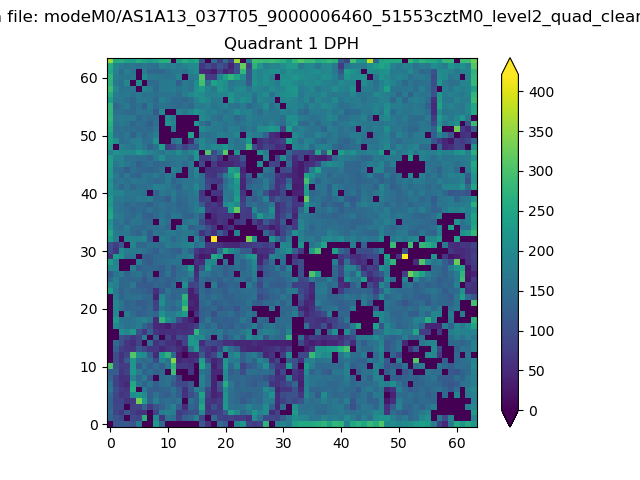 |
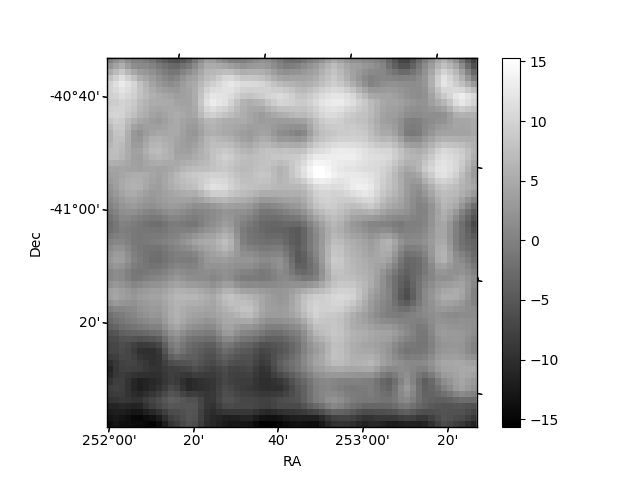
Quadrant B |
|---|---|---|---|
| Quadrant D | 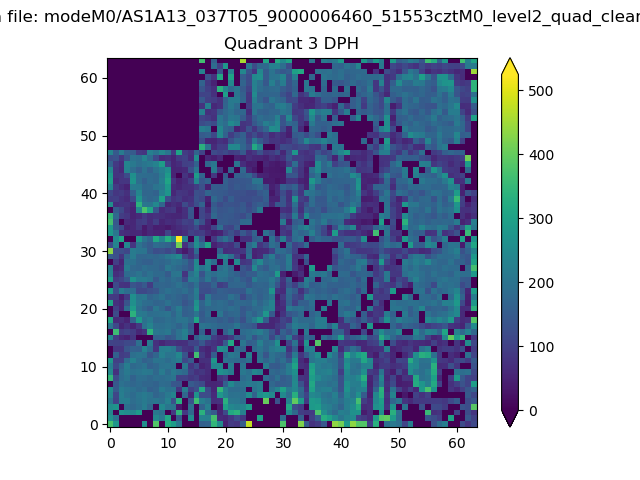 |
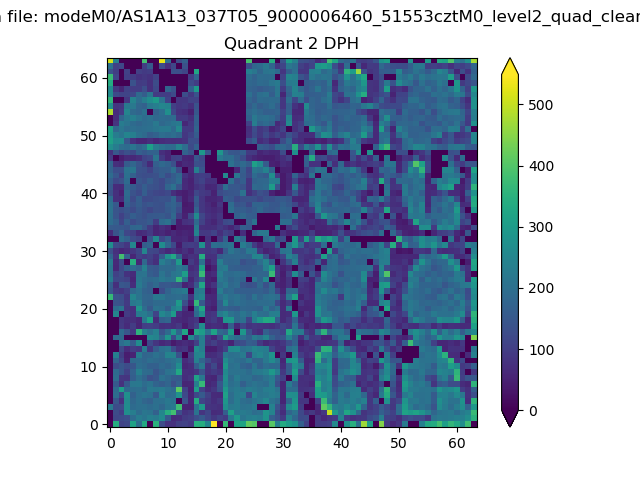 |
Quadrant C |
| Plot type | Count rate plots | Images |
|---|---|---|
| Comparison with Poisson distribution Blue bars denote a histogram of data divided into 1 sec bins. Red curve is a Poisson curve with rate = median count rate of data. |
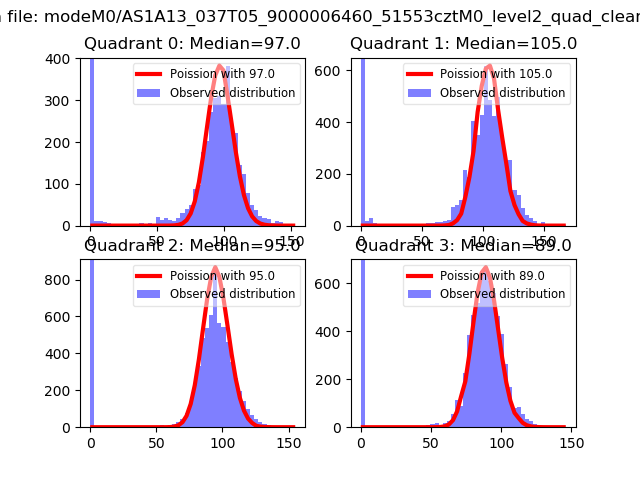 |
 |
| Quadrant-wise count rates Data is divided into 100 sec bins |
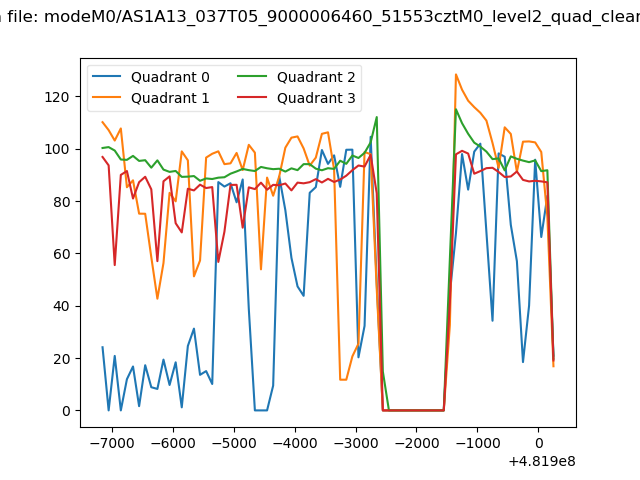 |
|
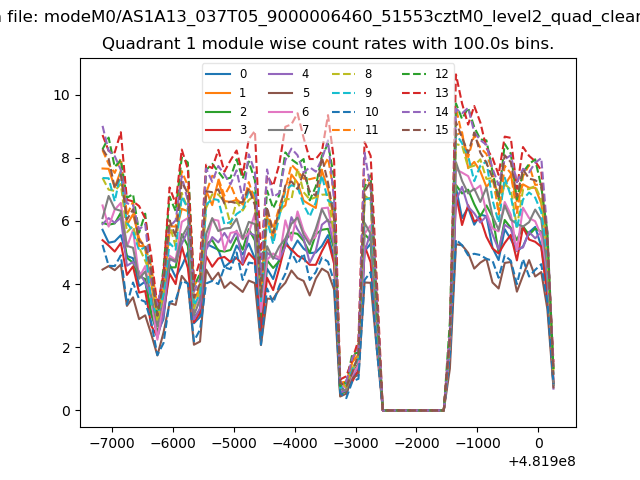
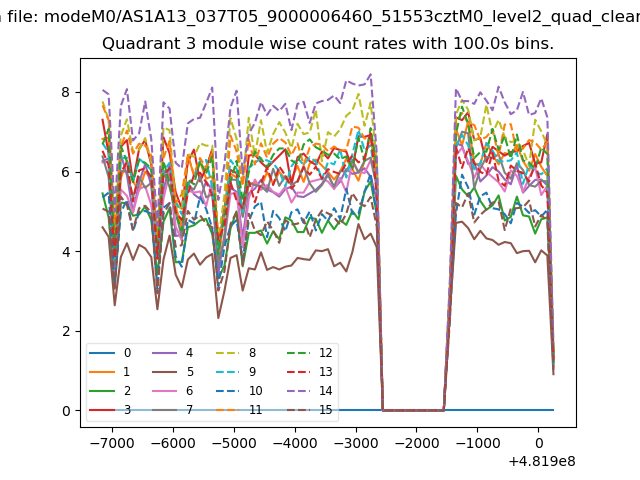
| Module-wise count rates for Quadrant A Data is divided into 100 sec bins |
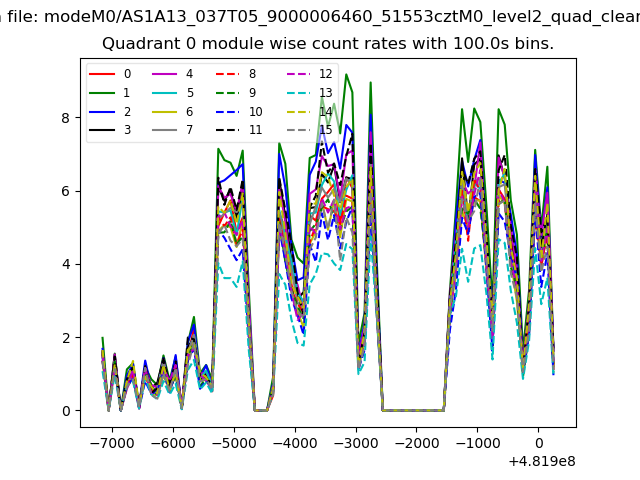 |
 |
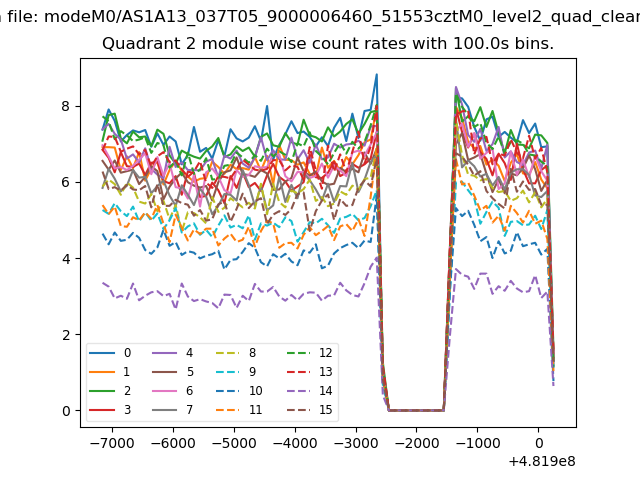
| Module-wise count rates for Quadrant B Data is divided into 100 sec bins |
 |
 |
| Module-wise count rates for Quadrant C Data is divided into 100 sec bins |
 |
 |
| Module-wise count rates for Quadrant D Data is divided into 100 sec bins |
 |
 |
| Parameter | Plot |
|---|---|
| CZT HV Monitor | 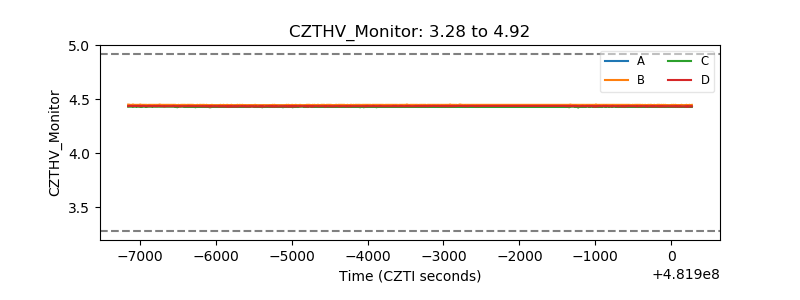 |
| D_VDD | 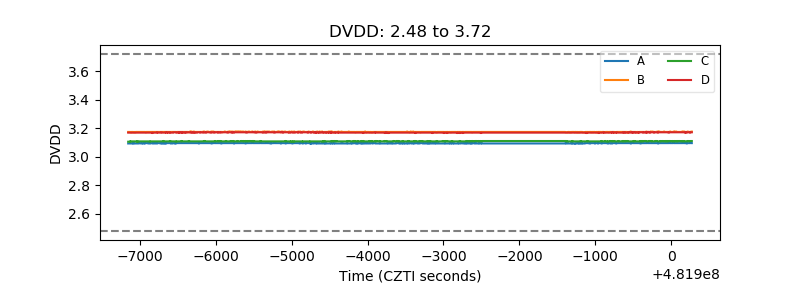 |
| Temperature 1 | 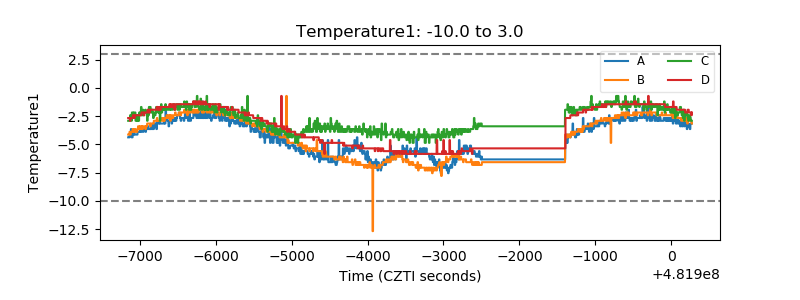 |
| Veto HV Monitor | 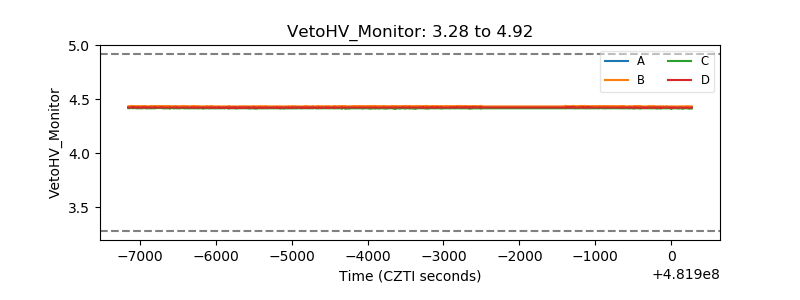 |
| Veto LLD | 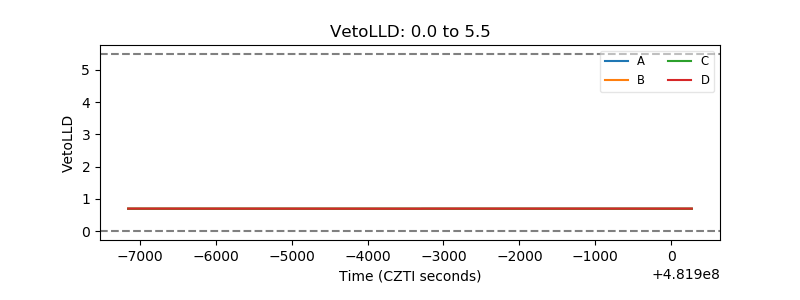 |
| Alpha Counter | 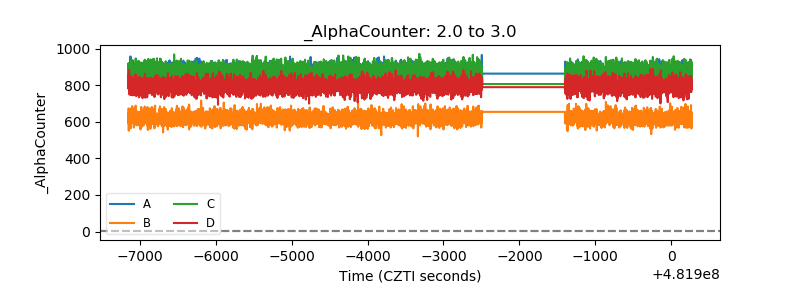 |
| _CPM_Rate | 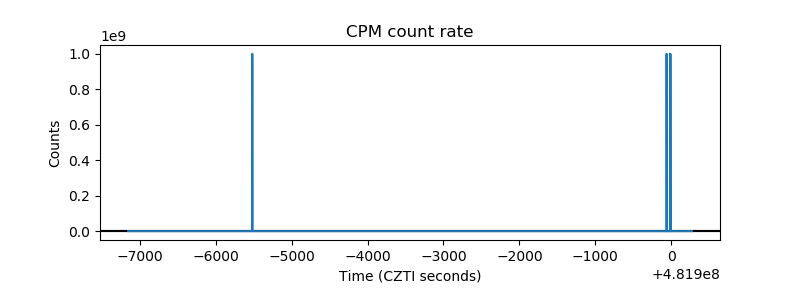 |
| CZT Counter | 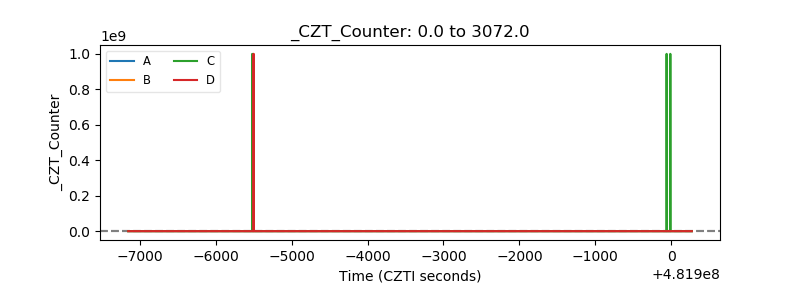 |
| +2.5 Volts monitor | 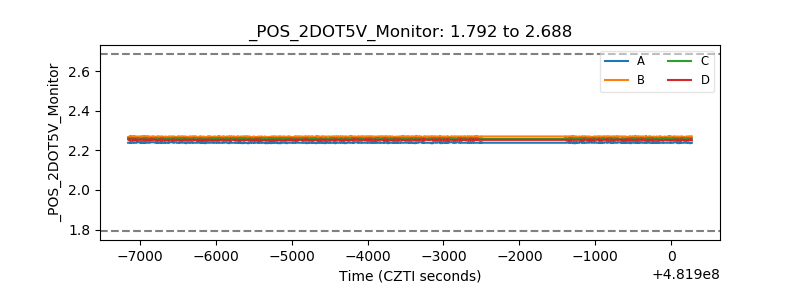 |
| +5 Volts monitor | 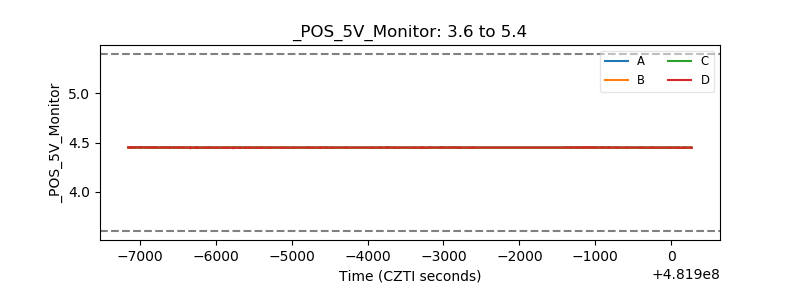 |
| _ROLL_ROT | 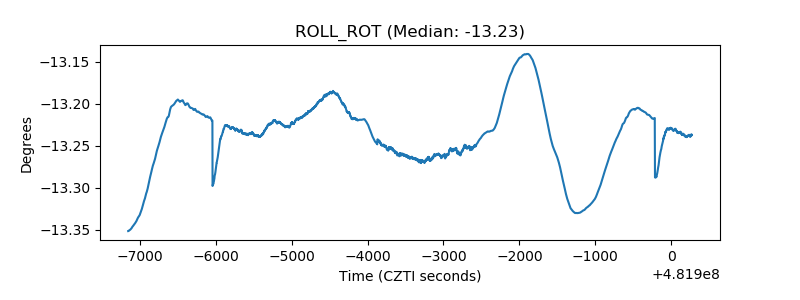 |
| _Roll_DEC | 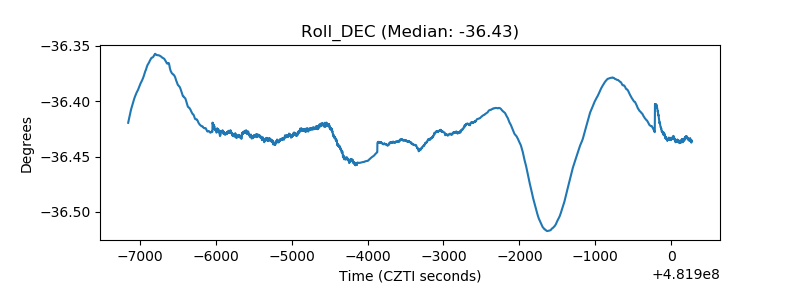 |
| _Roll_RA | 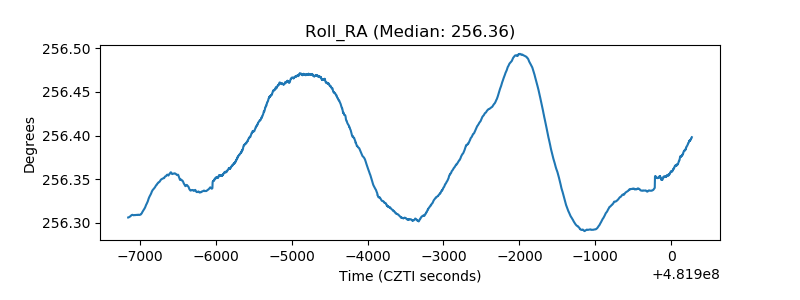 |
| Veto Counter | 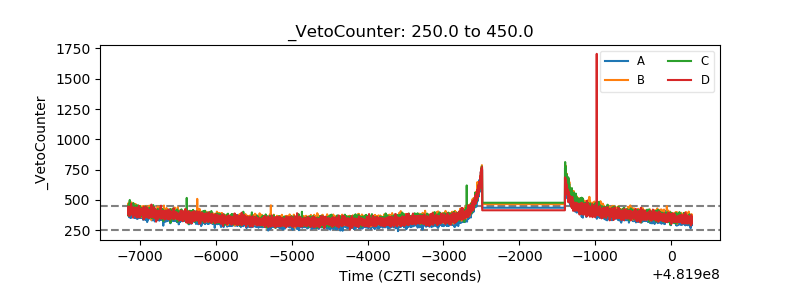 |