| Param | Original file | Final file |
|---|---|---|
| Filename | modeM0/AS1A13_037T05_9000006460_51554cztM0_level2.fits | modeM0/AS1A13_037T05_9000006460_51554cztM0_level2_quad_clean.evt |
| Size (bytes) | 670,639,680 | 92,505,600 |
| Size | 639.6 MB | 88.2 MB |
| Events in quadrant A | 10,037,691 | 442,527 |
| Events in quadrant B | 6,463,082 | 660,322 |
| Events in quadrant C | 3,596,493 | 641,686 |
| Events in quadrant D | 4,203,185 | 584,679 |
| Mode M9 | |||
|---|---|---|---|
| Quadrant | BADHDUFLAG | Total packets | Discarded packets |
| A | 0 | 14 | 0 |
| B | 0 | 15 | 0 |
| C | 0 | 15 | 0 |
| D | 0 | 15 | 0 |
| Mode M0 | |||
|---|---|---|---|
| Quadrant | BADHDUFLAG | Total packets | Discarded packets |
| A | 0 | 34536 | 2 |
| B | 0 | 23845 | 2 |
| C | 0 | 15545 | 3 |
| D | 0 | 17153 | 2 |
| Mode SS | |||
|---|---|---|---|
| Quadrant | BADHDUFLAG | Total packets | Discarded packets |
| A | 0 | 138 | 0 |
| B | 0 | 138 | 0 |
| C | 0 | 138 | 0 |
| D | 0 | 138 | 0 |
| Quadrant | Total seconds | Saturated seconds | Saturation percentage |
|---|---|---|---|
| A | 6766 | 2430 | 35.914868% |
| B | 6766 | 839 | 12.400236% |
| C | 6765 | 141 | 2.084257% |
| D | 6765 | 322 | 4.759793% |
Noise dominated data is calculated using 1-second bins in cleaned event files. If a bin has >2000 counts, and if more than 50% of those come from <1% of pixels, then it is considered to be noise-dominated and hence unusable.
| Quadrant | # 1 sec bins | Bins with >0 counts | Bins with >2000 counts | High rate bins dominated by noise | Noise dominated (total time) | Noise dominated (detector-on time) | Marked lightcurve |
|---|---|---|---|---|---|---|---|
| A | 7840 | 6765 | 2197 | 2197 | 28.02% | 32.48% | 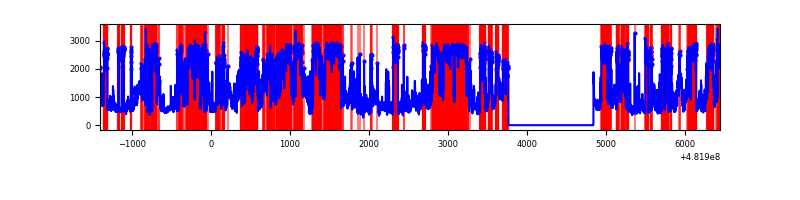 |
| B | 7841 | 6766 | 554 | 554 | 7.07% | 8.19% | 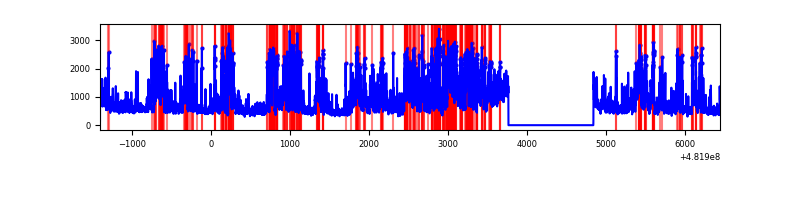 |
| C | 7840 | 6765 | 75 | 75 | 0.96% | 1.11% | 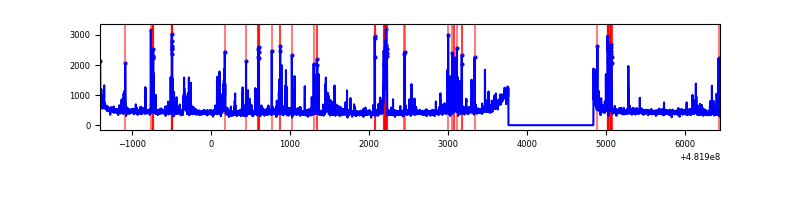 |
| D | 7840 | 6765 | 237 | 237 | 3.02% | 3.50% |  |
Top three noisy pixels from each quadrant. If the there are fewer than three noisy pixels in the level2.evt file, extra rows are filled as -1
| Pixel properties | Quadrant properties | ||||||
|---|---|---|---|---|---|---|---|
| Quadrant | DetID | PixID | Counts | Sigma | Mean | Median | Sigma |
| A | 15 | 32 | 3970044 | 26217.86 | 621 | 606 | 151.4 |
| A | 12 | 250 | 1363171 | 8999.65 | 621 | 606 | 151.4 |
| A | 12 | 3 | 1145680 | 7563.13 | 621 | 606 | 151.4 |
| B | 10 | 44 | 2609676 | 16869.19 | 731 | 705 | 154.7 |
| B | 4 | 81 | 353129 | 2278.72 | 731 | 705 | 154.7 |
| B | 0 | 171 | 148193 | 953.63 | 731 | 705 | 154.7 |
| C | 14 | 245 | 306816 | 1510.76 | 743 | 740 | 202.6 |
| C | 13 | 3 | 193504 | 951.46 | 743 | 740 | 202.6 |
| C | 10 | 19 | 45389 | 220.38 | 743 | 740 | 202.6 |
| D | 12 | 6 | 484895 | 2393.54 | 728 | 702 | 202.3 |
| D | 6 | 42 | 185459 | 913.32 | 728 | 702 | 202.3 |
| D | 8 | 176 | 149079 | 733.48 | 728 | 702 | 202.3 |
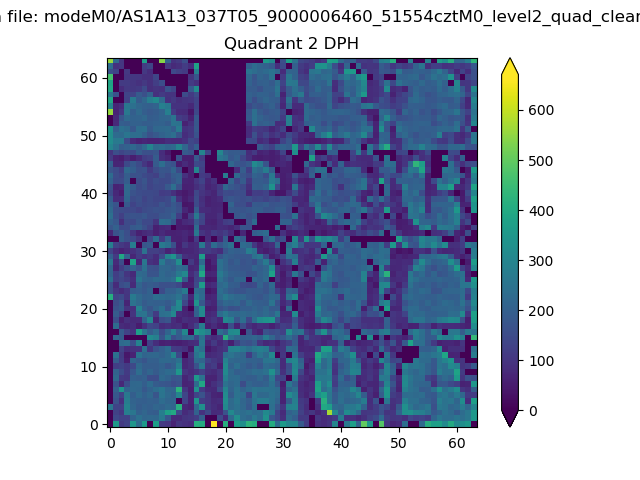
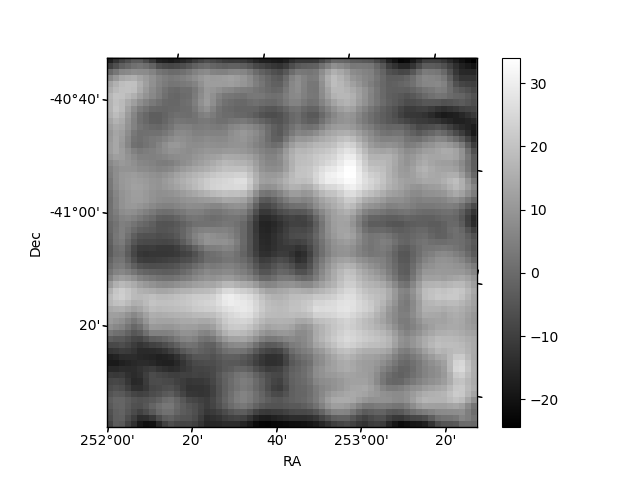
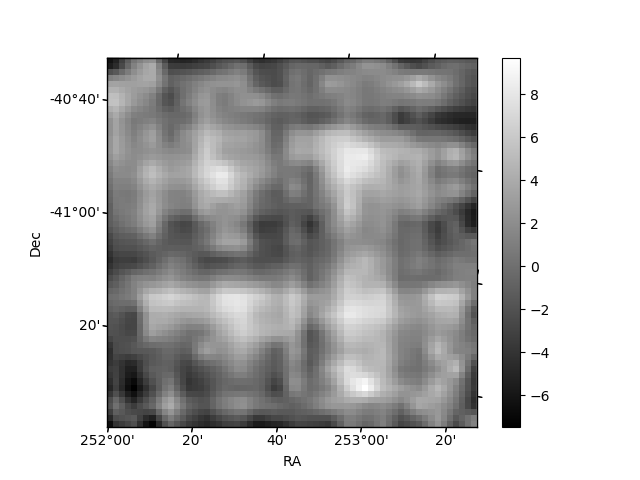
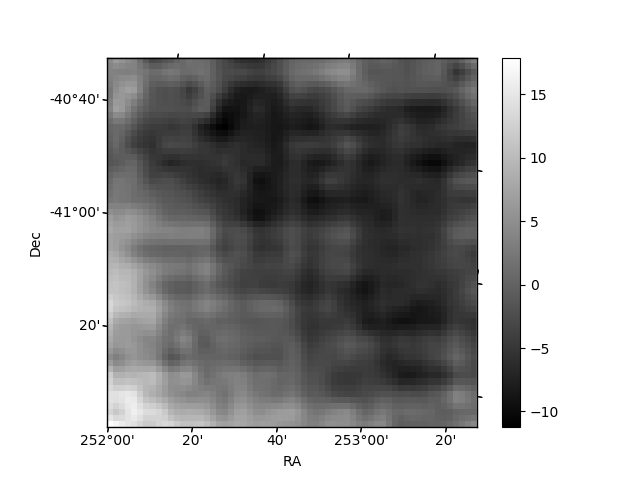
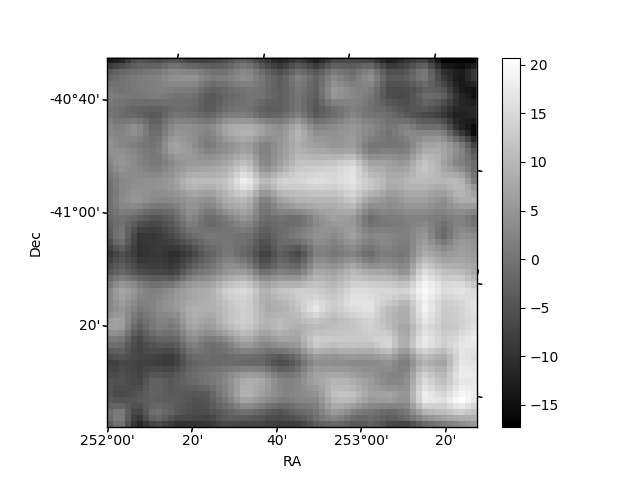
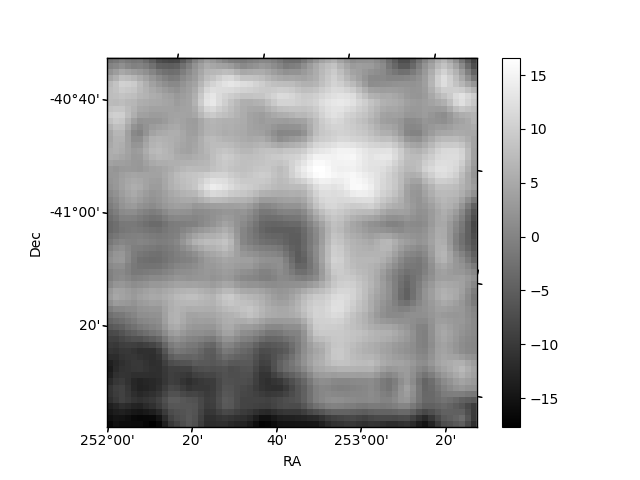
Histogram calculated using DETX and DETY for each event in the final _common_clean file
| Quadrant A | 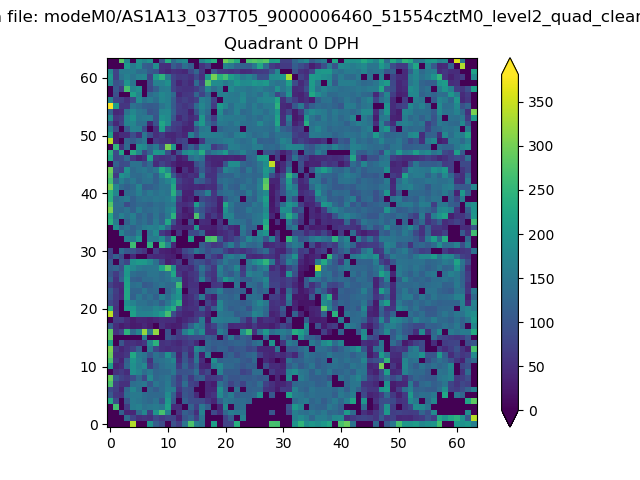 |
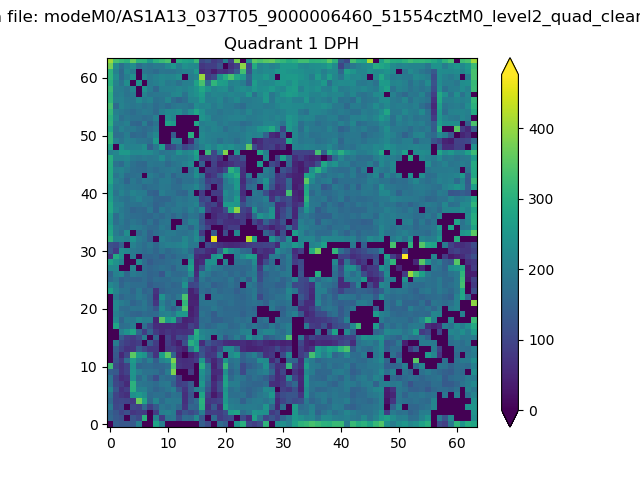 |
Quadrant B |
|---|---|---|---|
| Quadrant D | 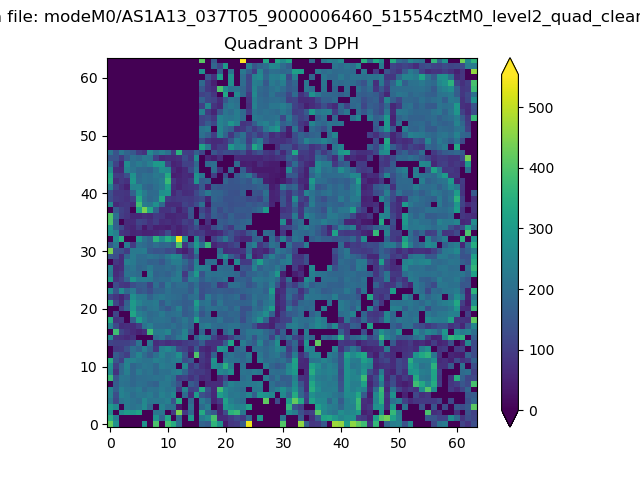 |
 |
Quadrant C |
| Plot type | Count rate plots | Images |
|---|---|---|
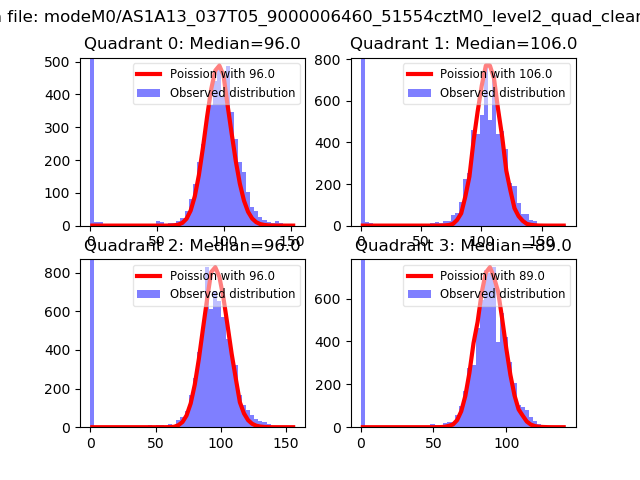
| Comparison with Poisson distribution Blue bars denote a histogram of data divided into 1 sec bins. Red curve is a Poisson curve with rate = median count rate of data. |
 |
 |
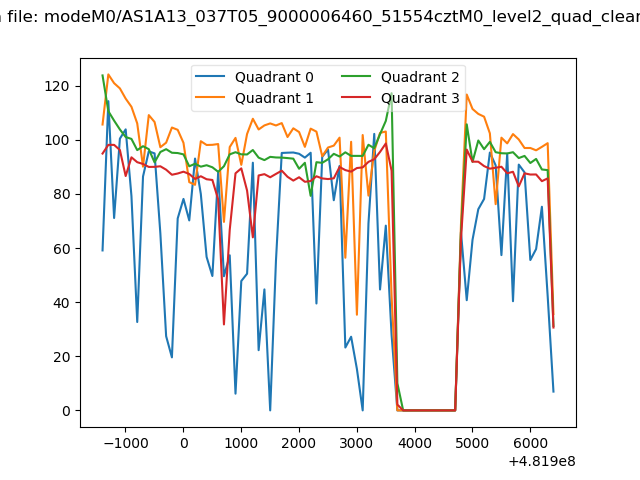
| Quadrant-wise count rates Data is divided into 100 sec bins |
 |
|
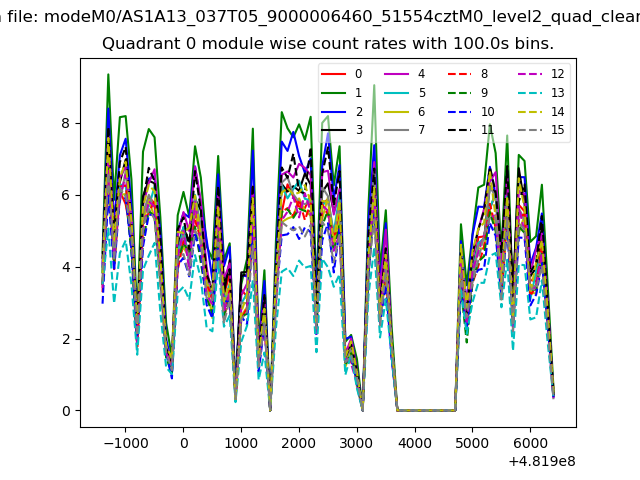
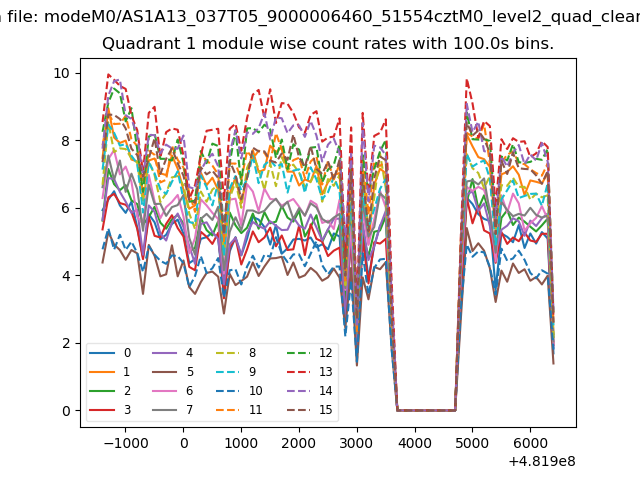
| Module-wise count rates for Quadrant A Data is divided into 100 sec bins |
 |
 |
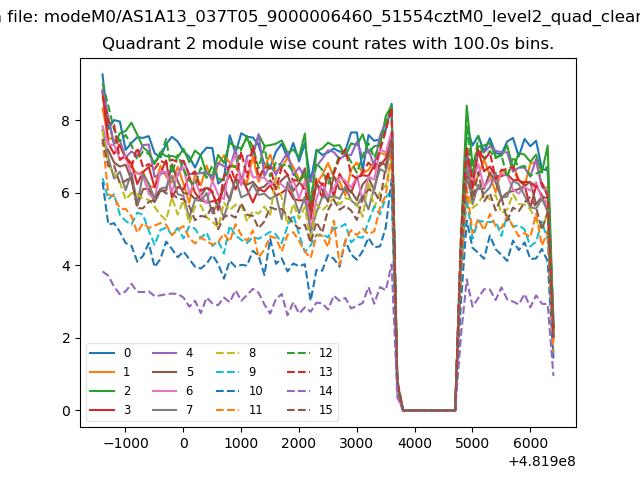
| Module-wise count rates for Quadrant B Data is divided into 100 sec bins |
 |
 |
| Module-wise count rates for Quadrant C Data is divided into 100 sec bins |
 |
 |
| Module-wise count rates for Quadrant D Data is divided into 100 sec bins |
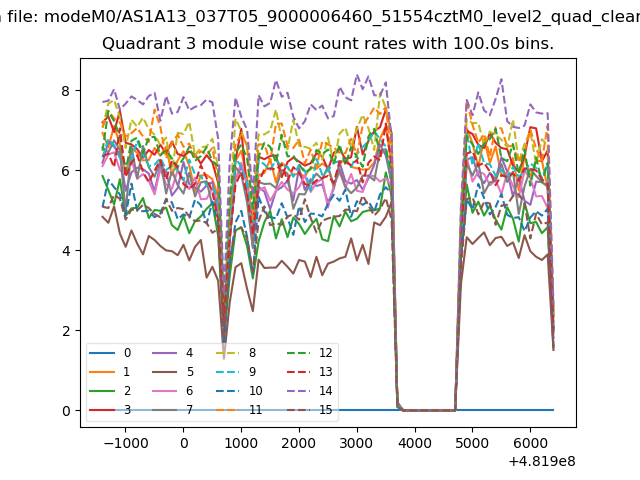 |
 |
| Parameter | Plot |
|---|---|
| CZT HV Monitor | 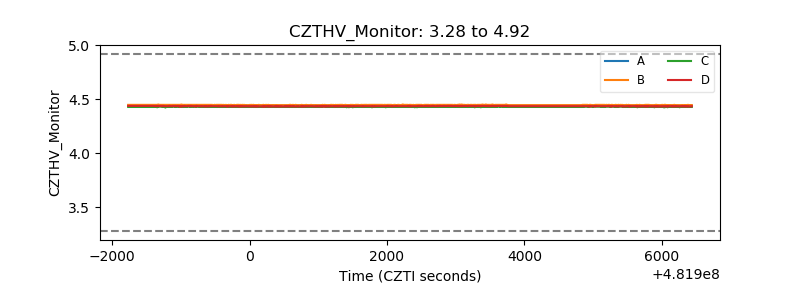 |
| D_VDD | 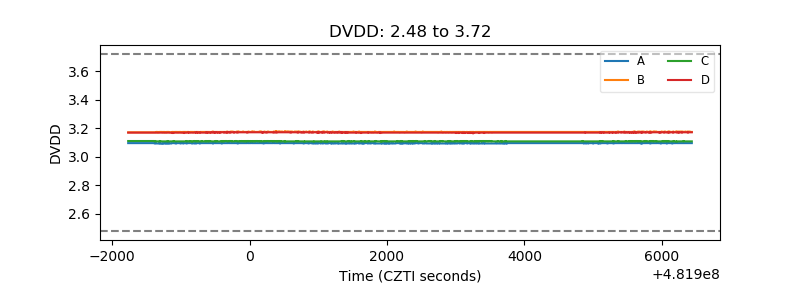 |
| Temperature 1 | 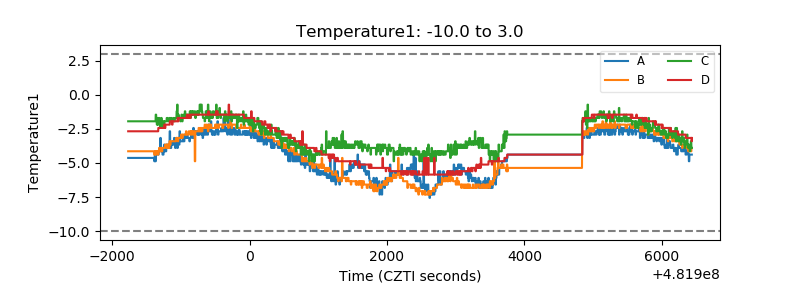 |
| Veto HV Monitor |  |
| Veto LLD | 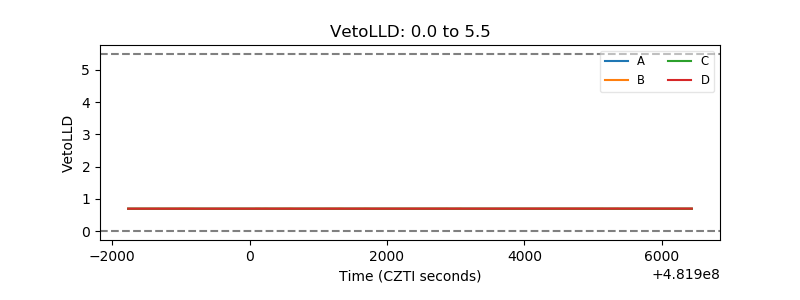 |
| Alpha Counter | 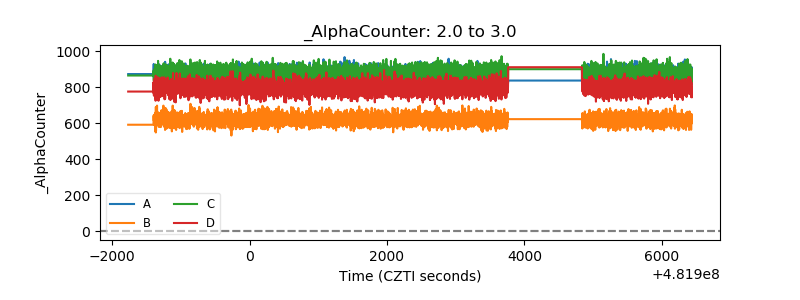 |
| _CPM_Rate | 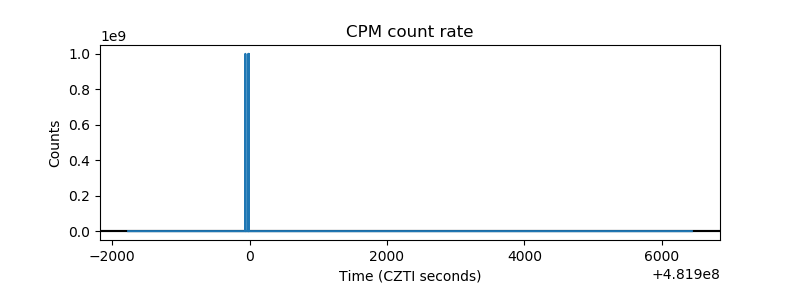 |
| CZT Counter | 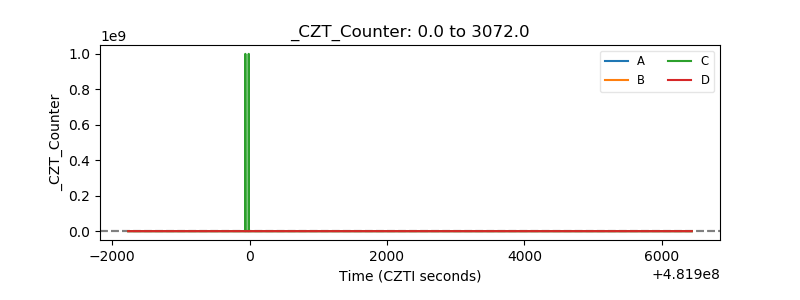 |
| +2.5 Volts monitor | 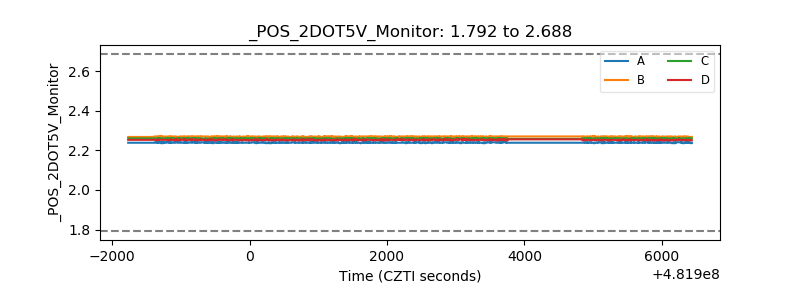 |
| +5 Volts monitor | 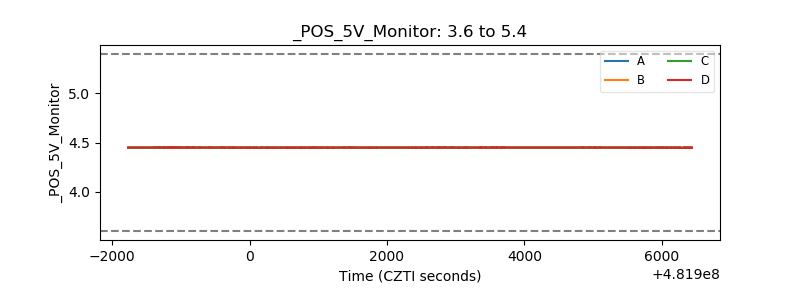 |
| _ROLL_ROT | 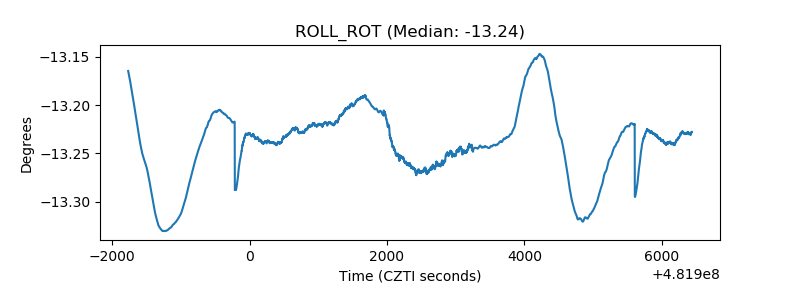 |
| _Roll_DEC | 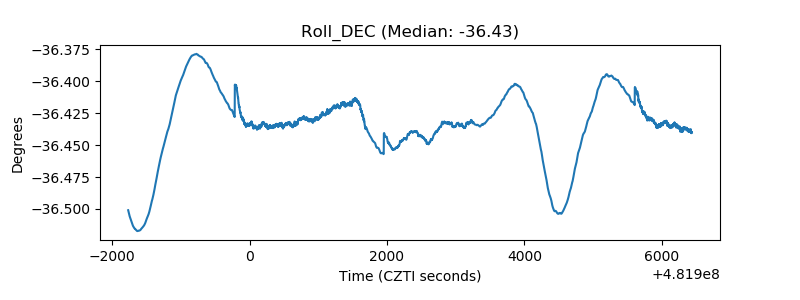 |
| _Roll_RA | 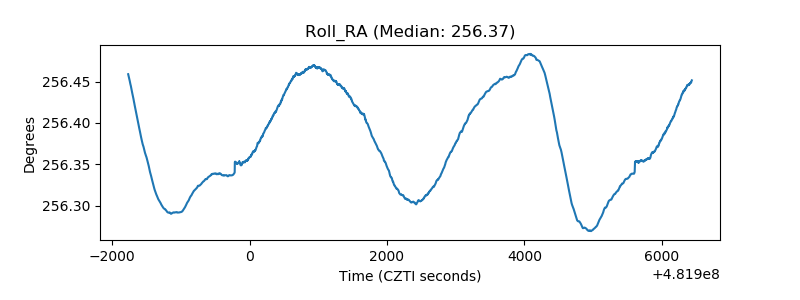 |
| Veto Counter | 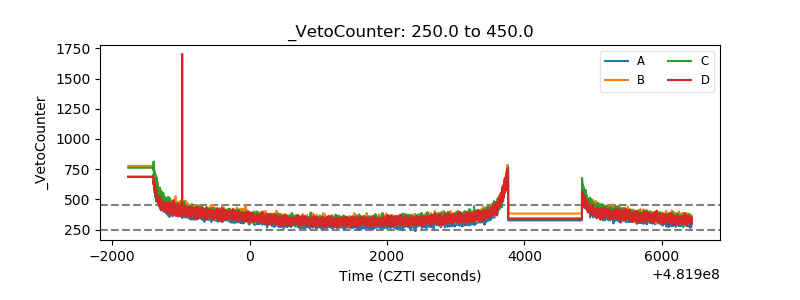 |