| Param | Original file | Final file |
|---|---|---|
| Filename | modeM0/AS1A13_037T05_9000006460_51555cztM0_level2.fits | modeM0/AS1A13_037T05_9000006460_51555cztM0_level2_quad_clean.evt |
| Size (bytes) | 670,109,760 | 87,419,520 |
| Size | 639.1 MB | 83.4 MB |
| Events in quadrant A | 10,479,261 | 394,942 |
| Events in quadrant B | 6,251,259 | 616,691 |
| Events in quadrant C | 3,390,627 | 612,933 |
| Events in quadrant D | 4,167,888 | 558,695 |
| Mode M9 | |||
|---|---|---|---|
| Quadrant | BADHDUFLAG | Total packets | Discarded packets |
| A | 0 | 9 | 0 |
| B | 0 | 9 | 0 |
| C | 0 | 9 | 0 |
| D | 0 | 9 | 0 |
| Mode M0 | |||
|---|---|---|---|
| Quadrant | BADHDUFLAG | Total packets | Discarded packets |
| A | 0 | 35701 | 1 |
| B | 0 | 23128 | 1 |
| C | 0 | 15042 | 1 |
| D | 0 | 17081 | 2 |
| Mode SS | |||
|---|---|---|---|
| Quadrant | BADHDUFLAG | Total packets | Discarded packets |
| A | 0 | 134 | 0 |
| B | 0 | 134 | 0 |
| C | 0 | 134 | 0 |
| D | 0 | 136 | 0 |
| Quadrant | Total seconds | Saturated seconds | Saturation percentage |
|---|---|---|---|
| A | 6652 | 2731 | 41.055322% |
| B | 6652 | 918 | 13.800361% |
| C | 6652 | 140 | 2.104630% |
| D | 6652 | 321 | 4.825616% |
Noise dominated data is calculated using 1-second bins in cleaned event files. If a bin has >2000 counts, and if more than 50% of those come from <1% of pixels, then it is considered to be noise-dominated and hence unusable.
| Quadrant | # 1 sec bins | Bins with >0 counts | Bins with >2000 counts | High rate bins dominated by noise | Noise dominated (total time) | Noise dominated (detector-on time) | Marked lightcurve |
|---|---|---|---|---|---|---|---|
| A | 7532 | 6651 | 2525 | 2525 | 33.52% | 37.96% | 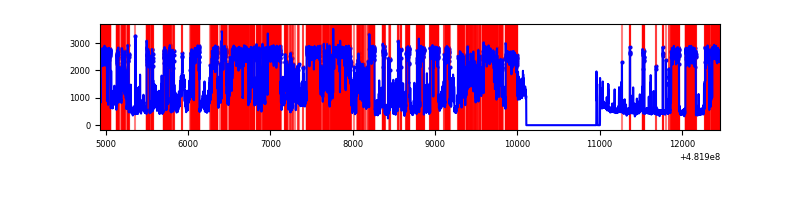 |
| B | 7533 | 6652 | 616 | 616 | 8.18% | 9.26% | 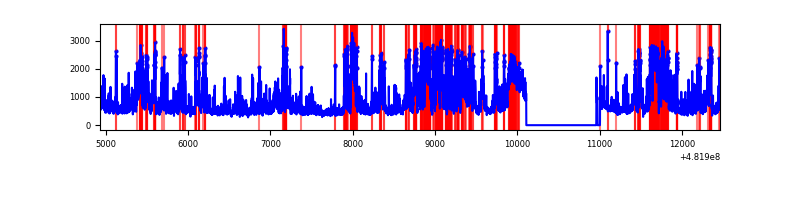 |
| C | 7533 | 6653 | 90 | 90 | 1.19% | 1.35% | 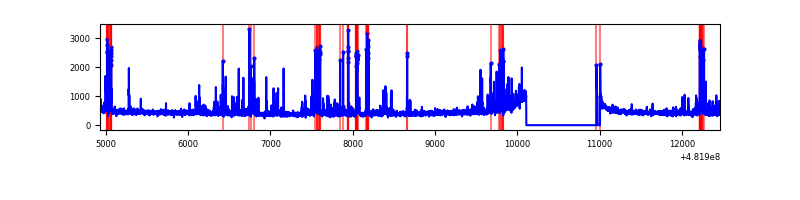 |
| D | 7533 | 6653 | 262 | 262 | 3.48% | 3.94% | 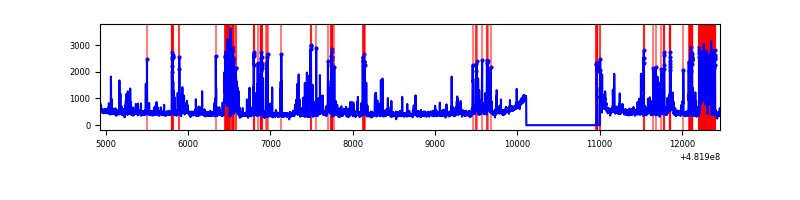 |
Top three noisy pixels from each quadrant. If the there are fewer than three noisy pixels in the level2.evt file, extra rows are filled as -1
| Pixel properties | Quadrant properties | ||||||
|---|---|---|---|---|---|---|---|
| Quadrant | DetID | PixID | Counts | Sigma | Mean | Median | Sigma |
| A | 15 | 32 | 5136288 | 36031.03 | 580 | 567 | 142.5 |
| A | 12 | 3 | 991573 | 6952.67 | 580 | 567 | 142.5 |
| A | 12 | 250 | 985536 | 6910.31 | 580 | 567 | 142.5 |
| B | 10 | 44 | 2740836 | 18456.58 | 696 | 671 | 148.5 |
| B | 4 | 81 | 191071 | 1282.45 | 696 | 671 | 148.5 |
| B | 0 | 171 | 155650 | 1043.87 | 696 | 671 | 148.5 |
| C | 13 | 3 | 371881 | 1887.33 | 716 | 708 | 196.7 |
| C | 0 | 177 | 79747 | 401.89 | 716 | 708 | 196.7 |
| C | 14 | 245 | 52368 | 262.68 | 716 | 708 | 196.7 |
| D | 12 | 6 | 525032 | 2683.22 | 700 | 675 | 195.4 |
| D | 6 | 42 | 302593 | 1544.96 | 700 | 675 | 195.4 |
| D | 8 | 176 | 217557 | 1109.82 | 700 | 675 | 195.4 |
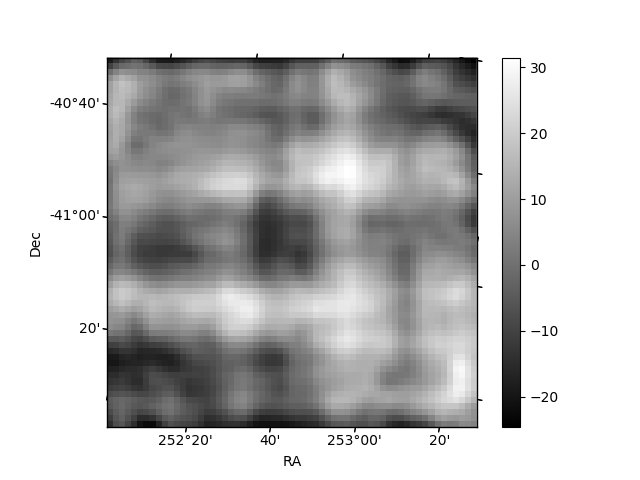
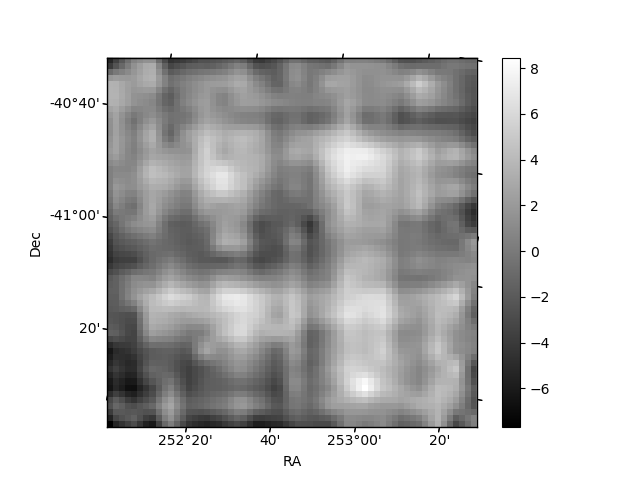
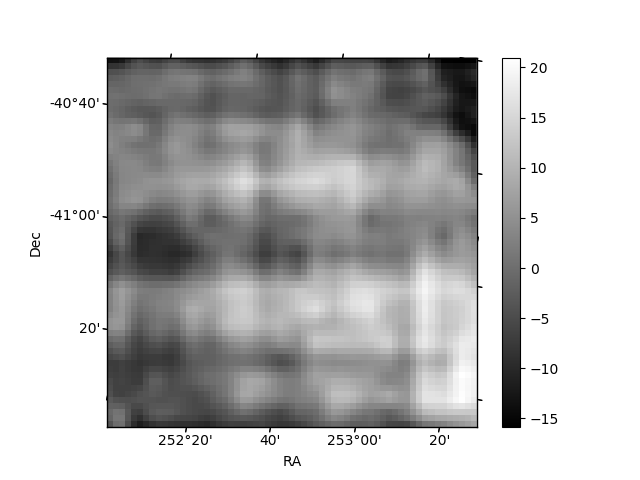
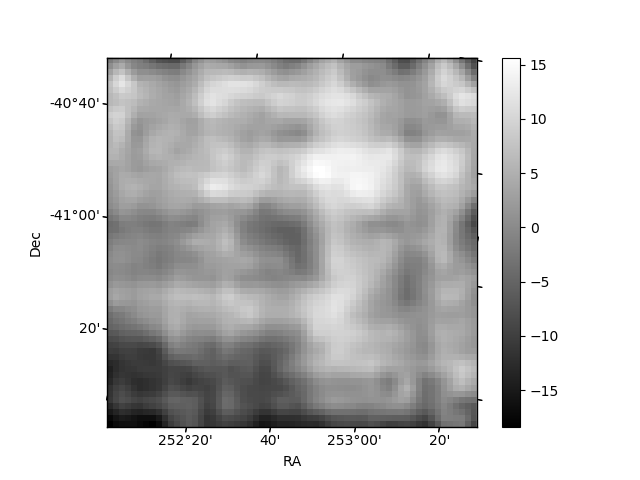
Histogram calculated using DETX and DETY for each event in the final _common_clean file
| Quadrant A | 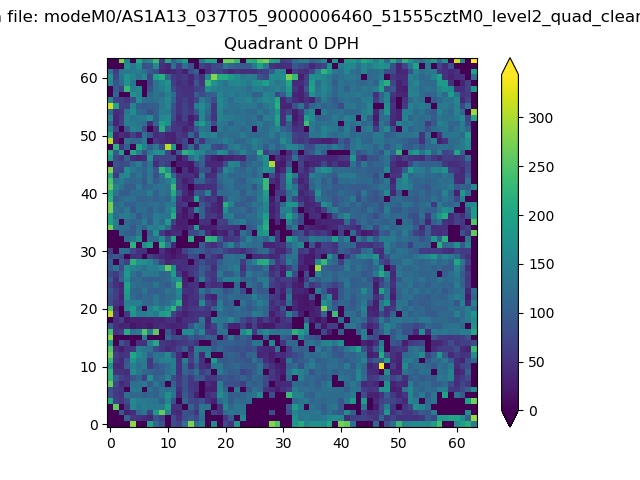 |
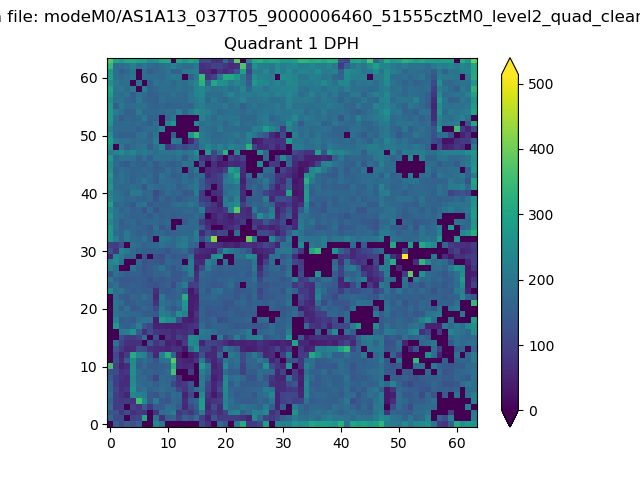 |
Quadrant B |
|---|---|---|---|
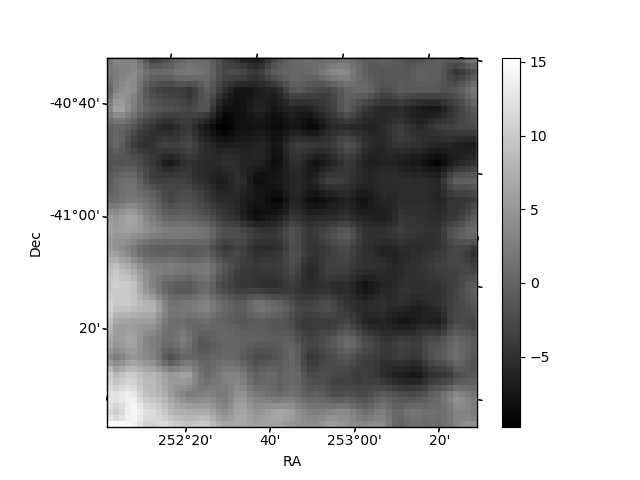
| Quadrant D | 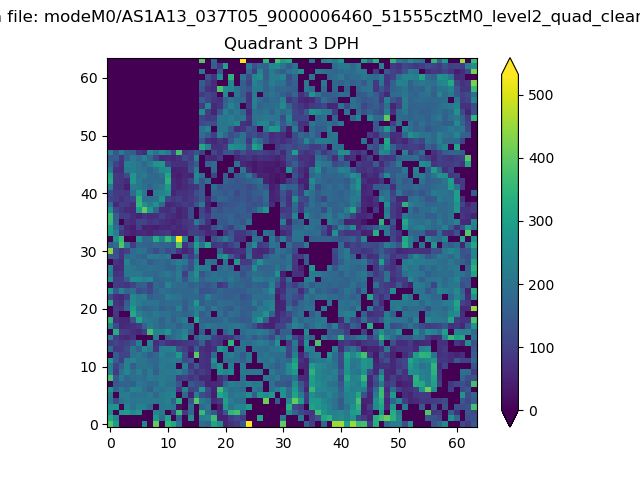 |
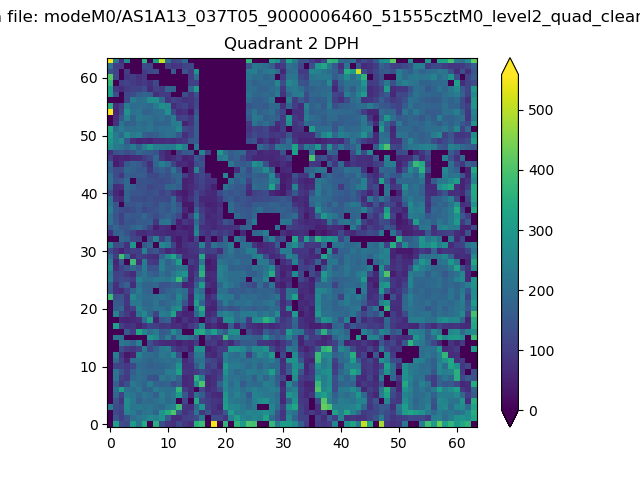 |
Quadrant C |
| Plot type | Count rate plots | Images |
|---|---|---|
| Comparison with Poisson distribution Blue bars denote a histogram of data divided into 1 sec bins. Red curve is a Poisson curve with rate = median count rate of data. |
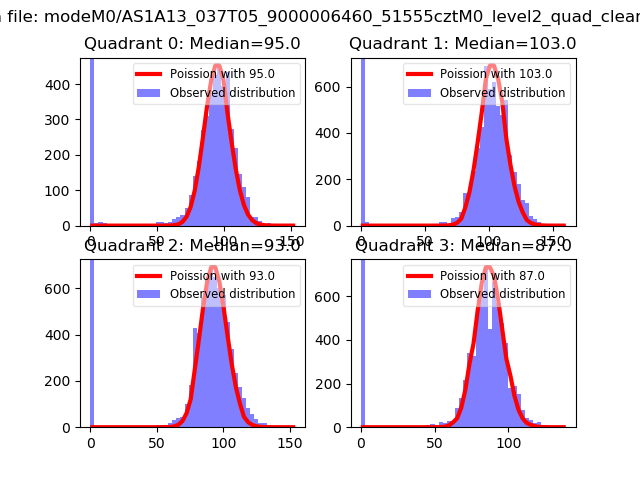 |
 |
| Quadrant-wise count rates Data is divided into 100 sec bins |
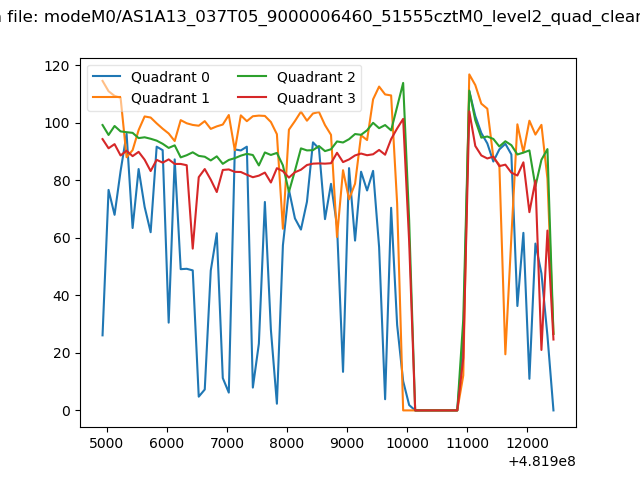 |
|
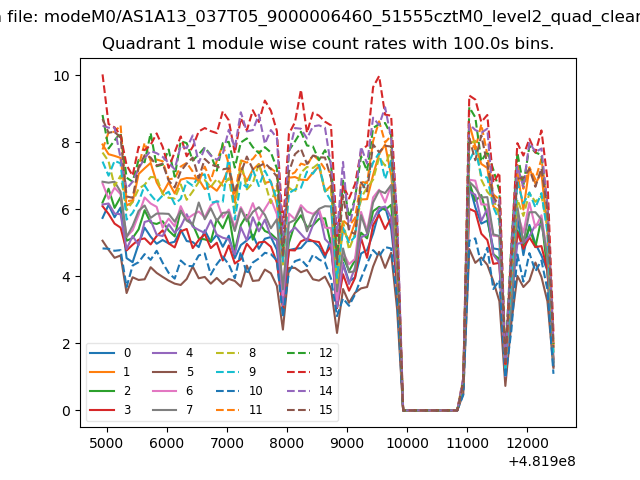
| Module-wise count rates for Quadrant A Data is divided into 100 sec bins |
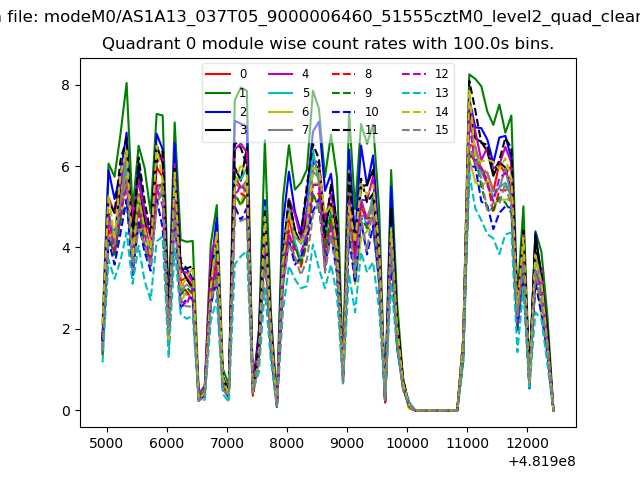 |
 |
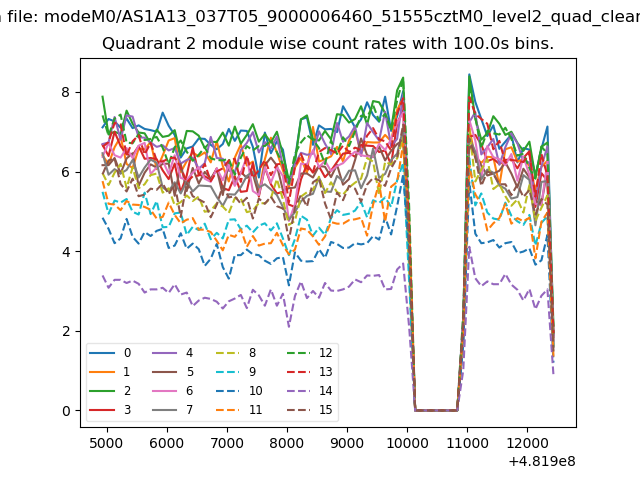
| Module-wise count rates for Quadrant B Data is divided into 100 sec bins |
 |
 |
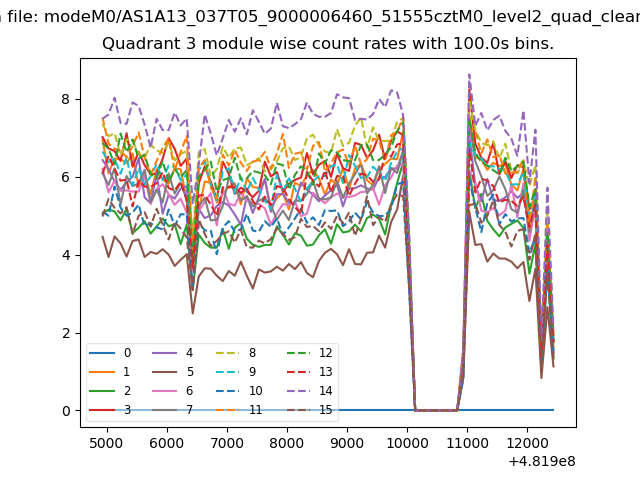
| Module-wise count rates for Quadrant C Data is divided into 100 sec bins |
 |
 |
| Module-wise count rates for Quadrant D Data is divided into 100 sec bins |
 |
 |
| Parameter | Plot |
|---|---|
| CZT HV Monitor | 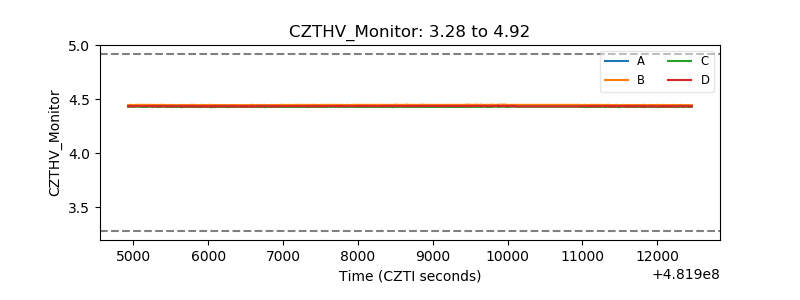 |
| D_VDD | 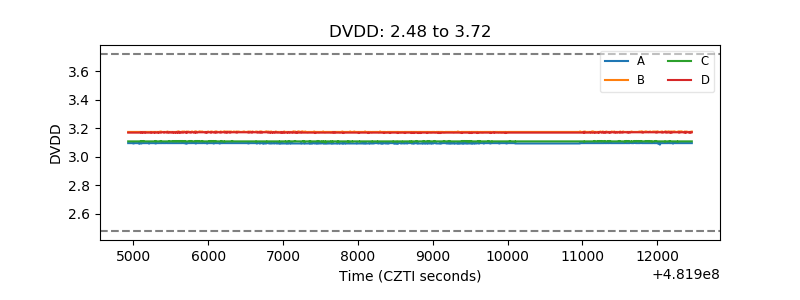 |
| Temperature 1 | 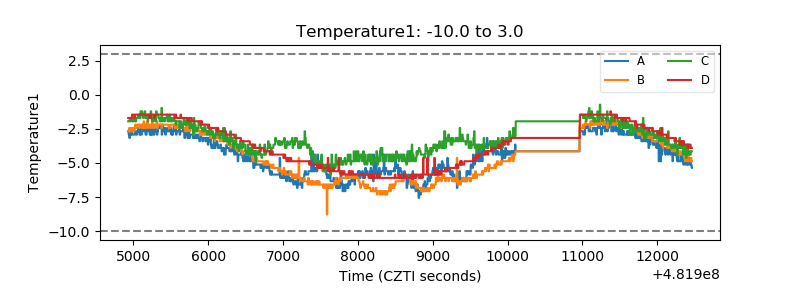 |
| Veto HV Monitor | 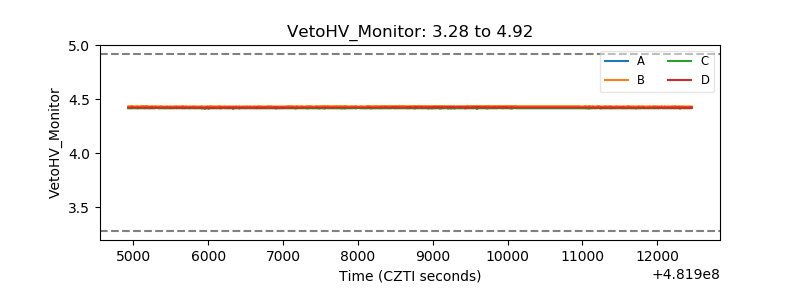 |
| Veto LLD | 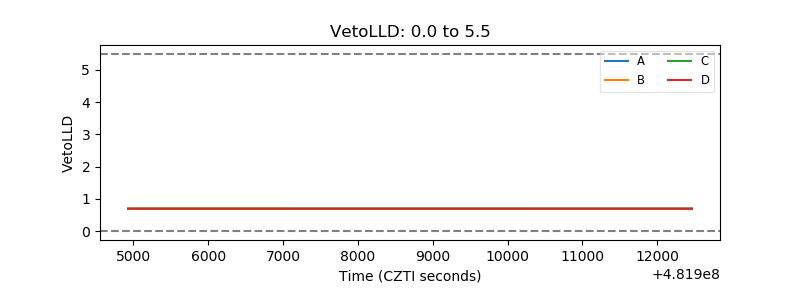 |
| Alpha Counter | 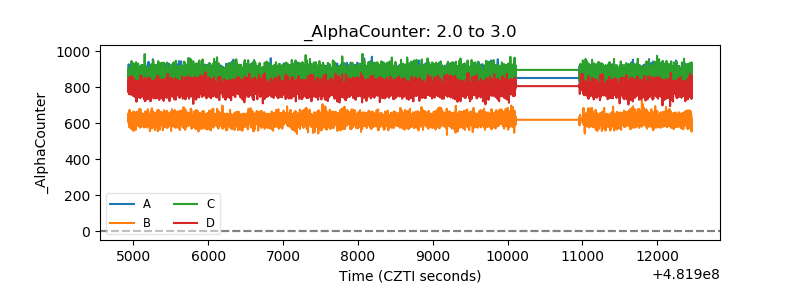 |
| _CPM_Rate | 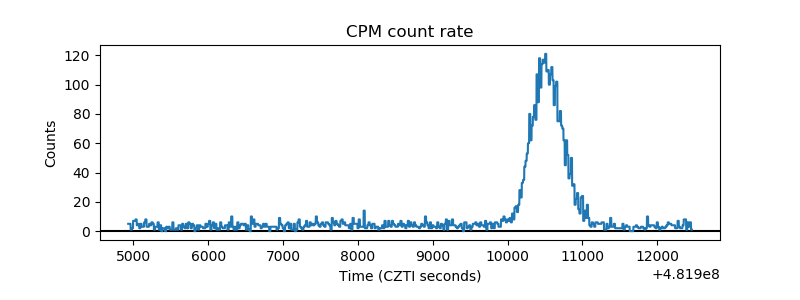 |
| CZT Counter | 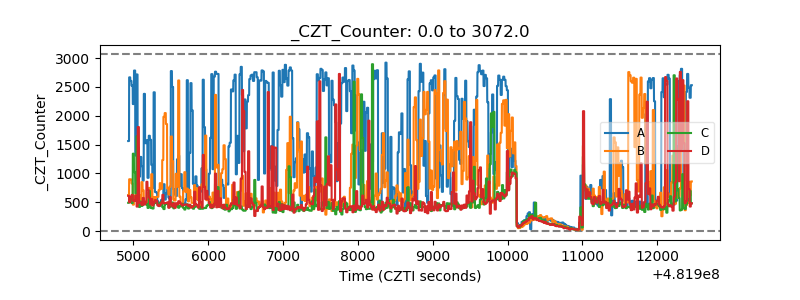 |
| +2.5 Volts monitor | 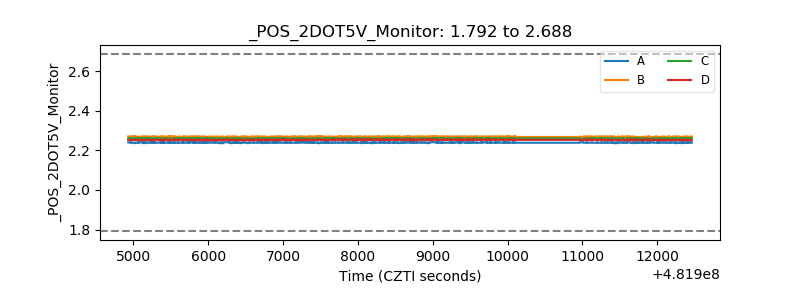 |
| +5 Volts monitor | 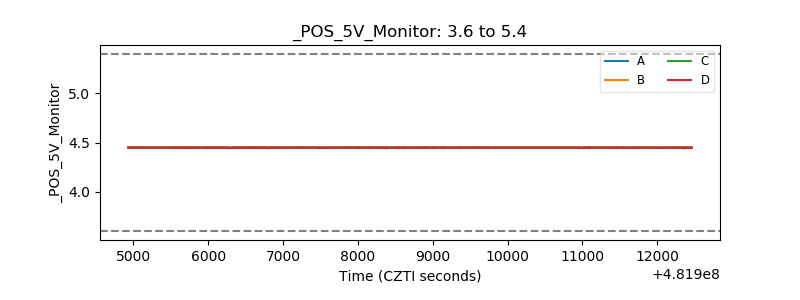 |
| _ROLL_ROT | 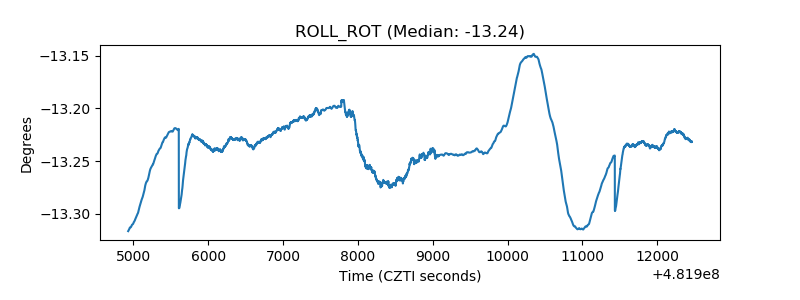 |
| _Roll_DEC | 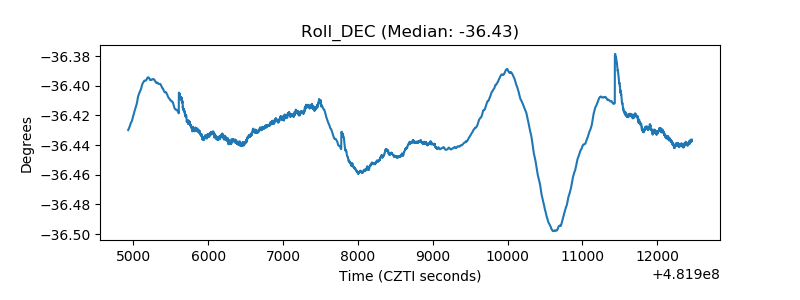 |
| _Roll_RA | 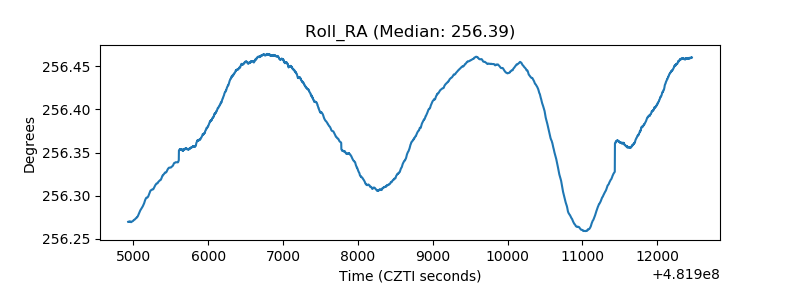 |
| Veto Counter | 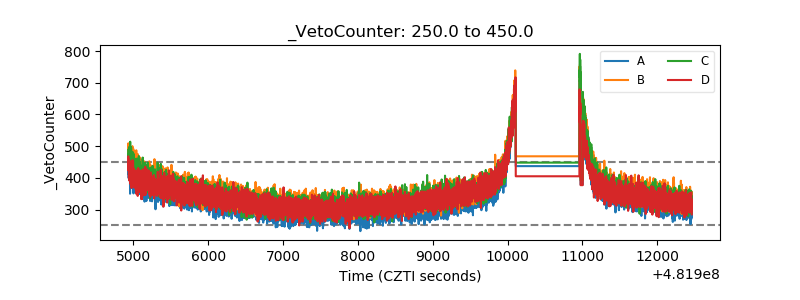 |