| Param | Original file | Final file |
|---|---|---|
| Filename | modeM0/AS1A13_037T05_9000006460_51556cztM0_level2.fits | modeM0/AS1A13_037T05_9000006460_51556cztM0_level2_quad_clean.evt |
| Size (bytes) | 802,730,880 | 93,435,840 |
| Size | 765.5 MB | 89.1 MB |
| Events in quadrant A | 9,660,995 | 527,640 |
| Events in quadrant B | 9,899,938 | 521,839 |
| Events in quadrant C | 4,472,499 | 664,173 |
| Events in quadrant D | 5,109,878 | 602,252 |
| Mode M9 | |||
|---|---|---|---|
| Quadrant | BADHDUFLAG | Total packets | Discarded packets |
| A | 0 | 15 | 0 |
| B | 0 | 15 | 0 |
| C | 0 | 15 | 0 |
| D | 0 | 15 | 0 |
| Mode M0 | |||
|---|---|---|---|
| Quadrant | BADHDUFLAG | Total packets | Discarded packets |
| A | 0 | 33843 | 2 |
| B | 0 | 34523 | 2 |
| C | 0 | 18712 | 2 |
| D | 0 | 20288 | 2 |
| Mode SS | |||
|---|---|---|---|
| Quadrant | BADHDUFLAG | Total packets | Discarded packets |
| A | 0 | 150 | 0 |
| B | 0 | 150 | 0 |
| C | 0 | 150 | 0 |
| D | 0 | 150 | 0 |
| Quadrant | Total seconds | Saturated seconds | Saturation percentage |
|---|---|---|---|
| A | 7375 | 1957 | 26.535593% |
| B | 7375 | 2628 | 35.633898% |
| C | 7374 | 309 | 4.190399% |
| D | 7375 | 494 | 6.698305% |
Noise dominated data is calculated using 1-second bins in cleaned event files. If a bin has >2000 counts, and if more than 50% of those come from <1% of pixels, then it is considered to be noise-dominated and hence unusable.
| Quadrant | # 1 sec bins | Bins with >0 counts | Bins with >2000 counts | High rate bins dominated by noise | Noise dominated (total time) | Noise dominated (detector-on time) | Marked lightcurve |
|---|---|---|---|---|---|---|---|
| A | 8796 | 7375 | 1663 | 1663 | 18.91% | 22.55% | 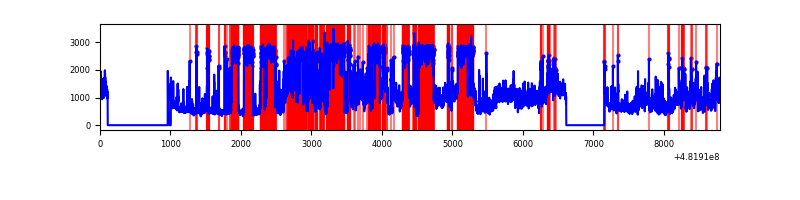 |
| B | 8795 | 7374 | 2154 | 2154 | 24.49% | 29.21% | 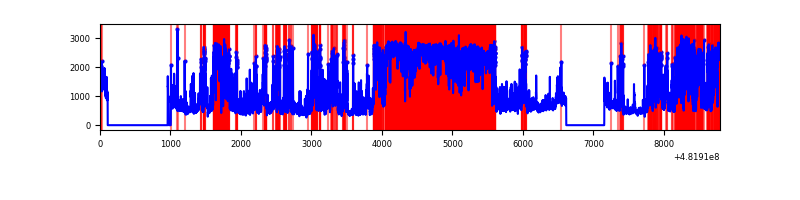 |
| C | 8795 | 7375 | 219 | 219 | 2.49% | 2.97% |  |
| D | 8796 | 7377 | 411 | 411 | 4.67% | 5.57% | 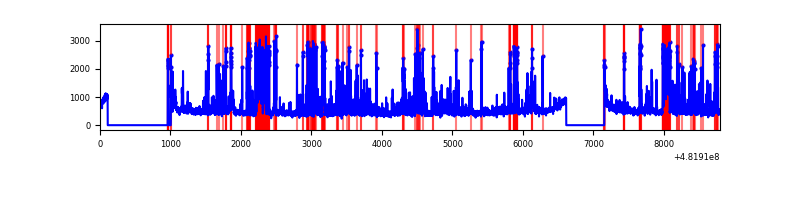 |
Top three noisy pixels from each quadrant. If the there are fewer than three noisy pixels in the level2.evt file, extra rows are filled as -1
| Pixel properties | Quadrant properties | ||||||
|---|---|---|---|---|---|---|---|
| Quadrant | DetID | PixID | Counts | Sigma | Mean | Median | Sigma |
| A | 15 | 32 | 3613031 | 20091.62 | 730 | 711 | 179.8 |
| A | 12 | 3 | 1578624 | 8776.31 | 730 | 711 | 179.8 |
| A | 12 | 250 | 595389 | 3307.58 | 730 | 711 | 179.8 |
| B | 10 | 44 | 3999083 | 26173.04 | 705 | 678 | 152.8 |
| B | 12 | 18 | 1102132 | 7209.98 | 705 | 678 | 152.8 |
| B | 10 | 41 | 765702 | 5007.75 | 705 | 678 | 152.8 |
| C | 0 | 177 | 811106 | 3683.65 | 798 | 789 | 220.0 |
| C | 13 | 3 | 339166 | 1538.24 | 798 | 789 | 220.0 |
| C | 4 | 5 | 27382 | 120.89 | 798 | 789 | 220.0 |
| D | 12 | 6 | 711075 | 3279.65 | 776 | 749 | 216.6 |
| D | 8 | 176 | 659976 | 3043.72 | 776 | 749 | 216.6 |
| D | 2 | 249 | 120409 | 552.48 | 776 | 749 | 216.6 |
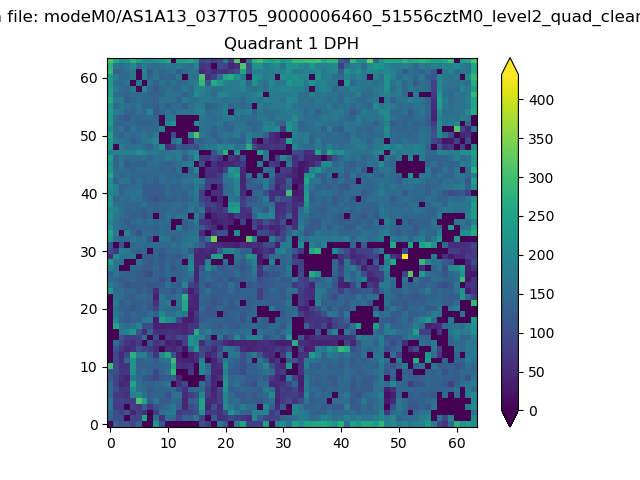
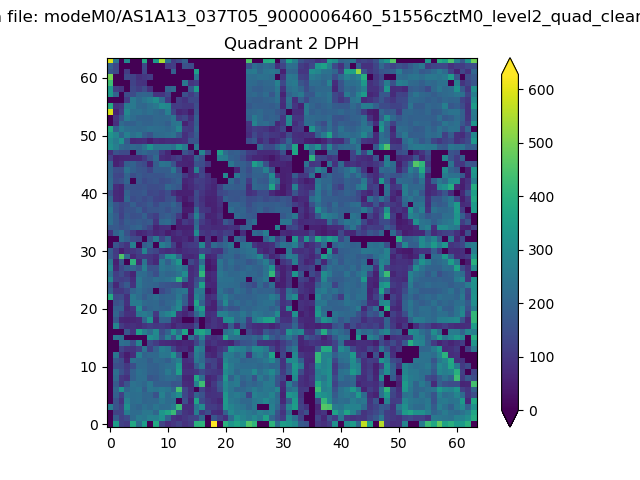
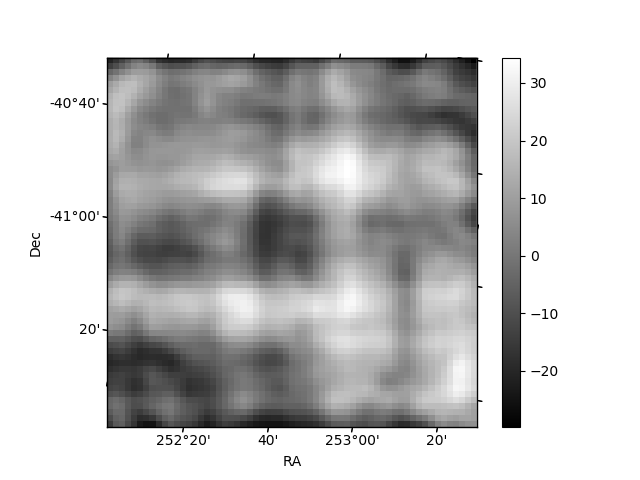
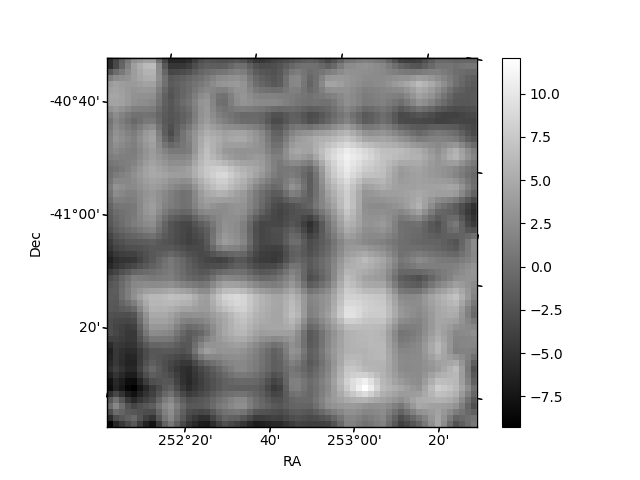
Histogram calculated using DETX and DETY for each event in the final _common_clean file
| Quadrant A | 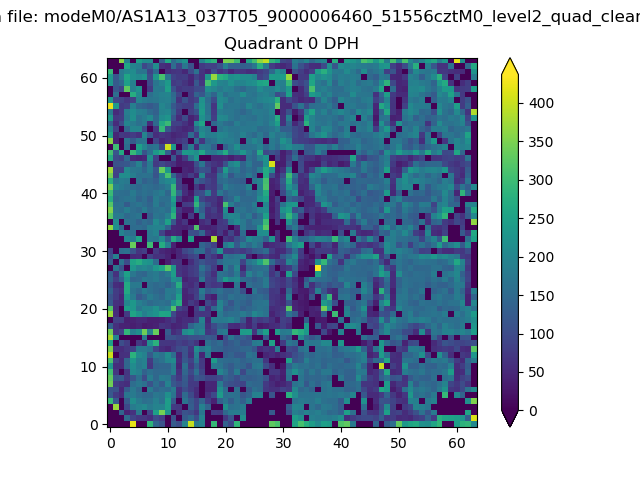 |
 |
Quadrant B |
|---|---|---|---|
| Quadrant D | 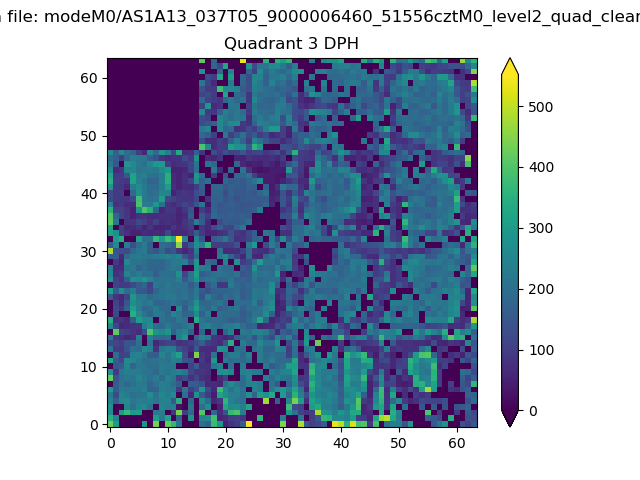 |
 |
Quadrant C |
| Plot type | Count rate plots | Images |
|---|---|---|
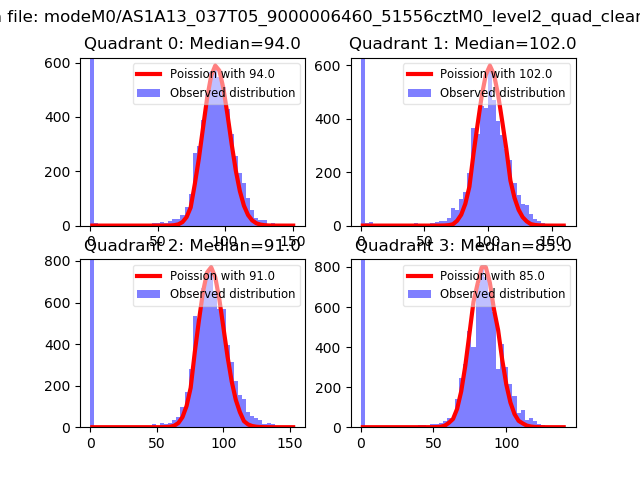
| Comparison with Poisson distribution Blue bars denote a histogram of data divided into 1 sec bins. Red curve is a Poisson curve with rate = median count rate of data. |
 |
 |
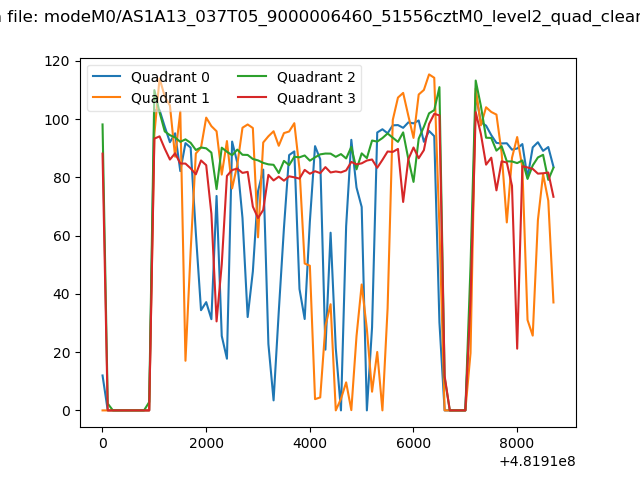
| Quadrant-wise count rates Data is divided into 100 sec bins |
 |
|
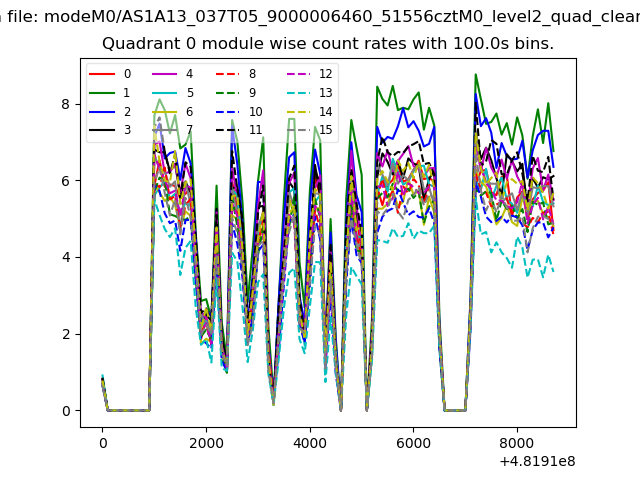
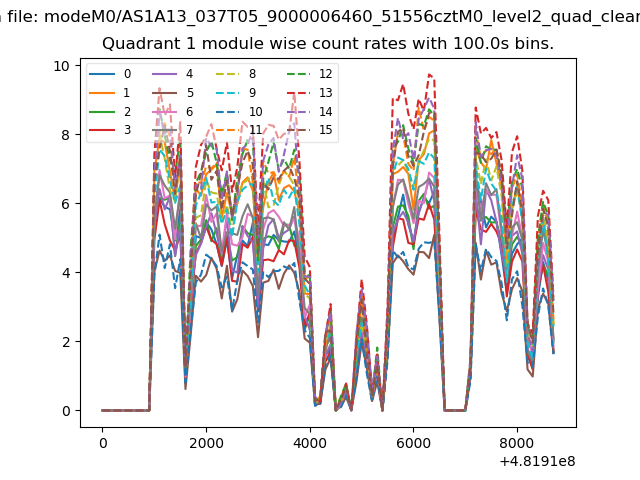
| Module-wise count rates for Quadrant A Data is divided into 100 sec bins |
 |
 |
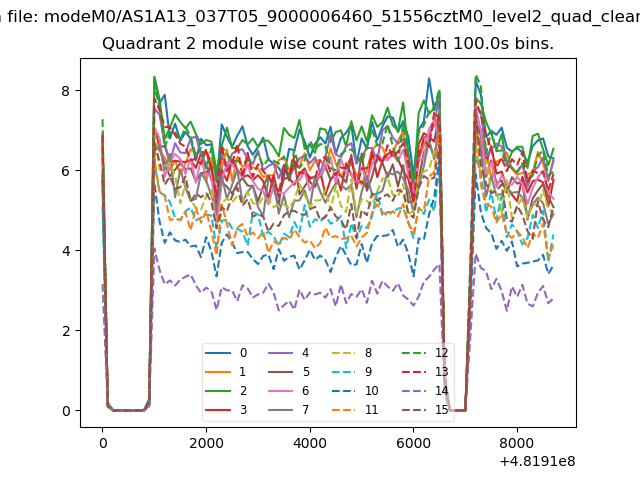
| Module-wise count rates for Quadrant B Data is divided into 100 sec bins |
 |
 |
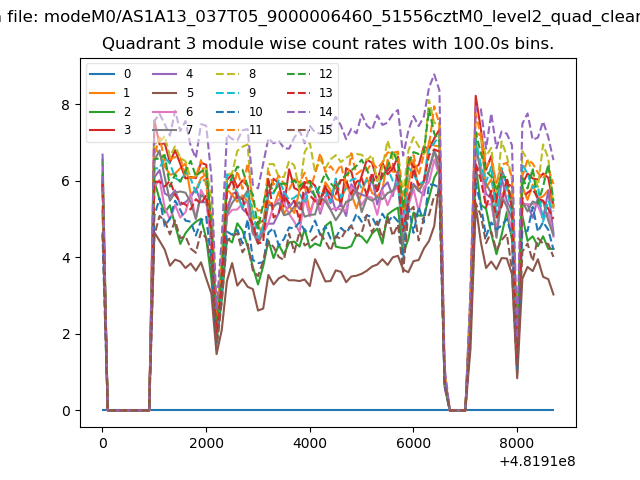
| Module-wise count rates for Quadrant C Data is divided into 100 sec bins |
 |
 |
| Module-wise count rates for Quadrant D Data is divided into 100 sec bins |
 |
 |
| Parameter | Plot |
|---|---|
| CZT HV Monitor | 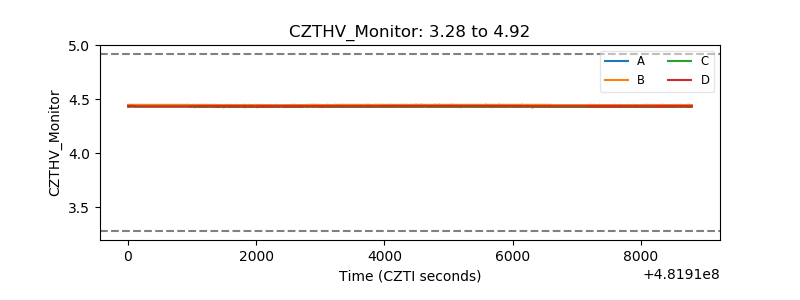 |
| D_VDD | 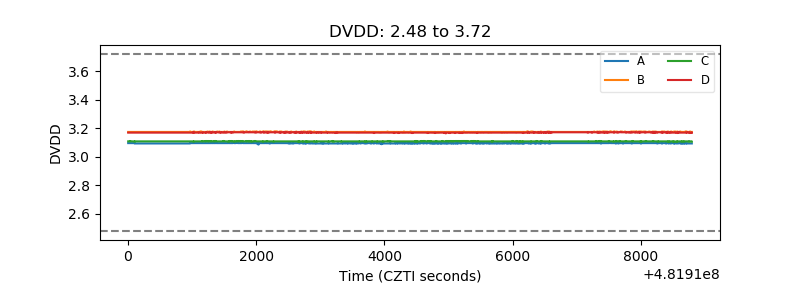 |
| Temperature 1 | 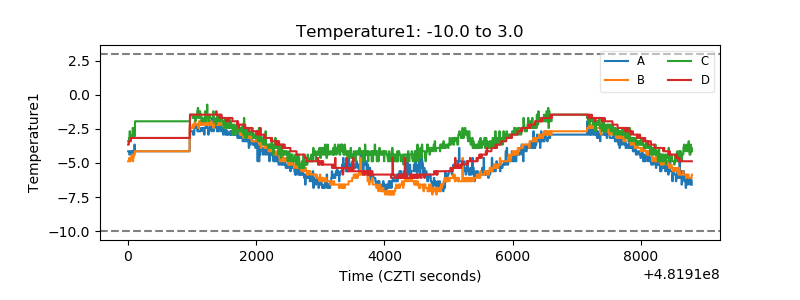 |
| Veto HV Monitor | 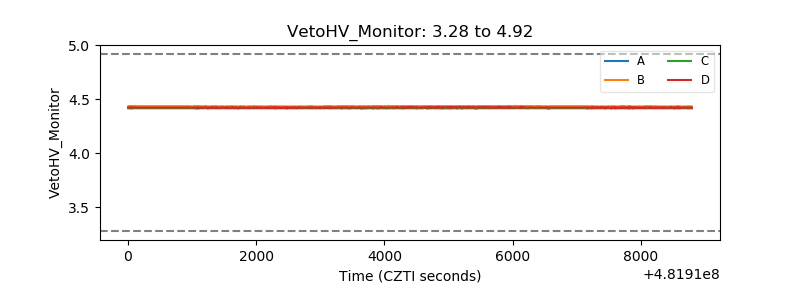 |
| Veto LLD | 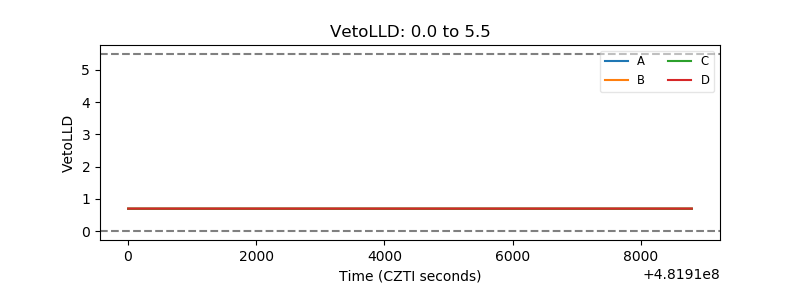 |
| Alpha Counter | 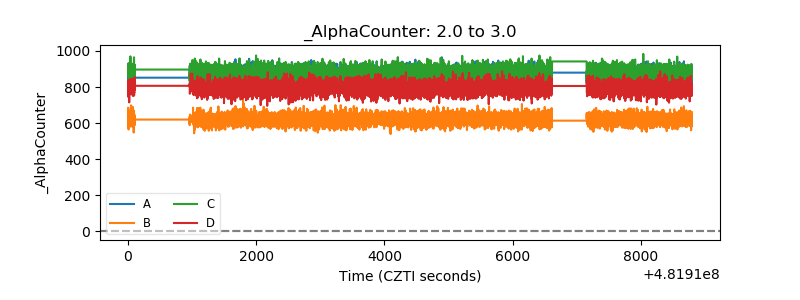 |
| _CPM_Rate | 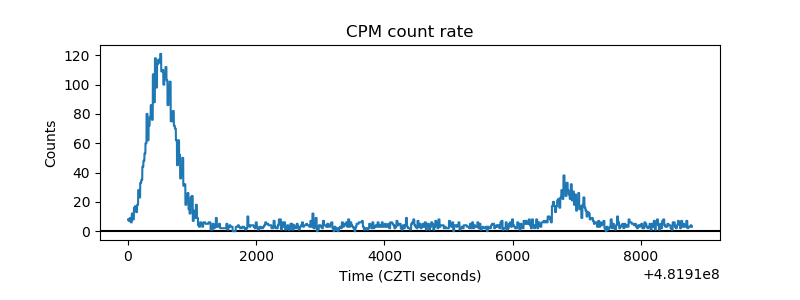 |
| CZT Counter | 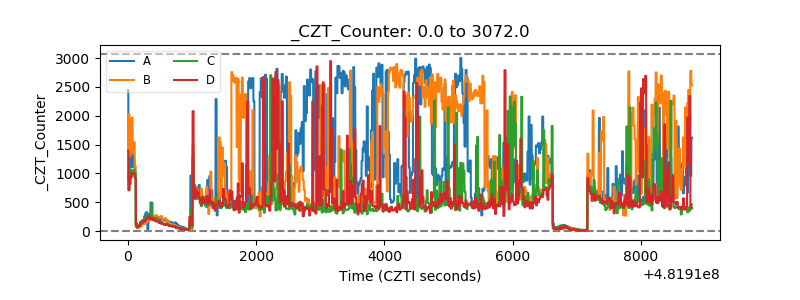 |
| +2.5 Volts monitor | 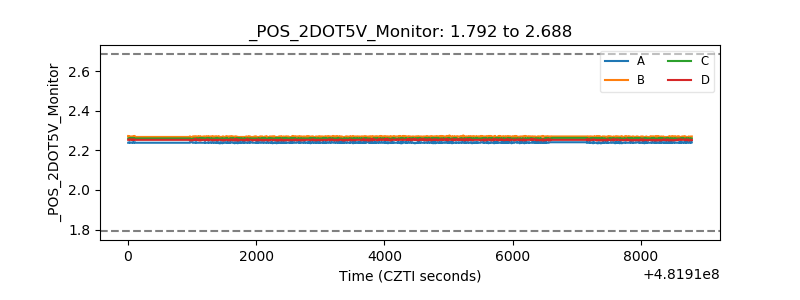 |
| +5 Volts monitor | 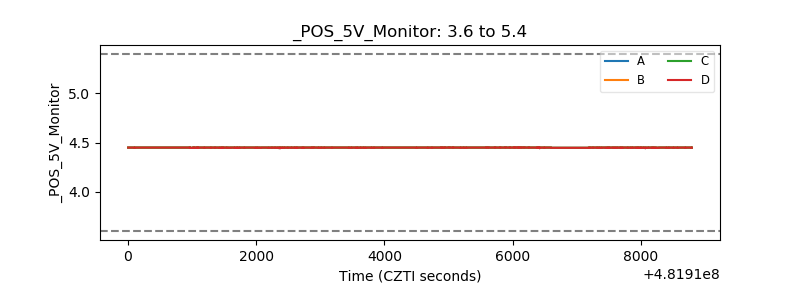 |
| _ROLL_ROT | 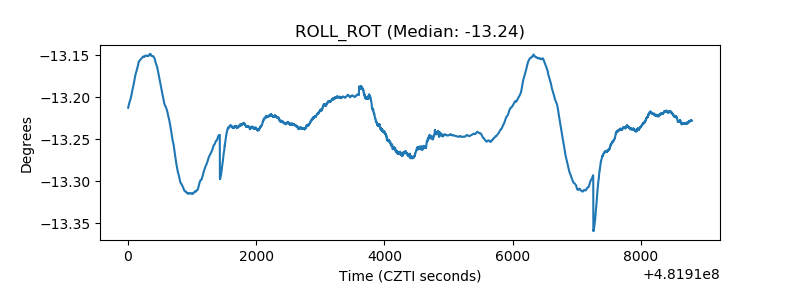 |
| _Roll_DEC | 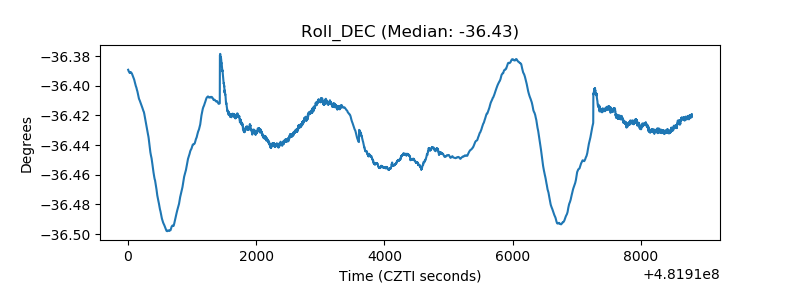 |
| _Roll_RA | 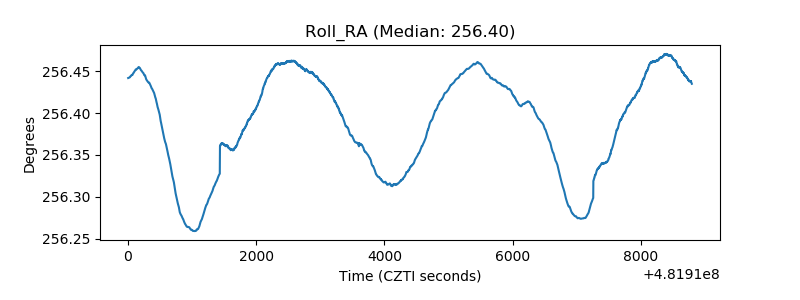 |
| Veto Counter | 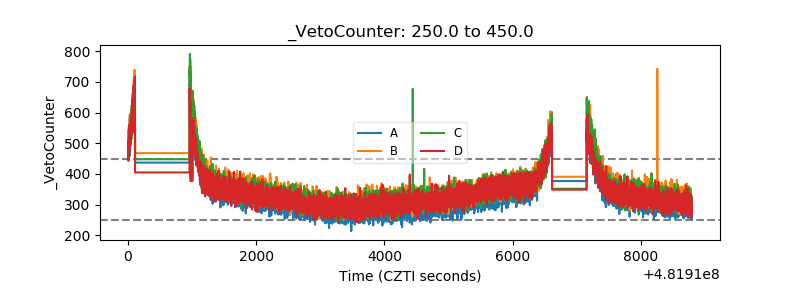 |