| Param | Original file | Final file |
|---|---|---|
| Filename | modeM0/AS1A13_037T05_9000006460_51557cztM0_level2.fits | modeM0/AS1A13_037T05_9000006460_51557cztM0_level2_quad_clean.evt |
| Size (bytes) | 827,328,960 | 90,869,760 |
| Size | 789.0 MB | 86.7 MB |
| Events in quadrant A | 8,348,001 | 589,846 |
| Events in quadrant B | 11,154,679 | 454,501 |
| Events in quadrant C | 5,213,701 | 627,397 |
| Events in quadrant D | 5,352,262 | 578,549 |
| Mode M0 | |||
|---|---|---|---|
| Quadrant | BADHDUFLAG | Total packets | Discarded packets |
| A | 0 | 29821 | 0 |
| B | 0 | 38109 | 3 |
| C | 0 | 20730 | 0 |
| D | 0 | 21017 | 0 |
| Mode SS | |||
|---|---|---|---|
| Quadrant | BADHDUFLAG | Total packets | Discarded packets |
| A | 0 | 144 | 0 |
| B | 0 | 144 | 0 |
| C | 0 | 144 | 0 |
| D | 0 | 144 | 0 |
| Quadrant | Total seconds | Saturated seconds | Saturation percentage |
|---|---|---|---|
| A | 7190 | 1116 | 15.521558% |
| B | 7190 | 3116 | 43.337969% |
| C | 7190 | 474 | 6.592490% |
| D | 7190 | 475 | 6.606398% |
Noise dominated data is calculated using 1-second bins in cleaned event files. If a bin has >2000 counts, and if more than 50% of those come from <1% of pixels, then it is considered to be noise-dominated and hence unusable.
| Quadrant | # 1 sec bins | Bins with >0 counts | Bins with >2000 counts | High rate bins dominated by noise | Noise dominated (total time) | Noise dominated (detector-on time) | Marked lightcurve |
|---|---|---|---|---|---|---|---|
| A | 7190 | 7190 | 803 | 803 | 11.17% | 11.17% | 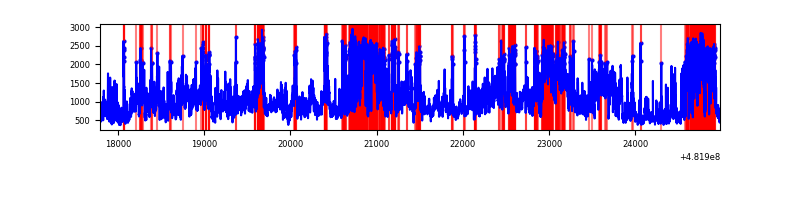 |
| B | 7190 | 7190 | 2680 | 2680 | 37.27% | 37.27% | 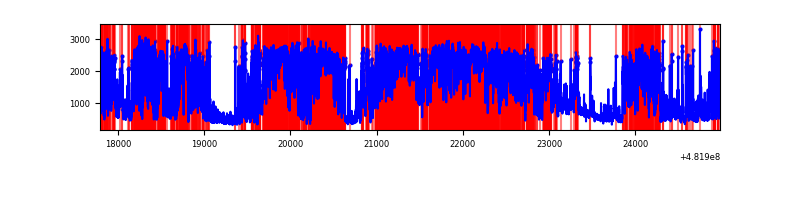 |
| C | 7190 | 7190 | 410 | 410 | 5.70% | 5.70% | 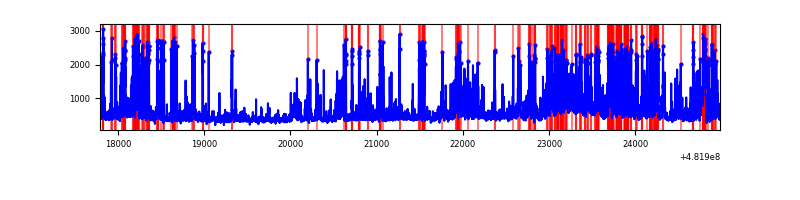 |
| D | 7190 | 7190 | 467 | 467 | 6.50% | 6.50% | 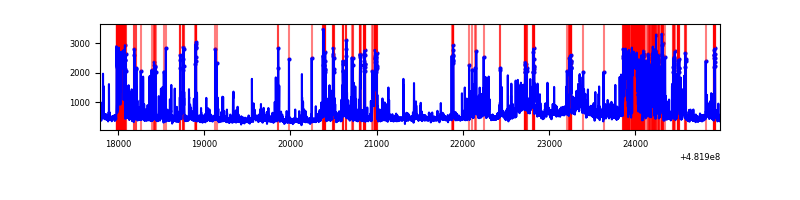 |
Top three noisy pixels from each quadrant. If the there are fewer than three noisy pixels in the level2.evt file, extra rows are filled as -1
| Pixel properties | Quadrant properties | ||||||
|---|---|---|---|---|---|---|---|
| Quadrant | DetID | PixID | Counts | Sigma | Mean | Median | Sigma |
| A | 12 | 3 | 1960465 | 10731.83 | 733 | 717 | 182.6 |
| A | 12 | 250 | 1952495 | 10688.19 | 733 | 717 | 182.6 |
| A | 7 | 64 | 376669 | 2058.76 | 733 | 717 | 182.6 |
| B | 10 | 44 | 4274908 | 30626.32 | 644 | 620 | 139.6 |
| B | 10 | 41 | 1973583 | 14136.76 | 644 | 620 | 139.6 |
| B | 12 | 18 | 1078039 | 7719.97 | 644 | 620 | 139.6 |
| C | 0 | 177 | 1711168 | 8441.85 | 738 | 730 | 202.6 |
| C | 13 | 3 | 192035 | 944.18 | 738 | 730 | 202.6 |
| C | 15 | 157 | 125170 | 614.17 | 738 | 730 | 202.6 |
| D | 12 | 6 | 962897 | 4734.57 | 724 | 699 | 203.2 |
| D | 8 | 176 | 729695 | 3587.08 | 724 | 699 | 203.2 |
| D | 2 | 120 | 201018 | 985.68 | 724 | 699 | 203.2 |
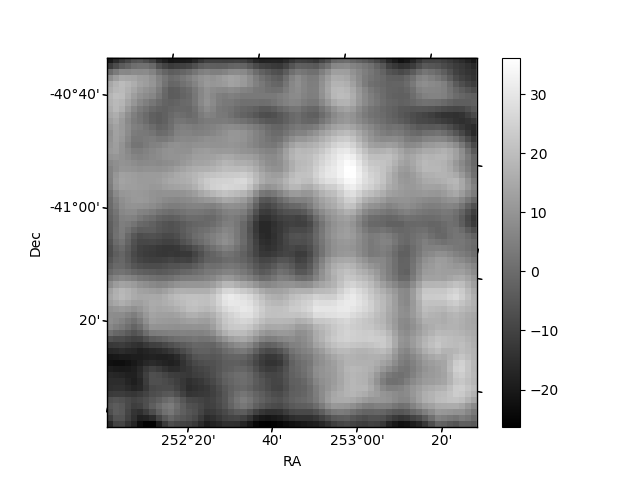
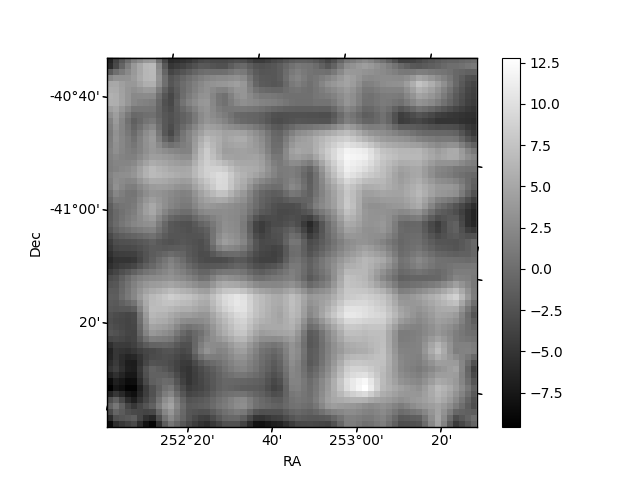
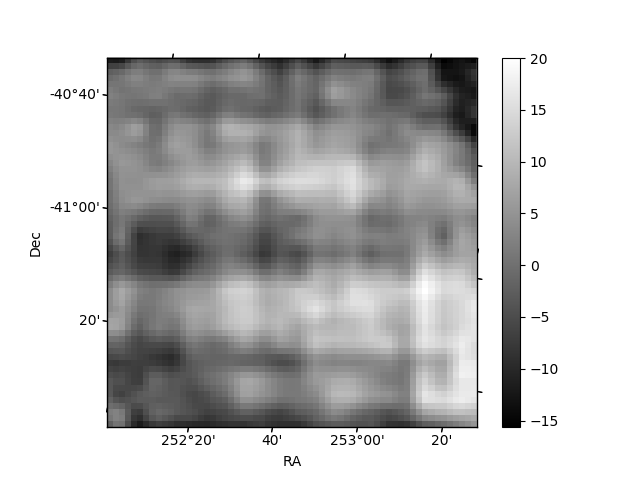
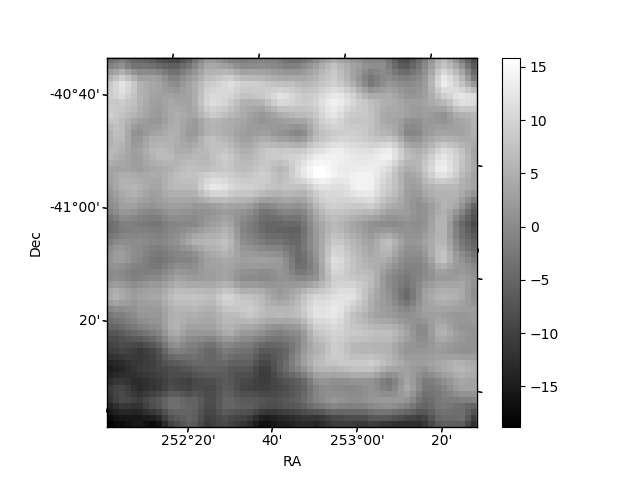
Histogram calculated using DETX and DETY for each event in the final _common_clean file
| Quadrant A | 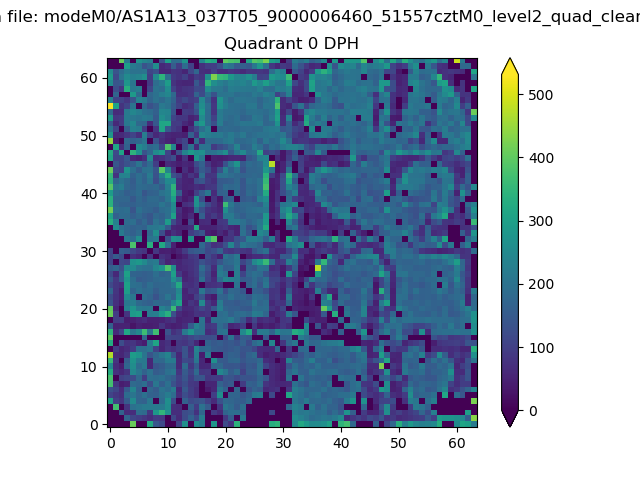 |
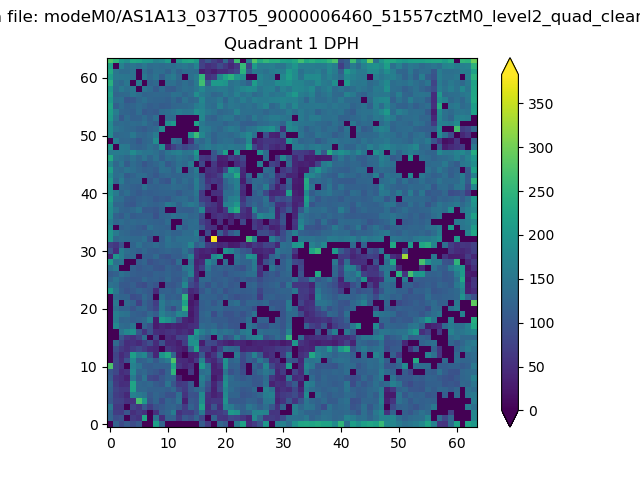 |
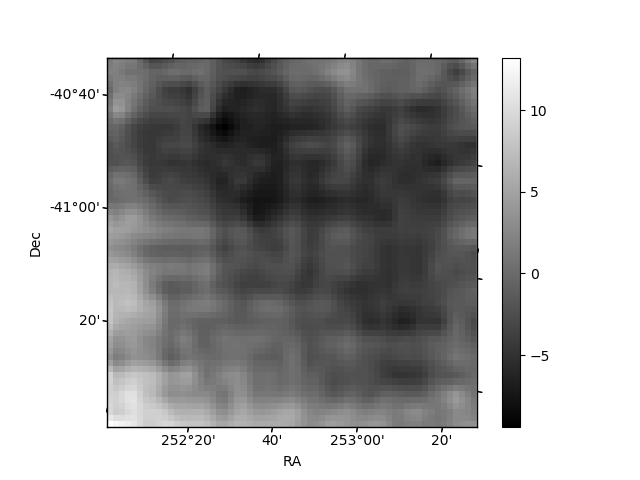
Quadrant B |
|---|---|---|---|
| Quadrant D | 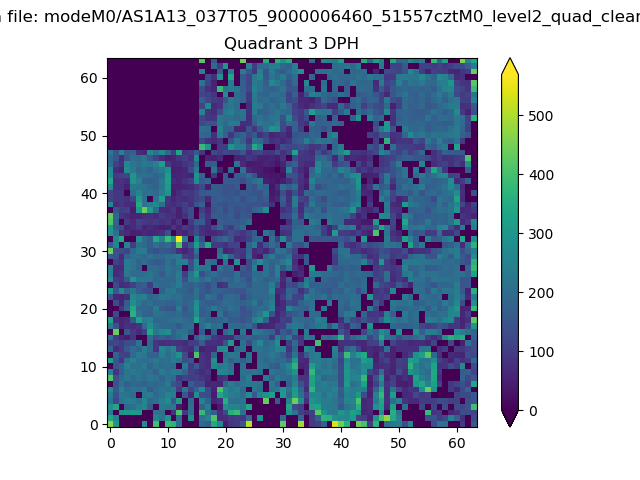 |
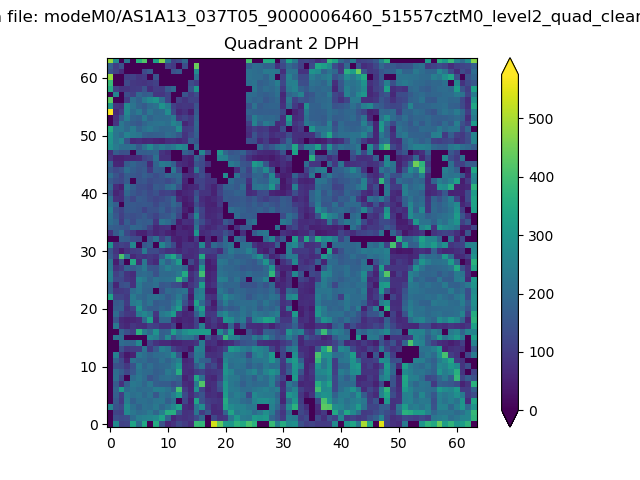 |
Quadrant C |
| Plot type | Count rate plots | Images |
|---|---|---|
| Comparison with Poisson distribution Blue bars denote a histogram of data divided into 1 sec bins. Red curve is a Poisson curve with rate = median count rate of data. |
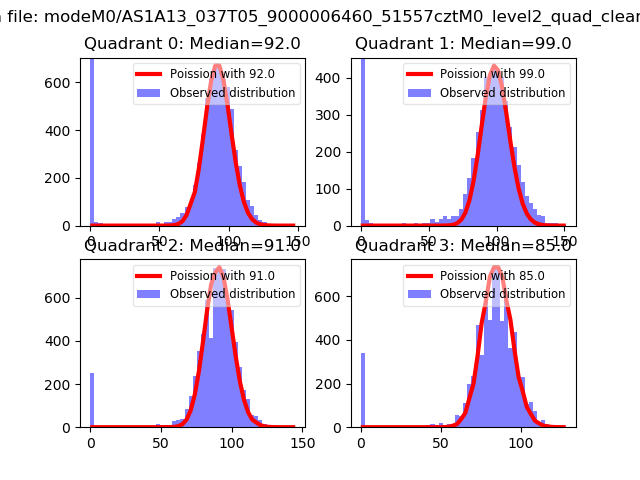 |
 |
| Quadrant-wise count rates Data is divided into 100 sec bins |
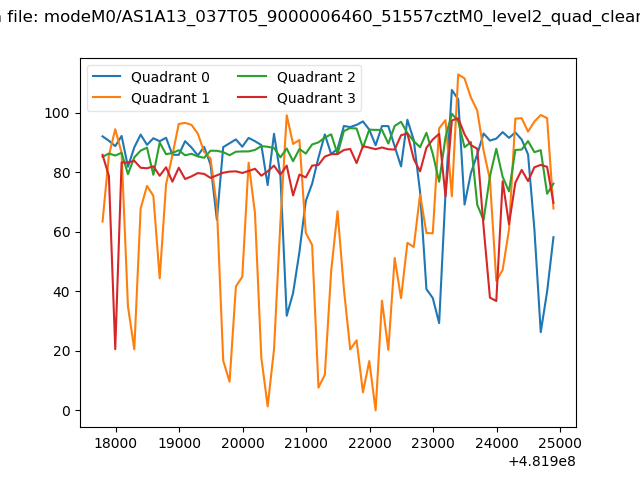 |
|
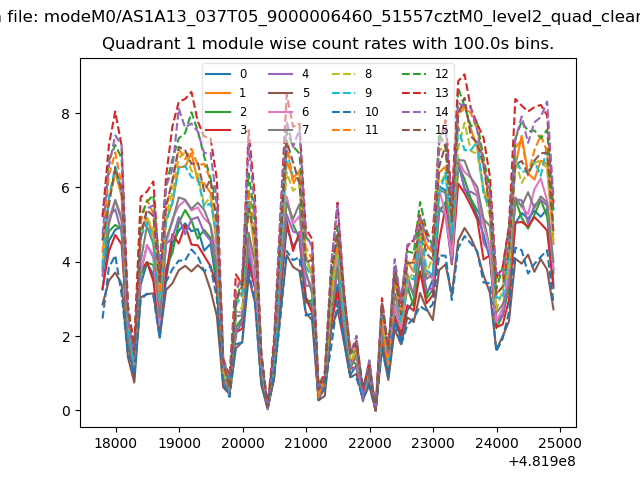
| Module-wise count rates for Quadrant A Data is divided into 100 sec bins |
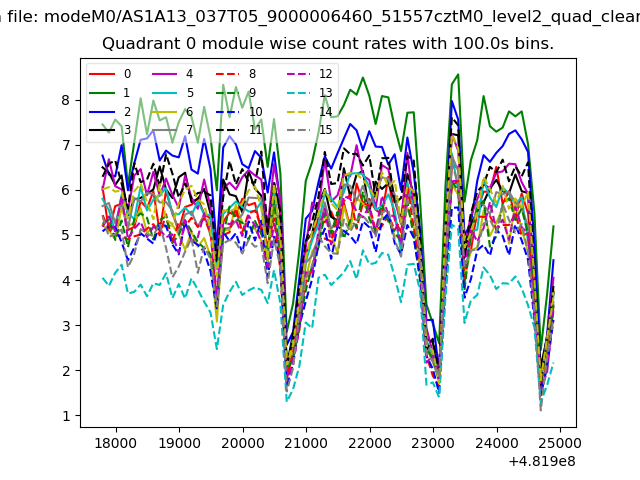 |
 |
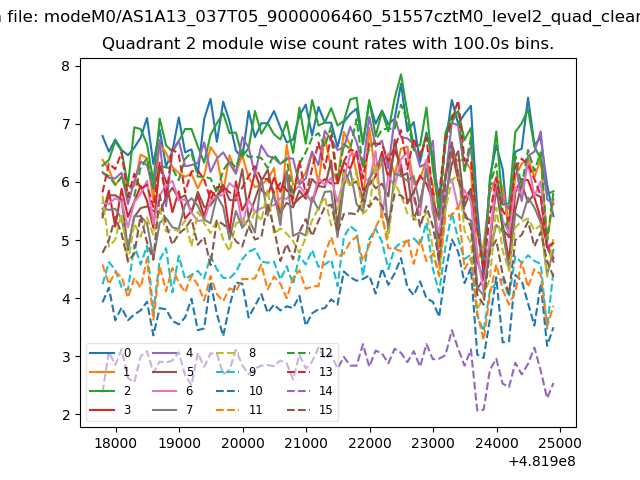
| Module-wise count rates for Quadrant B Data is divided into 100 sec bins |
 |
 |
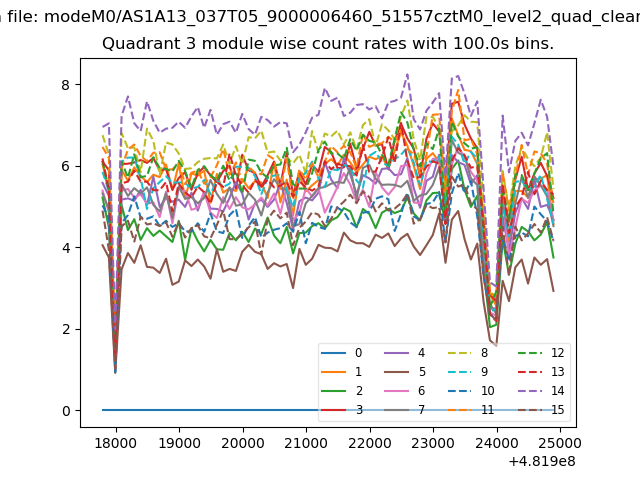
| Module-wise count rates for Quadrant C Data is divided into 100 sec bins |
 |
 |
| Module-wise count rates for Quadrant D Data is divided into 100 sec bins |
 |
 |
| Parameter | Plot |
|---|---|
| CZT HV Monitor |  |
| D_VDD | 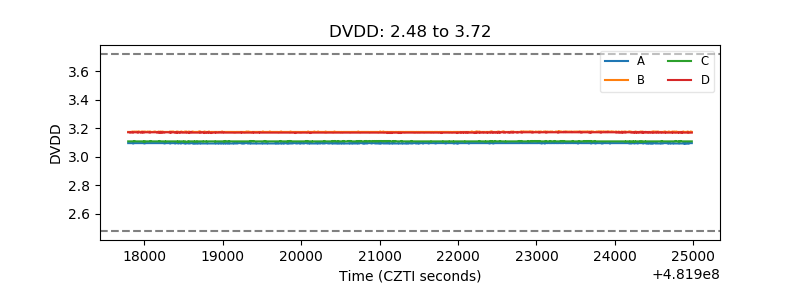 |
| Temperature 1 | 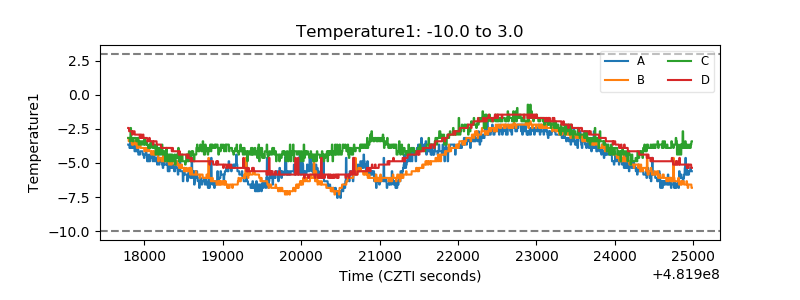 |
| Veto HV Monitor | 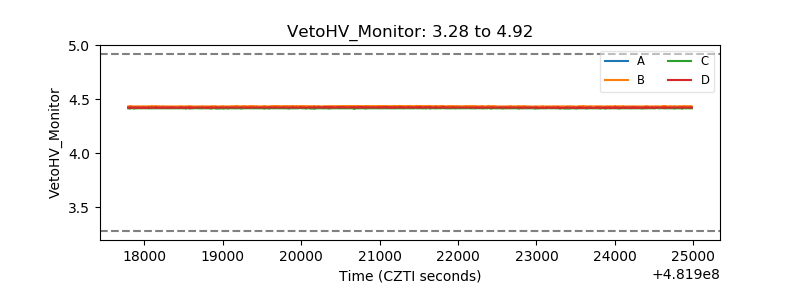 |
| Veto LLD | 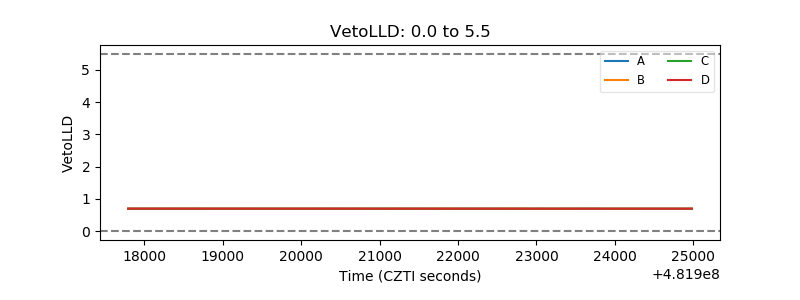 |
| Alpha Counter | 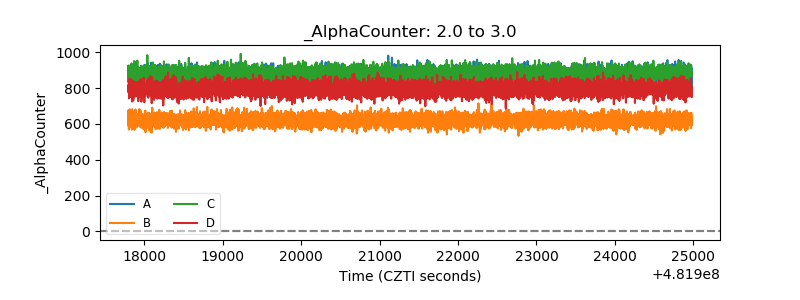 |
| _CPM_Rate | 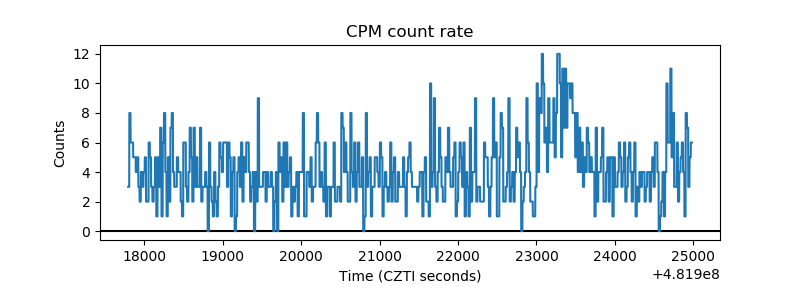 |
| CZT Counter | 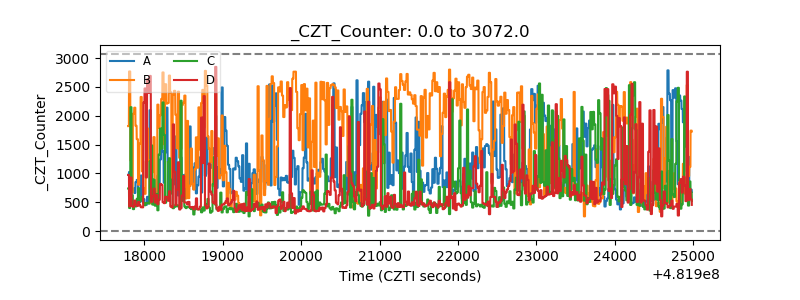 |
| +2.5 Volts monitor | 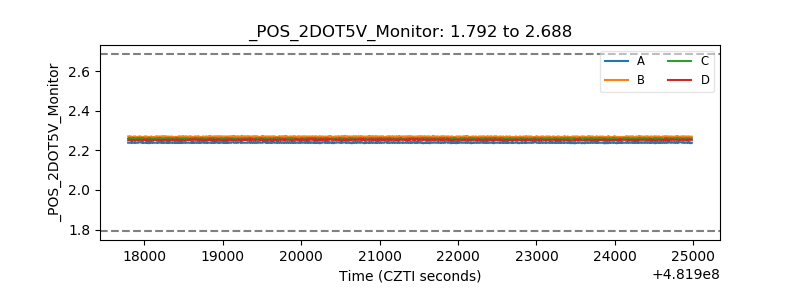 |
| +5 Volts monitor | 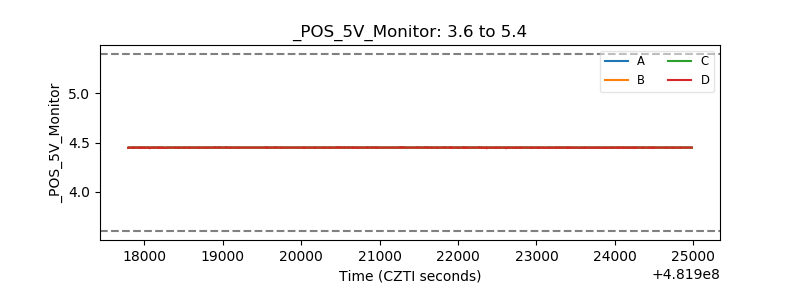 |
| _ROLL_ROT | 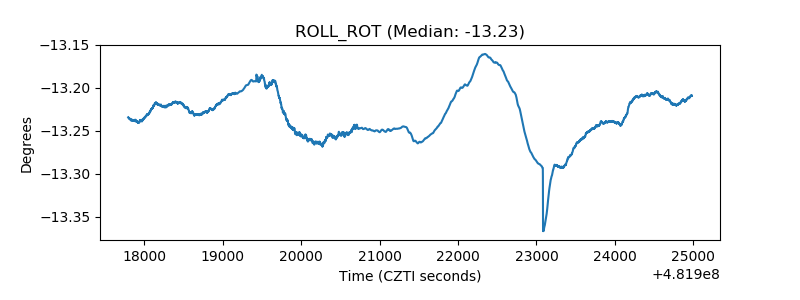 |
| _Roll_DEC | 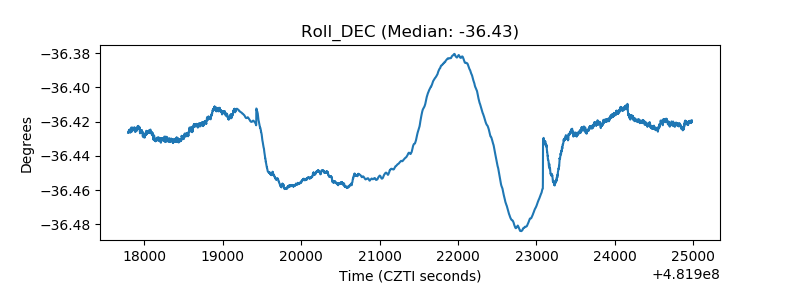 |
| _Roll_RA | 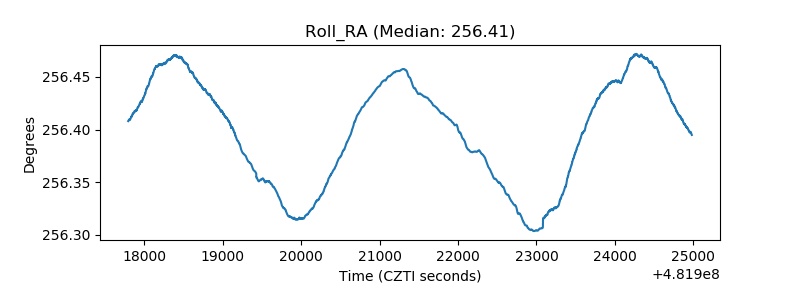 |
| Veto Counter | 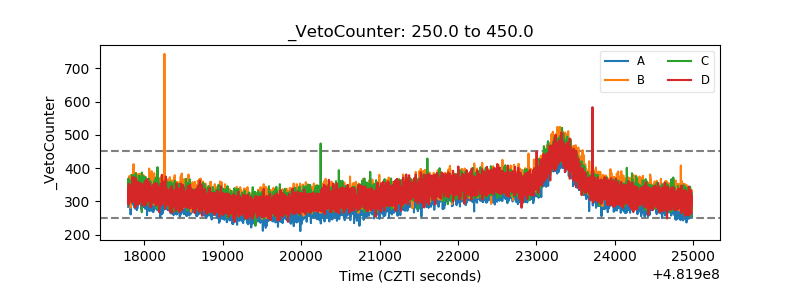 |