| Param | Original file | Final file |
|---|---|---|
| Filename | modeM0/AS1A13_037T05_9000006460_51558cztM0_level2.fits | modeM0/AS1A13_037T05_9000006460_51558cztM0_level2_quad_clean.evt |
| Size (bytes) | 861,894,720 | 109,944,000 |
| Size | 822.0 MB | 104.9 MB |
| Events in quadrant A | 9,826,657 | 629,049 |
| Events in quadrant B | 7,551,518 | 768,723 |
| Events in quadrant C | 7,326,444 | 706,179 |
| Events in quadrant D | 6,568,058 | 656,121 |
| Mode M0 | |||
|---|---|---|---|
| Quadrant | BADHDUFLAG | Total packets | Discarded packets |
| A | 0 | 34884 | 0 |
| B | 0 | 28139 | 0 |
| C | 0 | 27625 | 0 |
| D | 0 | 25393 | 0 |
| Mode SS | |||
|---|---|---|---|
| Quadrant | BADHDUFLAG | Total packets | Discarded packets |
| A | 0 | 164 | 0 |
| B | 0 | 164 | 0 |
| C | 0 | 164 | 0 |
| D | 0 | 164 | 0 |
| Quadrant | Total seconds | Saturated seconds | Saturation percentage |
|---|---|---|---|
| A | 8180 | 1775 | 21.699267% |
| B | 8180 | 990 | 12.102689% |
| C | 8179 | 729 | 8.913070% |
| D | 8180 | 591 | 7.224939% |
Noise dominated data is calculated using 1-second bins in cleaned event files. If a bin has >2000 counts, and if more than 50% of those come from <1% of pixels, then it is considered to be noise-dominated and hence unusable.
| Quadrant | # 1 sec bins | Bins with >0 counts | Bins with >2000 counts | High rate bins dominated by noise | Noise dominated (total time) | Noise dominated (detector-on time) | Marked lightcurve |
|---|---|---|---|---|---|---|---|
| A | 8180 | 8180 | 1423 | 1423 | 17.40% | 17.40% |  |
| B | 8180 | 8180 | 709 | 709 | 8.67% | 8.67% | 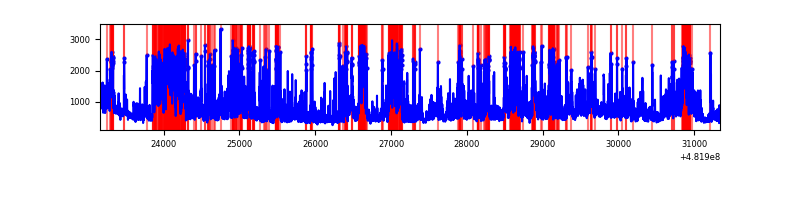 |
| C | 8179 | 8179 | 642 | 642 | 7.85% | 7.85% |  |
| D | 8180 | 8180 | 537 | 537 | 6.56% | 6.56% | 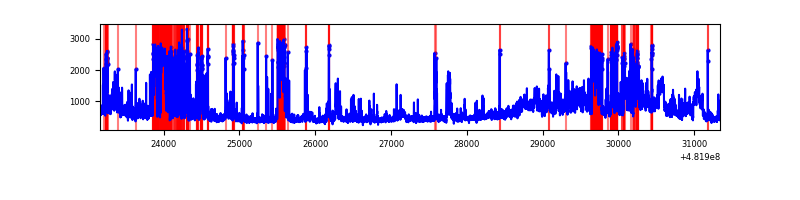 |
Top three noisy pixels from each quadrant. If the there are fewer than three noisy pixels in the level2.evt file, extra rows are filled as -1
| Pixel properties | Quadrant properties | ||||||
|---|---|---|---|---|---|---|---|
| Quadrant | DetID | PixID | Counts | Sigma | Mean | Median | Sigma |
| A | 12 | 250 | 2544238 | 12456.22 | 820 | 797 | 204.2 |
| A | 7 | 64 | 1581245 | 7740.07 | 820 | 797 | 204.2 |
| A | 12 | 3 | 915674 | 4480.51 | 820 | 797 | 204.2 |
| B | 10 | 44 | 1837956 | 9995.07 | 856 | 826 | 183.8 |
| B | 10 | 41 | 1182398 | 6428.45 | 856 | 826 | 183.8 |
| B | 12 | 18 | 362187 | 1966.02 | 856 | 826 | 183.8 |
| C | 0 | 177 | 2857594 | 12316.87 | 845 | 837 | 231.9 |
| C | 15 | 157 | 489439 | 2106.6 | 845 | 837 | 231.9 |
| C | 13 | 3 | 161444 | 692.45 | 845 | 837 | 231.9 |
| D | 8 | 176 | 1060152 | 4599.32 | 826 | 798 | 230.3 |
| D | 12 | 6 | 916039 | 3973.64 | 826 | 798 | 230.3 |
| D | 6 | 42 | 414729 | 1797.13 | 826 | 798 | 230.3 |
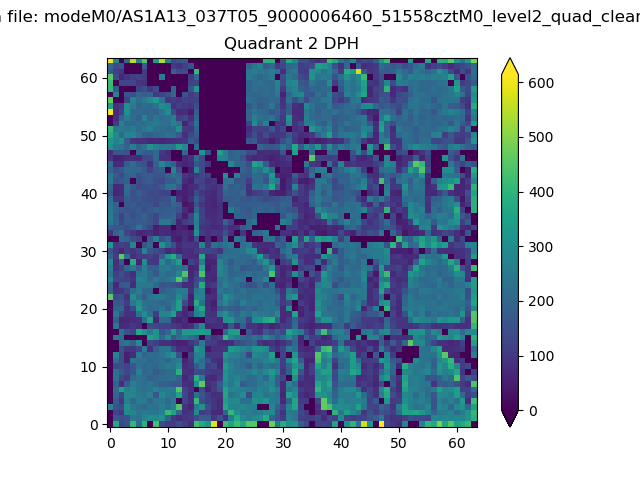
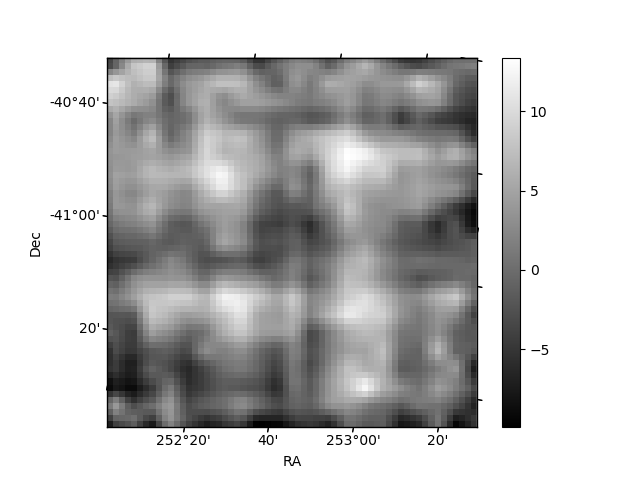
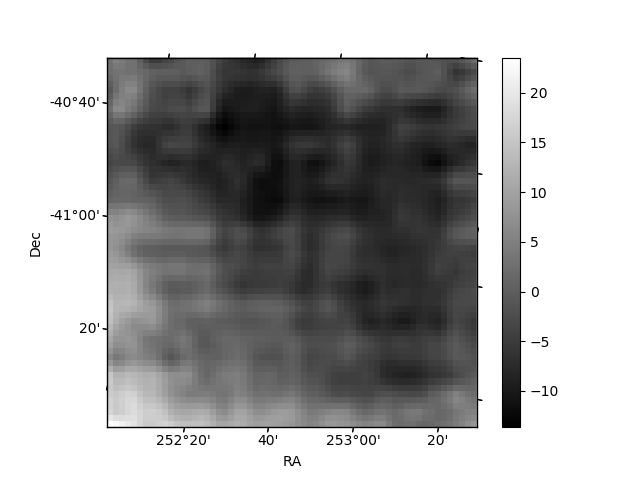
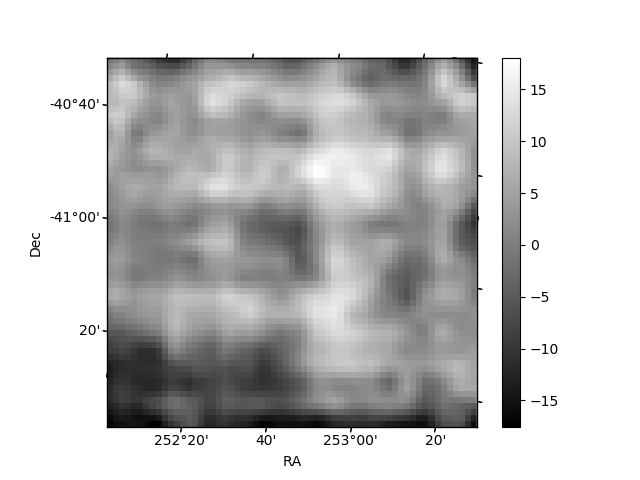
Histogram calculated using DETX and DETY for each event in the final _common_clean file
| Quadrant A | 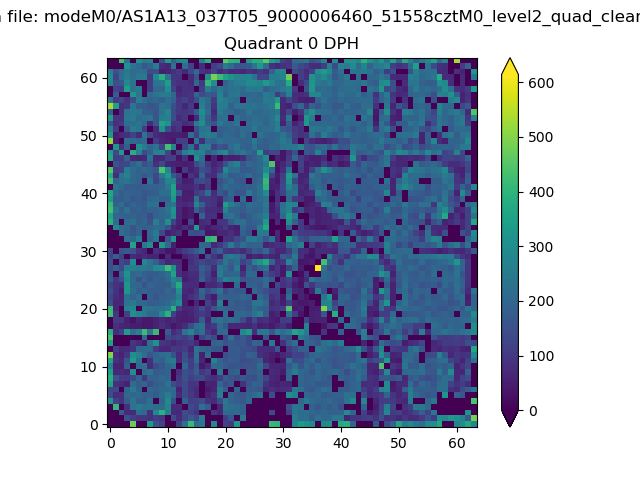 |
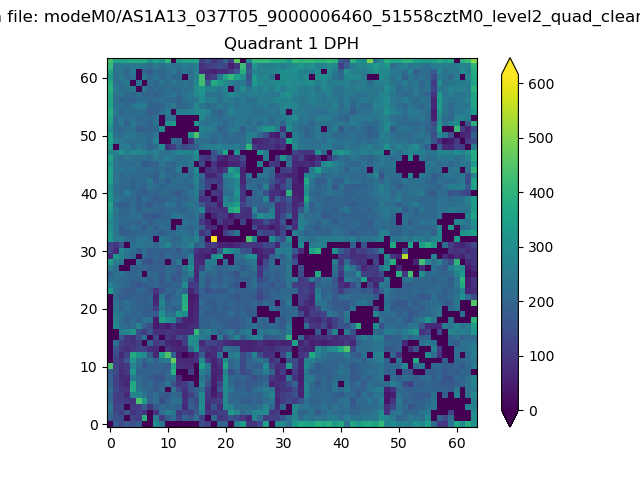 |
Quadrant B |
|---|---|---|---|
| Quadrant D | 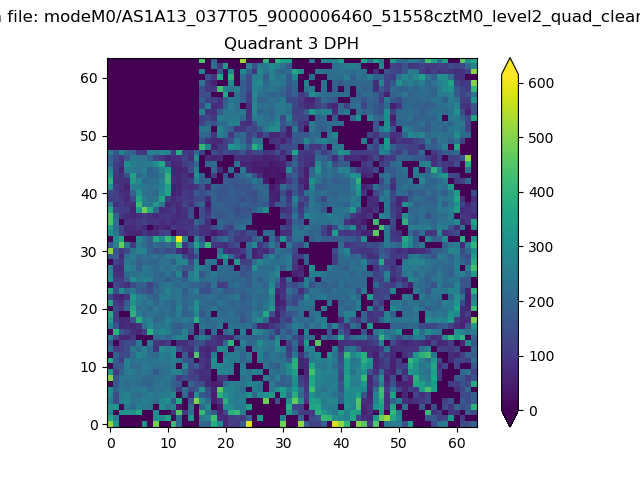 |
 |
Quadrant C |
| Plot type | Count rate plots | Images |
|---|---|---|
| Comparison with Poisson distribution Blue bars denote a histogram of data divided into 1 sec bins. Red curve is a Poisson curve with rate = median count rate of data. |
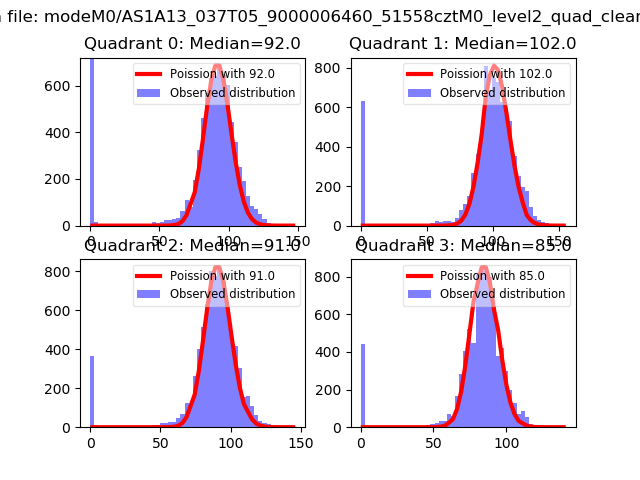 |
 |
| Quadrant-wise count rates Data is divided into 100 sec bins |
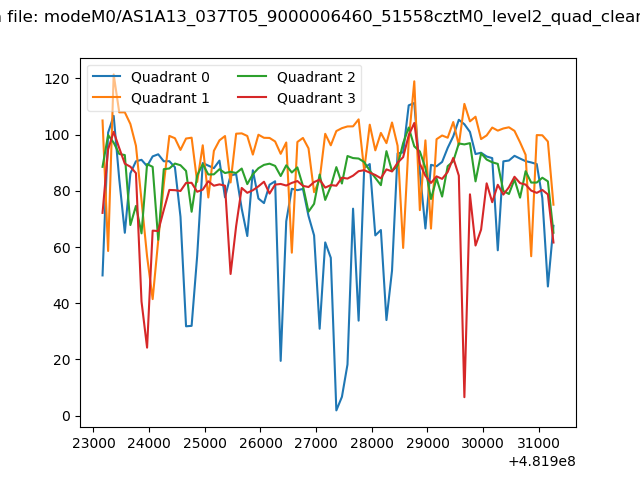 |
|
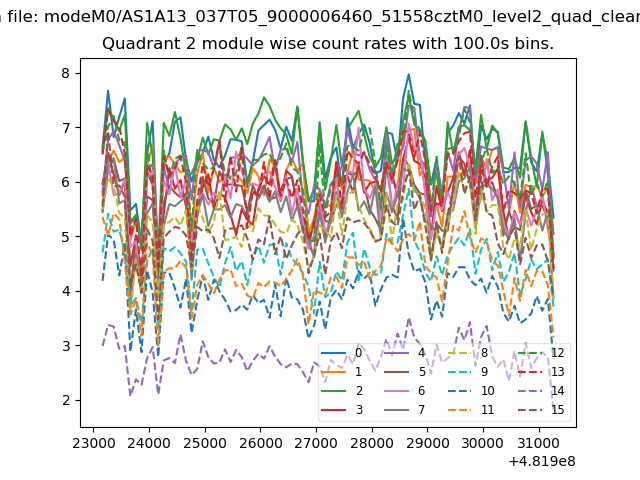
| Module-wise count rates for Quadrant A Data is divided into 100 sec bins |
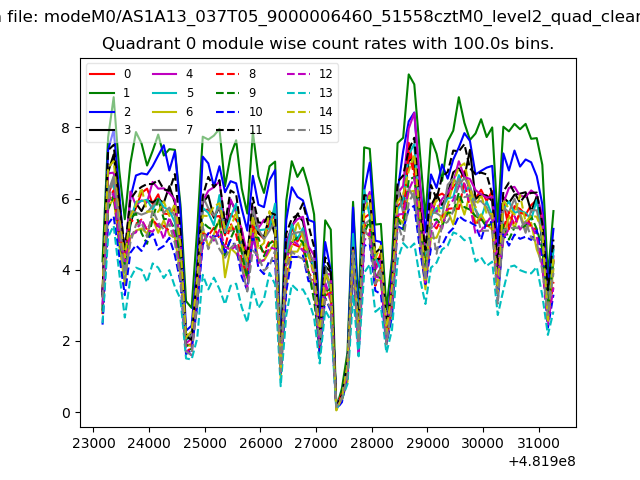 |
 |
| Module-wise count rates for Quadrant B Data is divided into 100 sec bins |
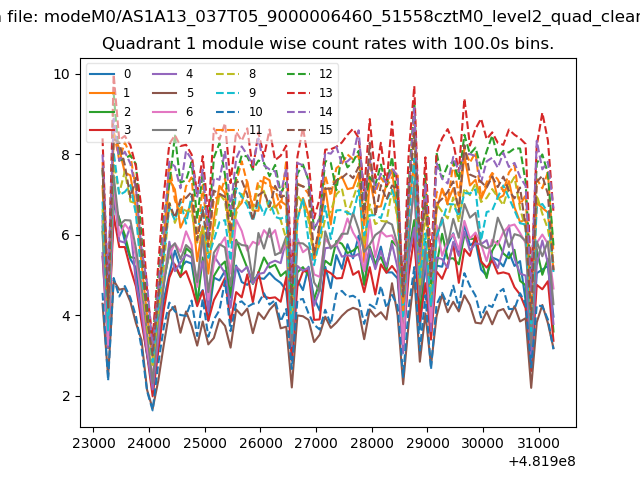 |
 |
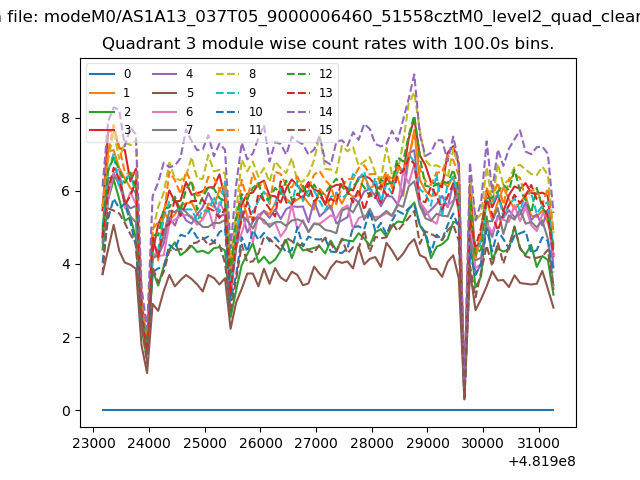
| Module-wise count rates for Quadrant C Data is divided into 100 sec bins |
 |
 |
| Module-wise count rates for Quadrant D Data is divided into 100 sec bins |
 |
 |
| Parameter | Plot |
|---|---|
| CZT HV Monitor | 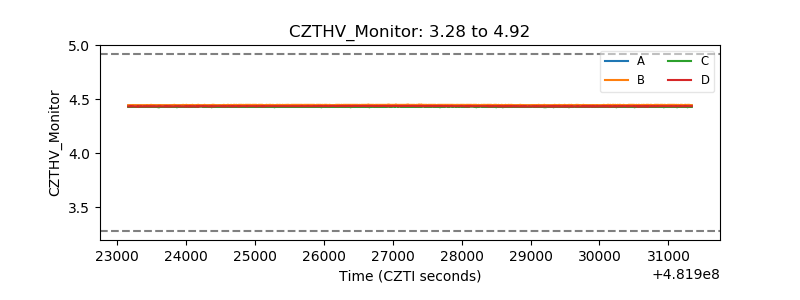 |
| D_VDD | 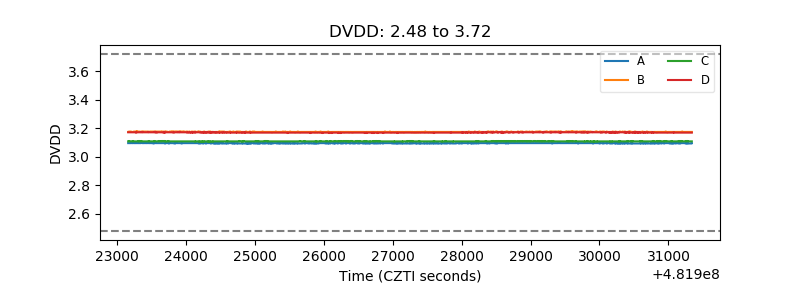 |
| Temperature 1 | 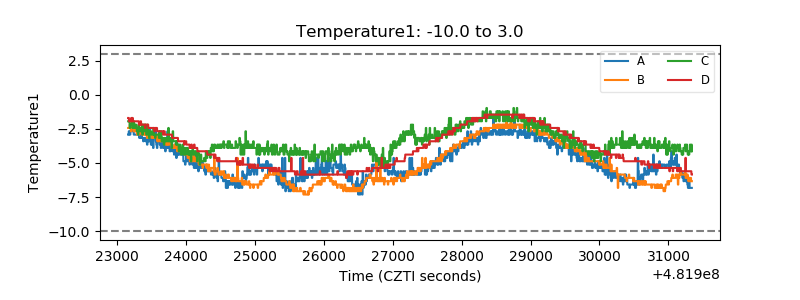 |
| Veto HV Monitor | 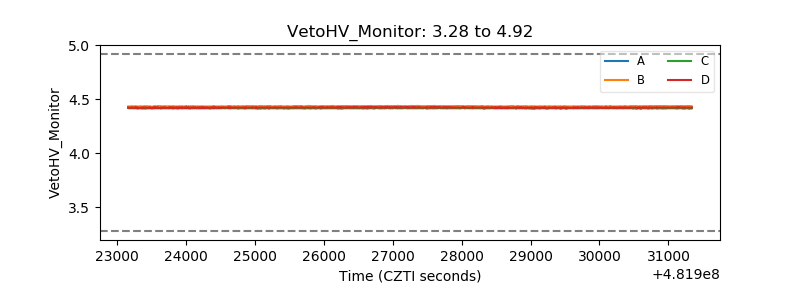 |
| Veto LLD | 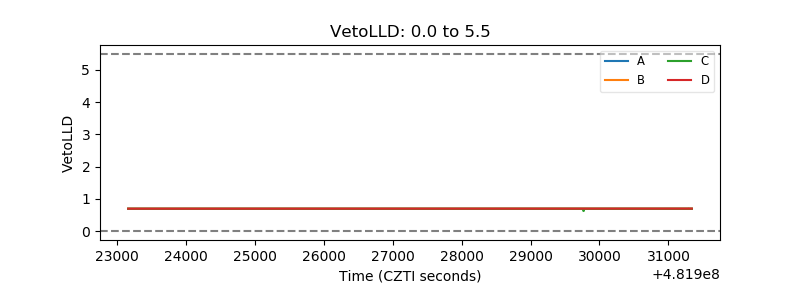 |
| Alpha Counter | 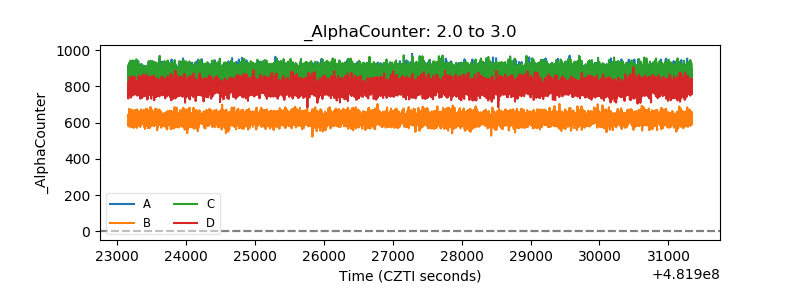 |
| _CPM_Rate | 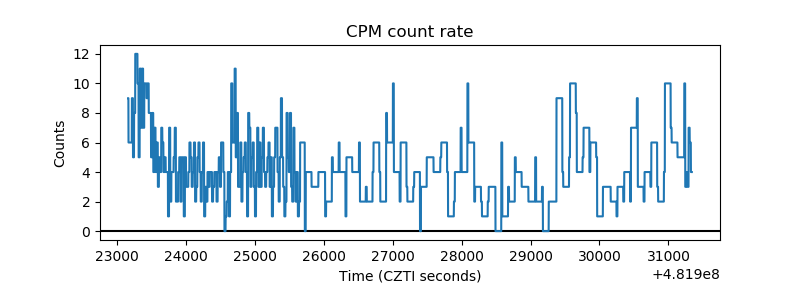 |
| CZT Counter | 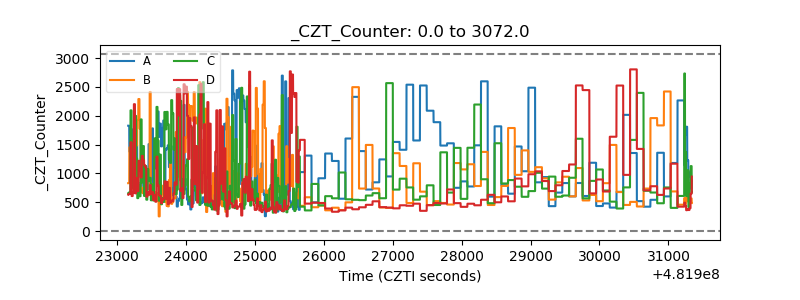 |
| +2.5 Volts monitor | 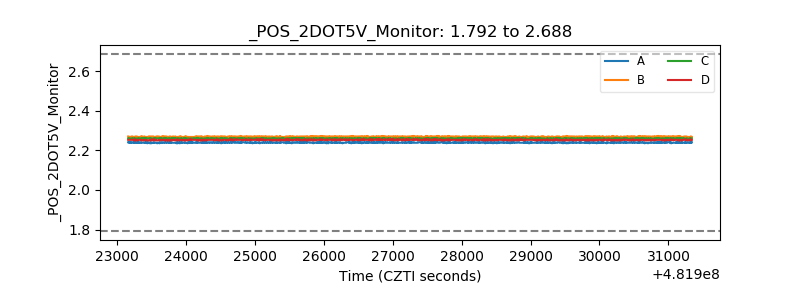 |
| +5 Volts monitor | 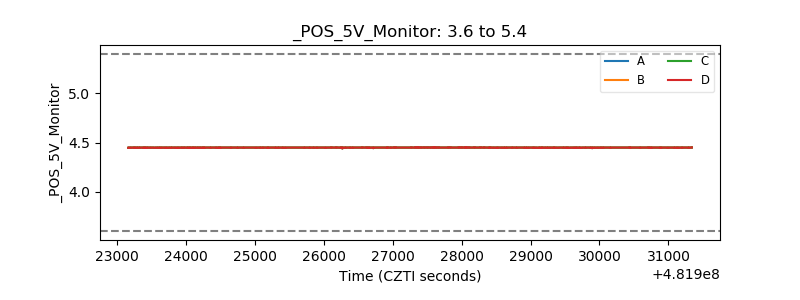 |
| _ROLL_ROT | 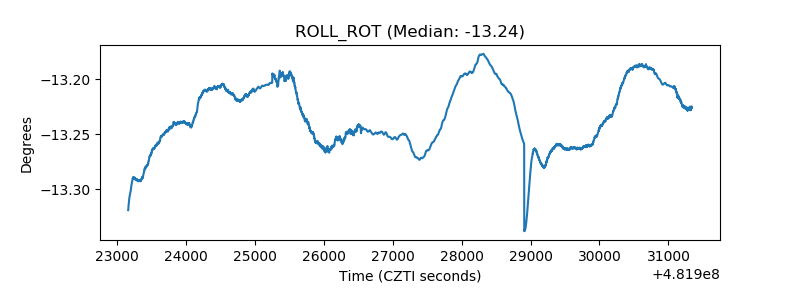 |
| _Roll_DEC | 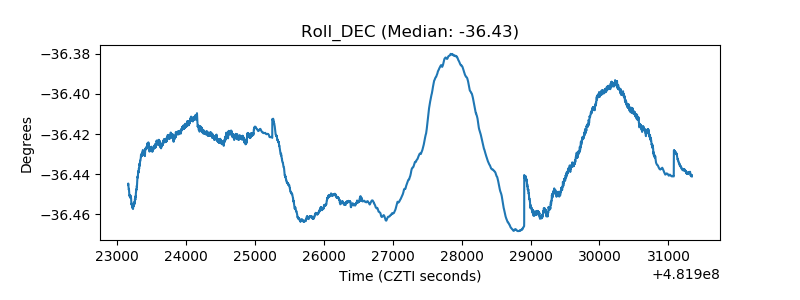 |
| _Roll_RA | 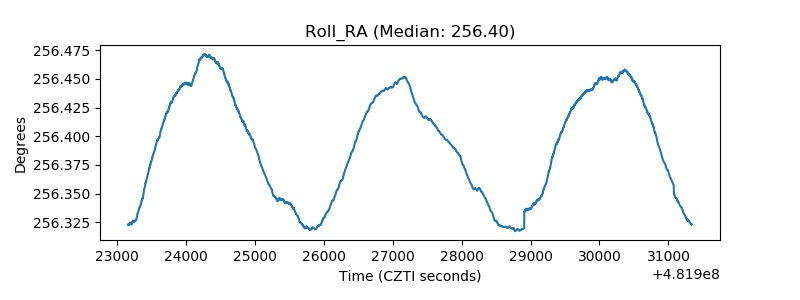 |
| Veto Counter | 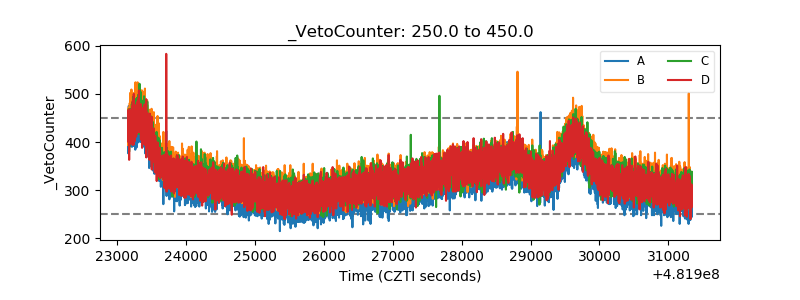 |