| Param | Original file | Final file |
|---|---|---|
| Filename | modeM0/AS1A13_037T05_9000006460_51563cztM0_level2.fits | modeM0/AS1A13_037T05_9000006460_51563cztM0_level2_quad_clean.evt |
| Size (bytes) | 1,028,151,360 | 111,093,120 |
| Size | 980.5 MB | 105.9 MB |
| Events in quadrant A | 10,974,907 | 639,498 |
| Events in quadrant B | 8,130,927 | 800,946 |
| Events in quadrant C | 8,268,145 | 709,867 |
| Events in quadrant D | 10,024,534 | 617,549 |
| Mode M0 | |||
|---|---|---|---|
| Quadrant | BADHDUFLAG | Total packets | Discarded packets |
| A | 0 | 41457 | 2914 |
| B | 0 | 31617 | 1523 |
| C | 0 | 31859 | 1247 |
| D | 0 | 36975 | 1055 |
| Mode SS | |||
|---|---|---|---|
| Quadrant | BADHDUFLAG | Total packets | Discarded packets |
| A | 0 | 178 | 4 |
| B | 0 | 180 | 6 |
| C | 0 | 179 | 7 |
| D | 0 | 177 | 5 |
| Quadrant | Total seconds | Saturated seconds | Saturation percentage |
|---|---|---|---|
| A | 8509 | 1941 | 22.811141% |
| B | 8556 | 886 | 10.355306% |
| C | 8589 | 950 | 11.060659% |
| D | 8627 | 1388 | 16.089023% |
Noise dominated data is calculated using 1-second bins in cleaned event files. If a bin has >2000 counts, and if more than 50% of those come from <1% of pixels, then it is considered to be noise-dominated and hence unusable.
| Quadrant | # 1 sec bins | Bins with >0 counts | Bins with >2000 counts | High rate bins dominated by noise | Noise dominated (total time) | Noise dominated (detector-on time) | Marked lightcurve |
|---|---|---|---|---|---|---|---|
| A | 8822 | 8591 | 1598 | 1598 | 18.11% | 18.60% | 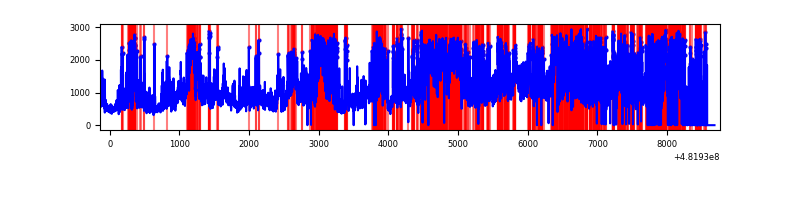 |
| B | 8867 | 8651 | 724 | 724 | 8.17% | 8.37% | 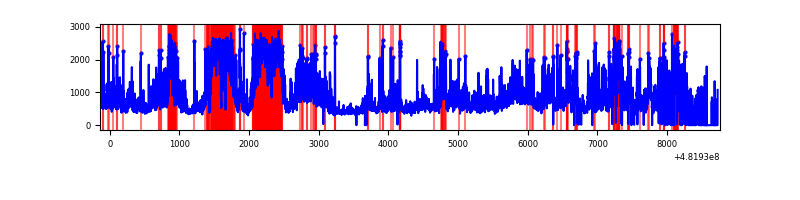 |
| C | 8870 | 8676 | 938 | 938 | 10.57% | 10.81% | 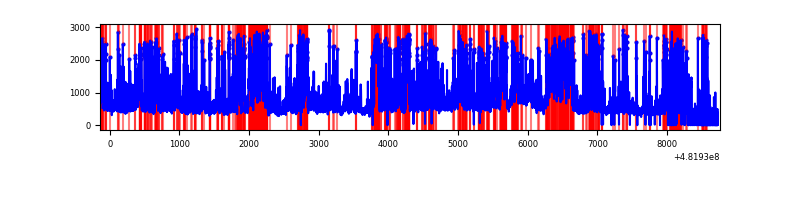 |
| D | 8901 | 8733 | 1454 | 1454 | 16.34% | 16.65% | 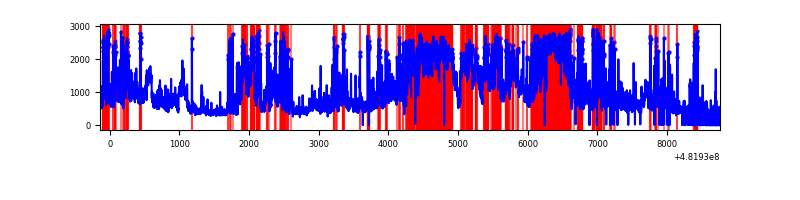 |
Top three noisy pixels from each quadrant. If the there are fewer than three noisy pixels in the level2.evt file, extra rows are filled as -1
| Pixel properties | Quadrant properties | ||||||
|---|---|---|---|---|---|---|---|
| Quadrant | DetID | PixID | Counts | Sigma | Mean | Median | Sigma |
| A | 7 | 64 | 3110642 | 15219.65 | 821 | 800 | 204.3 |
| A | 12 | 3 | 1957908 | 9578.14 | 821 | 800 | 204.3 |
| A | 12 | 250 | 940690 | 4599.85 | 821 | 800 | 204.3 |
| B | 12 | 18 | 2057757 | 10863.62 | 880 | 849 | 189.3 |
| B | 10 | 44 | 1713981 | 9047.95 | 880 | 849 | 189.3 |
| B | 0 | 171 | 190755 | 1002.99 | 880 | 849 | 189.3 |
| C | 0 | 177 | 2840417 | 11961.12 | 860 | 853 | 237.4 |
| C | 12 | 250 | 604369 | 2542.19 | 860 | 853 | 237.4 |
| C | 13 | 3 | 357663 | 1502.99 | 860 | 853 | 237.4 |
| D | 8 | 176 | 3544448 | 15148.77 | 831 | 802 | 233.9 |
| D | 7 | 60 | 1091348 | 4661.99 | 831 | 802 | 233.9 |
| D | 12 | 6 | 708581 | 3025.69 | 831 | 802 | 233.9 |
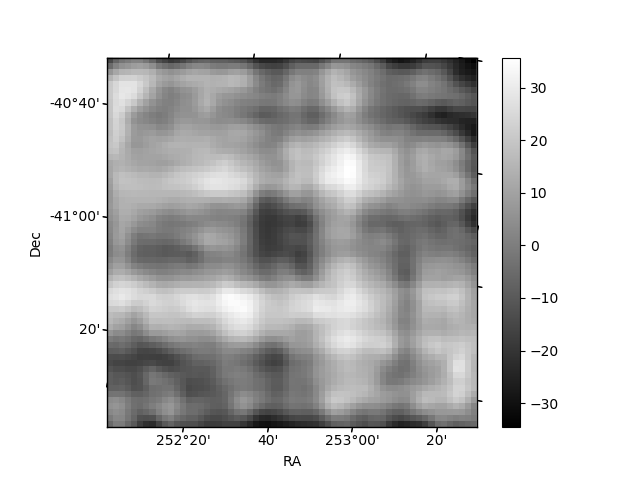
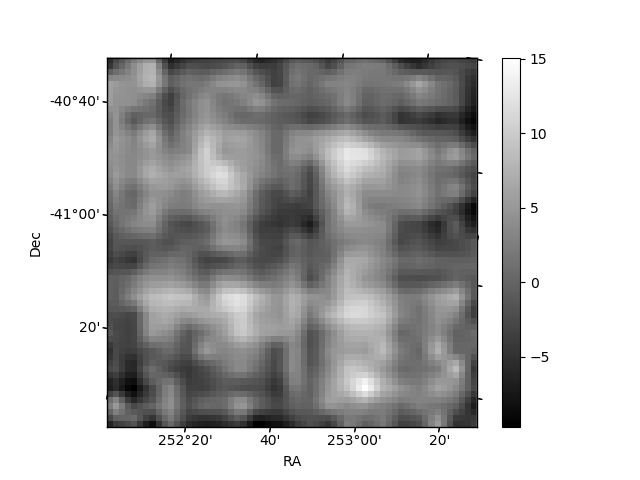
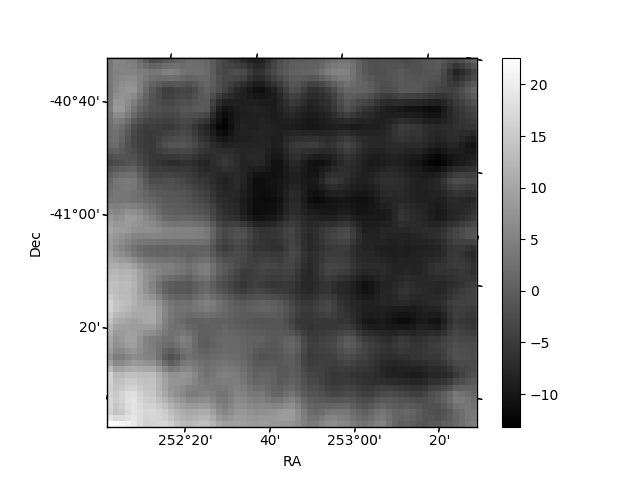
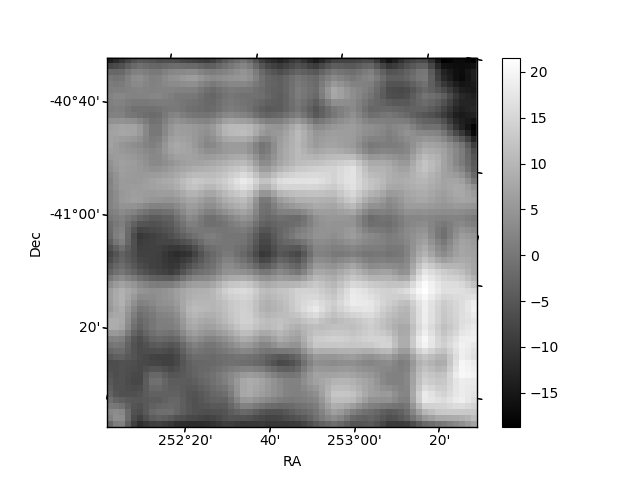
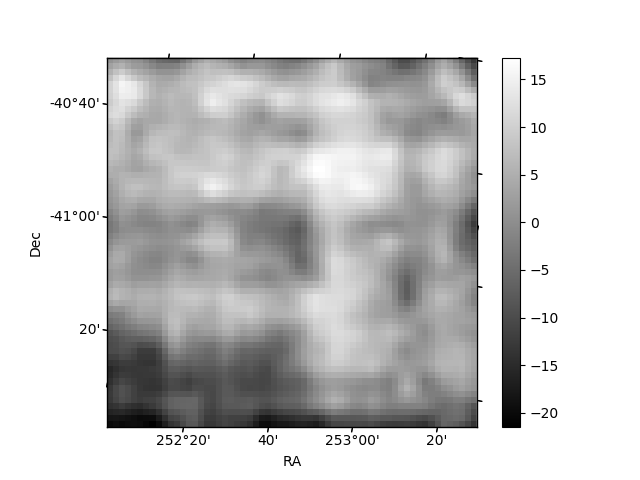
Histogram calculated using DETX and DETY for each event in the final _common_clean file
| Quadrant A | 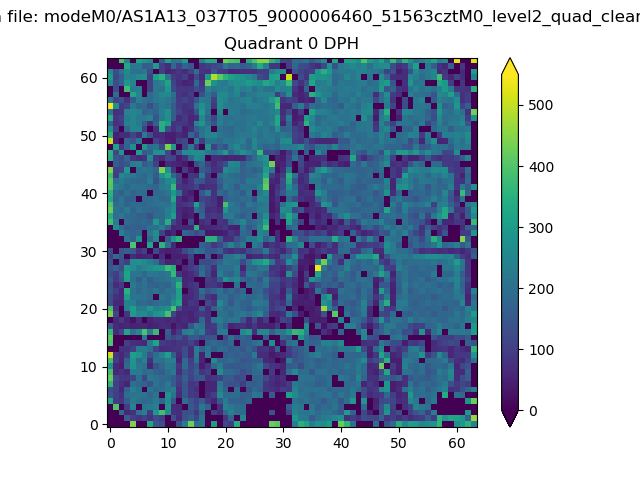 |
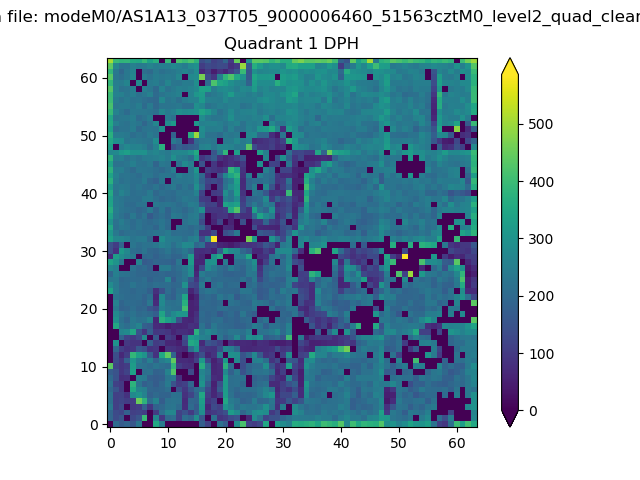 |
Quadrant B |
|---|---|---|---|
| Quadrant D | 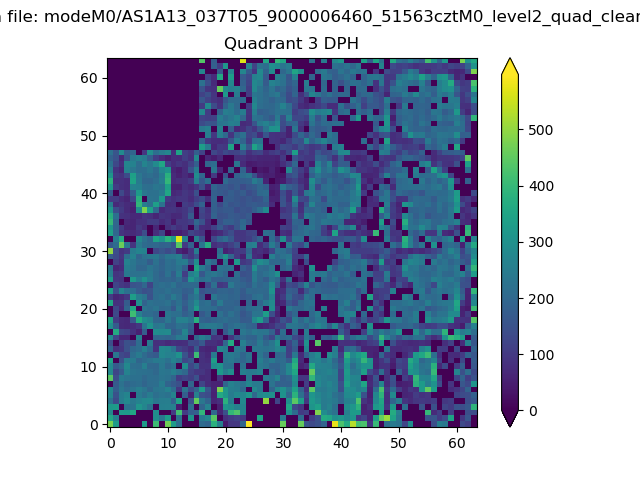 |
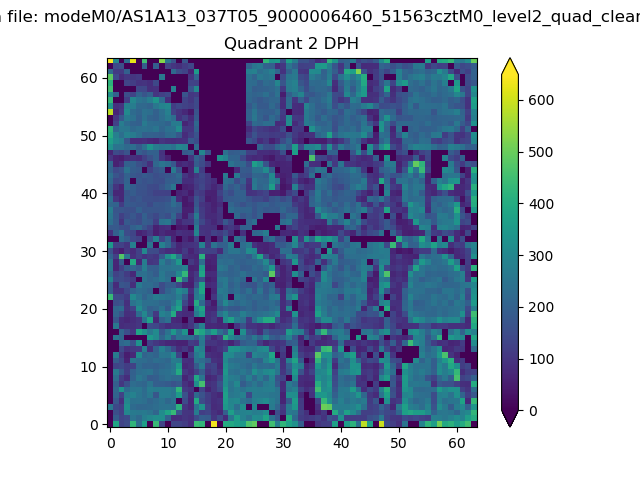 |
Quadrant C |
| Plot type | Count rate plots | Images |
|---|---|---|
| Comparison with Poisson distribution Blue bars denote a histogram of data divided into 1 sec bins. Red curve is a Poisson curve with rate = median count rate of data. |
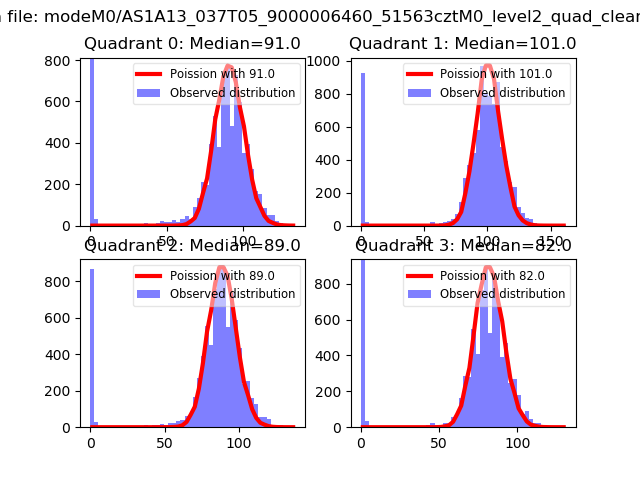 |
 |
| Quadrant-wise count rates Data is divided into 100 sec bins |
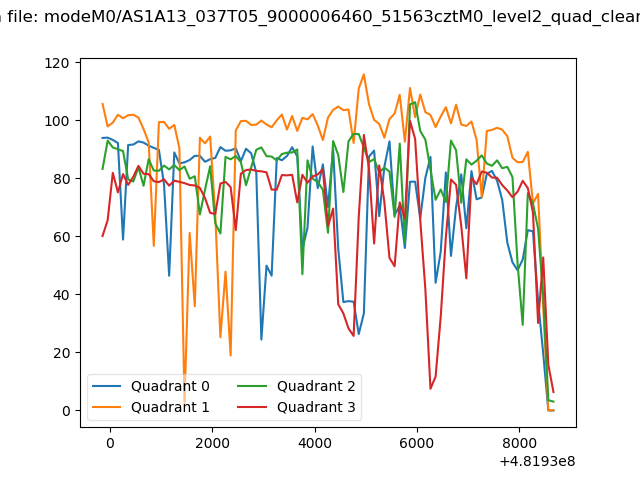 |
|
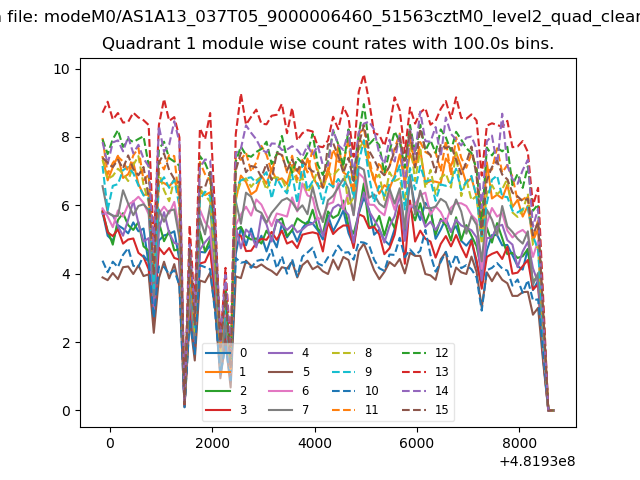
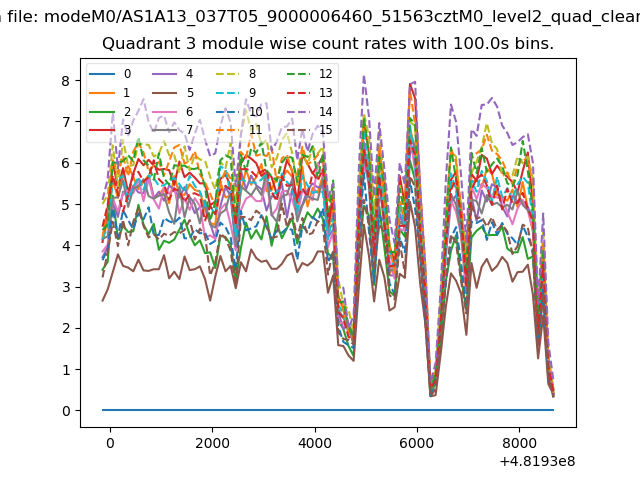
| Module-wise count rates for Quadrant A Data is divided into 100 sec bins |
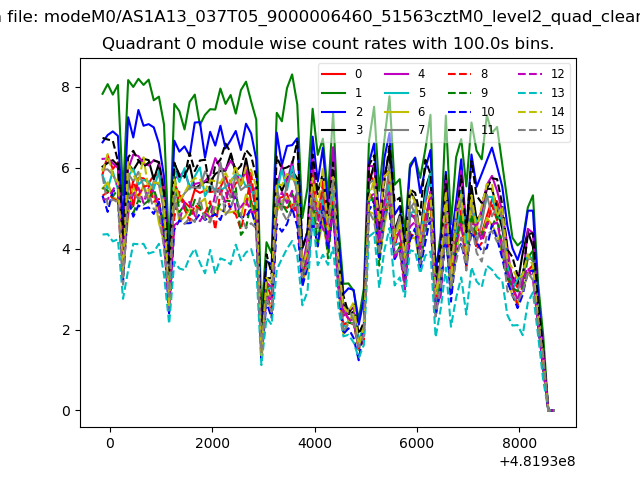 |
 |
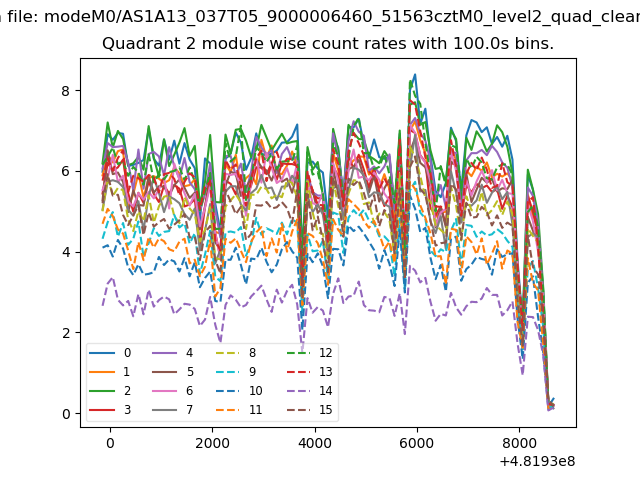
| Module-wise count rates for Quadrant B Data is divided into 100 sec bins |
 |
 |
| Module-wise count rates for Quadrant C Data is divided into 100 sec bins |
 |
 |
| Module-wise count rates for Quadrant D Data is divided into 100 sec bins |
 |
 |
| Parameter | Plot |
|---|---|
| CZT HV Monitor | 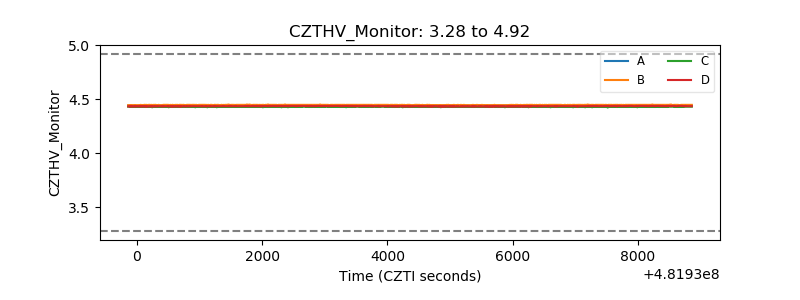 |
| D_VDD | 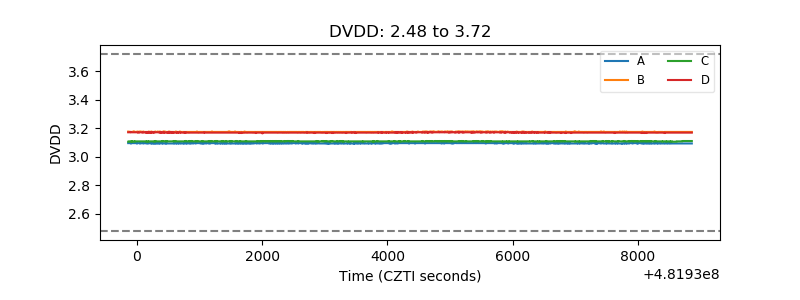 |
| Temperature 1 | 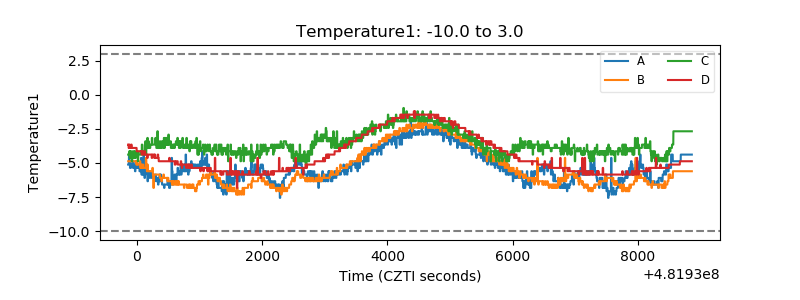 |
| Veto HV Monitor | 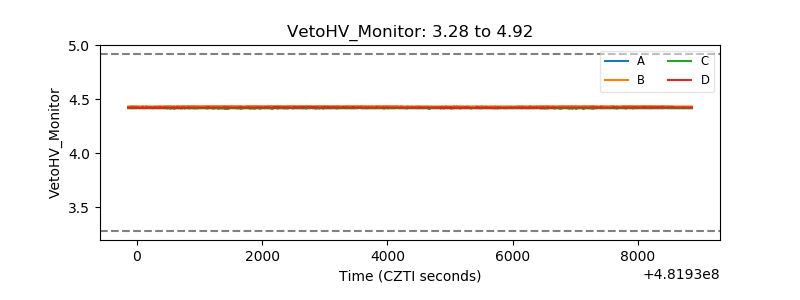 |
| Veto LLD | 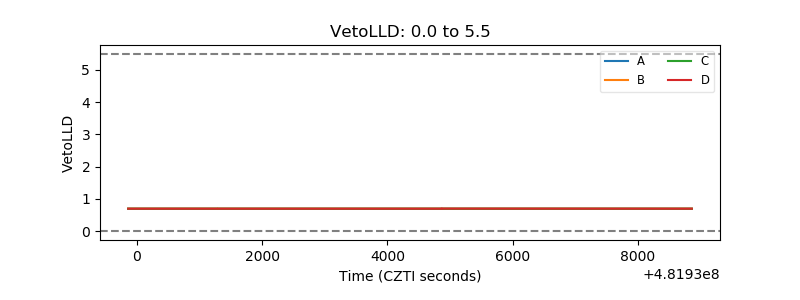 |
| Alpha Counter | 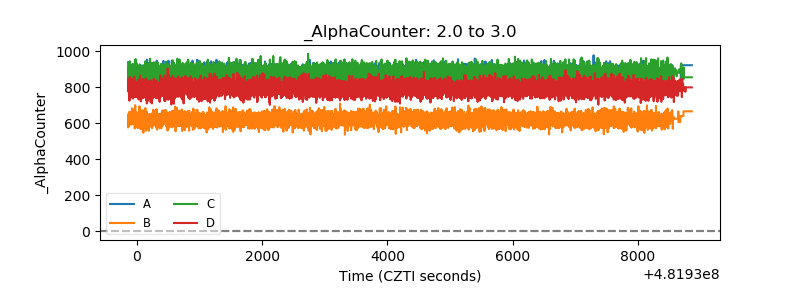 |
| _CPM_Rate | 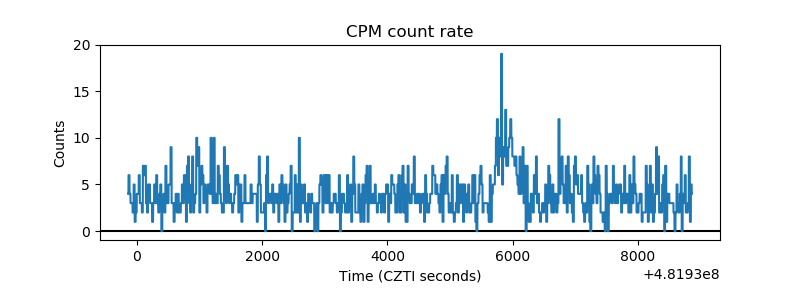 |
| CZT Counter | 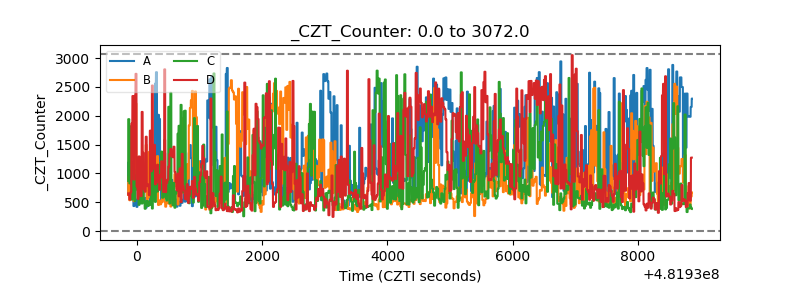 |
| +2.5 Volts monitor | 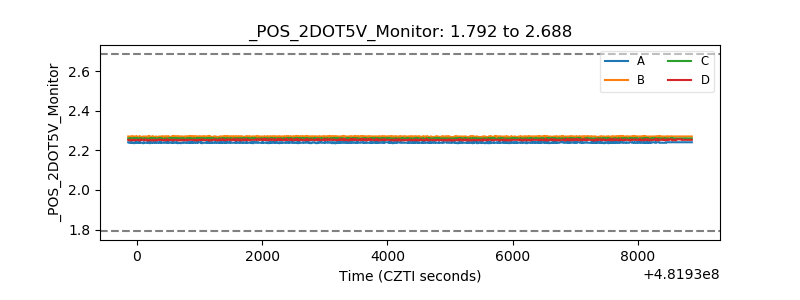 |
| +5 Volts monitor | 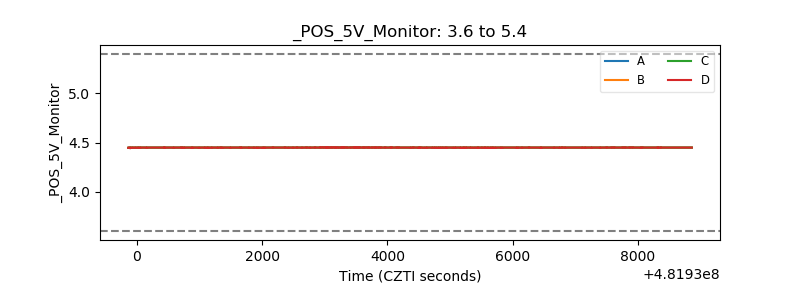 |
| _ROLL_ROT | 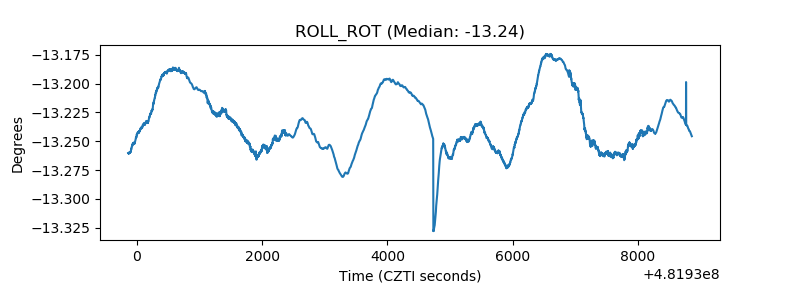 |
| _Roll_DEC | 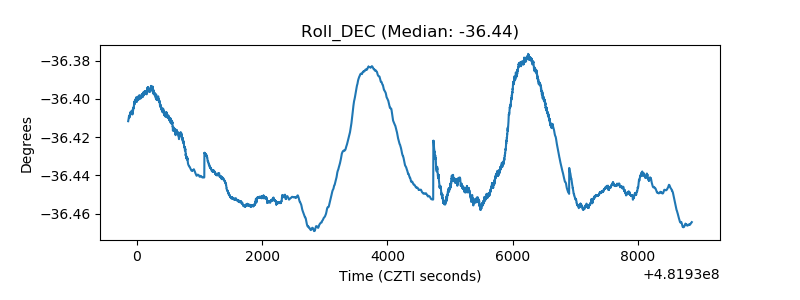 |
| _Roll_RA | 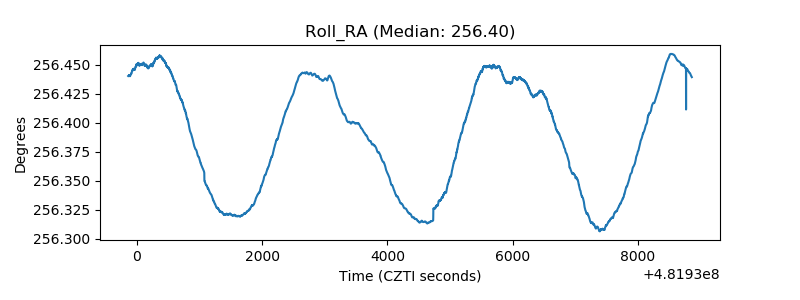 |
| Veto Counter | 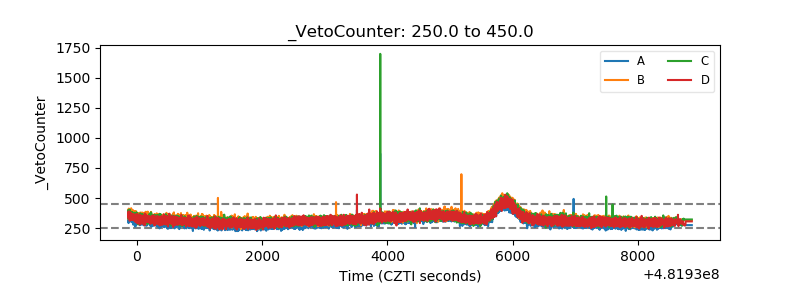 |