| Param | Original file | Final file |
|---|---|---|
| Filename | modeM0/AS1A13_037T05_9000006460_51565cztM0_level2.fits | modeM0/AS1A13_037T05_9000006460_51565cztM0_level2_quad_clean.evt |
| Size (bytes) | 1,625,040,000 | 257,555,520 |
| Size | 1.5 GB | 245.6 MB |
| Events in quadrant A | 20,191,738 | 1,575,564 |
| Events in quadrant B | 12,272,983 | 1,850,992 |
| Events in quadrant C | 11,663,903 | 1,633,247 |
| Events in quadrant D | 14,581,392 | 1,448,131 |
| Mode M9 | |||
|---|---|---|---|
| Quadrant | BADHDUFLAG | Total packets | Discarded packets |
| A | 0 | 30 | 0 |
| B | 0 | 30 | 0 |
| C | 0 | 30 | 0 |
| D | 0 | 30 | 0 |
| Mode M0 | |||
|---|---|---|---|
| Quadrant | BADHDUFLAG | Total packets | Discarded packets |
| A | 0 | 72981 | 4 |
| B | 0 | 48960 | 4 |
| C | 0 | 47745 | 4 |
| D | 0 | 56258 | 4 |
| Mode SS | |||
|---|---|---|---|
| Quadrant | BADHDUFLAG | Total packets | Discarded packets |
| A | 0 | 382 | 0 |
| B | 0 | 382 | 0 |
| C | 0 | 382 | 0 |
| D | 0 | 382 | 0 |
| Quadrant | Total seconds | Saturated seconds | Saturation percentage |
|---|---|---|---|
| A | 18714 | 2262 | 12.087207% |
| B | 18715 | 703 | 3.756345% |
| C | 18715 | 836 | 4.467005% |
| D | 18715 | 1622 | 8.666845% |
Noise dominated data is calculated using 1-second bins in cleaned event files. If a bin has >2000 counts, and if more than 50% of those come from <1% of pixels, then it is considered to be noise-dominated and hence unusable.
| Quadrant | # 1 sec bins | Bins with >0 counts | Bins with >2000 counts | High rate bins dominated by noise | Noise dominated (total time) | Noise dominated (detector-on time) | Marked lightcurve |
|---|---|---|---|---|---|---|---|
| A | 21669 | 18717 | 1537 | 1537 | 7.09% | 8.21% | 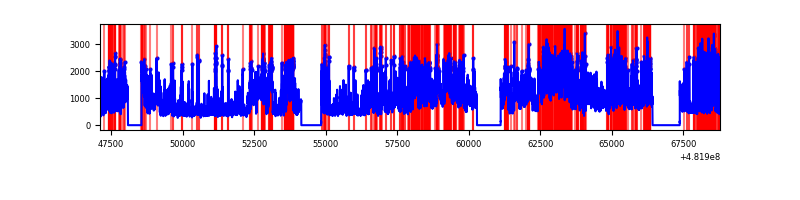 |
| B | 21669 | 18717 | 294 | 294 | 1.36% | 1.57% | 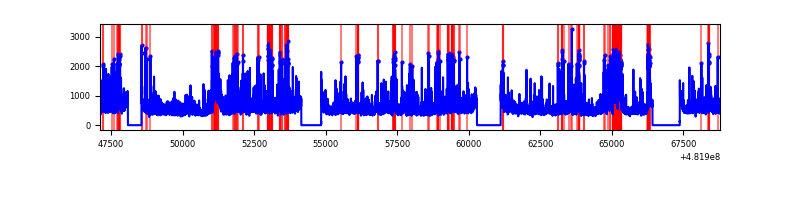 |
| C | 21669 | 18717 | 662 | 662 | 3.06% | 3.54% |  |
| D | 21669 | 18717 | 1354 | 1354 | 6.25% | 7.23% | 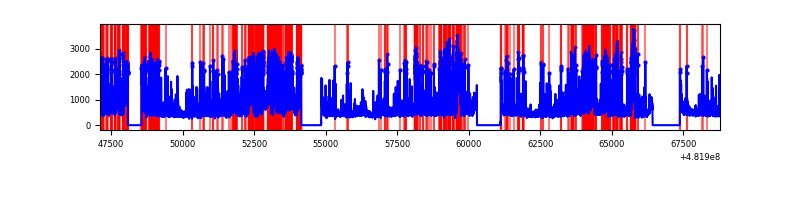 |
Top three noisy pixels from each quadrant. If the there are fewer than three noisy pixels in the level2.evt file, extra rows are filled as -1
| Pixel properties | Quadrant properties | ||||||
|---|---|---|---|---|---|---|---|
| Quadrant | DetID | PixID | Counts | Sigma | Mean | Median | Sigma |
| A | 12 | 3 | 5770275 | 11907.16 | 1964 | 1915 | 484.4 |
| A | 7 | 64 | 2018992 | 4163.69 | 1964 | 1915 | 484.4 |
| A | 12 | 250 | 1612427 | 3324.45 | 1964 | 1915 | 484.4 |
| B | 4 | 81 | 1101971 | 2573.79 | 2009 | 1937 | 427.4 |
| B | 10 | 44 | 490150 | 1142.29 | 2009 | 1937 | 427.4 |
| B | 10 | 254 | 430088 | 1001.76 | 2009 | 1937 | 427.4 |
| C | 0 | 177 | 1502424 | 2753.9 | 1985 | 1961 | 544.8 |
| C | 13 | 3 | 981861 | 1798.48 | 1985 | 1961 | 544.8 |
| C | 15 | 147 | 579266 | 1059.57 | 1985 | 1961 | 544.8 |
| D | 8 | 176 | 2092654 | 3905.04 | 1914 | 1845 | 535.4 |
| D | 3 | 12 | 1761128 | 3285.85 | 1914 | 1845 | 535.4 |
| D | 12 | 6 | 1595414 | 2976.34 | 1914 | 1845 | 535.4 |
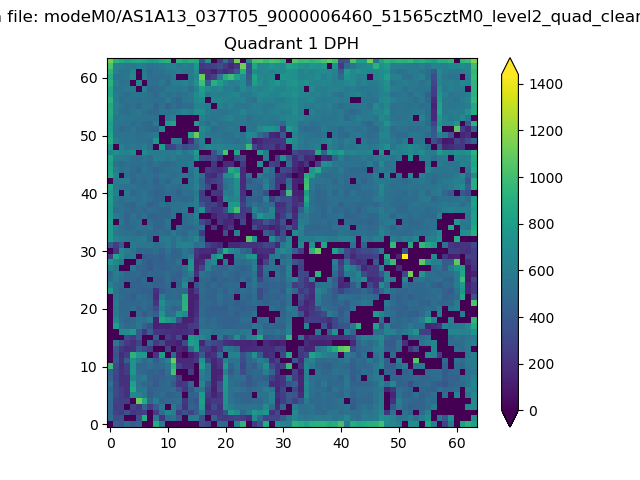
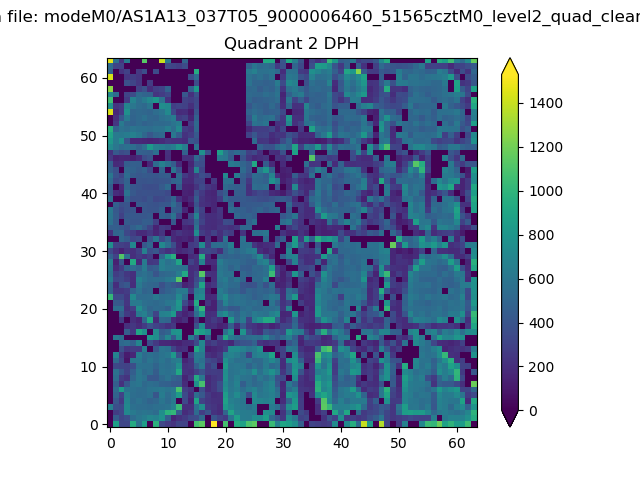
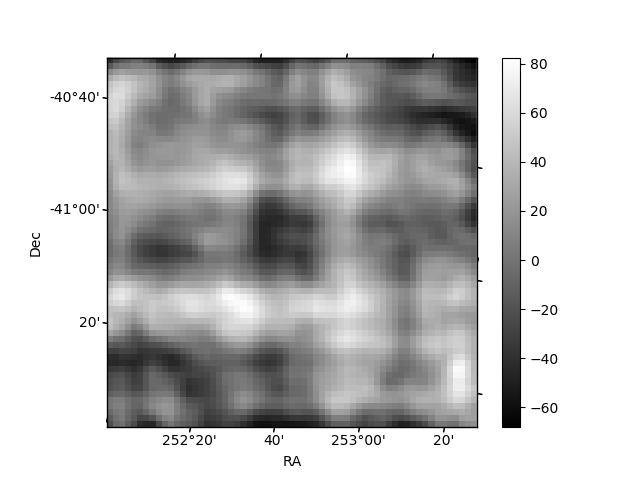
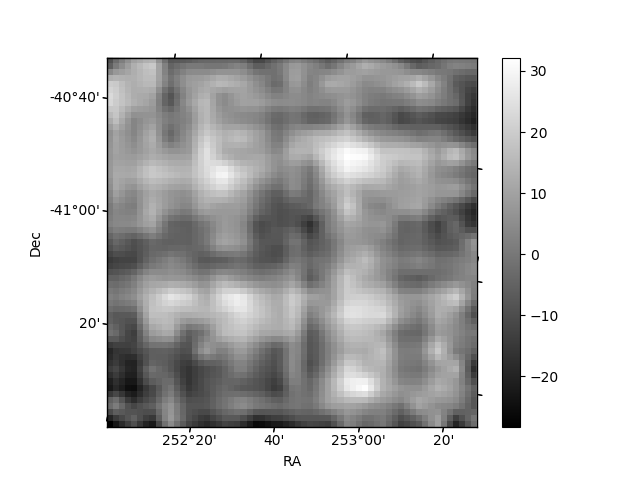
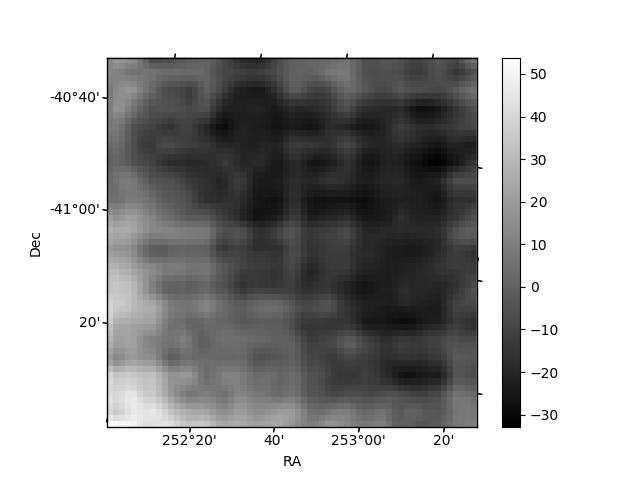
Histogram calculated using DETX and DETY for each event in the final _common_clean file
| Quadrant A | 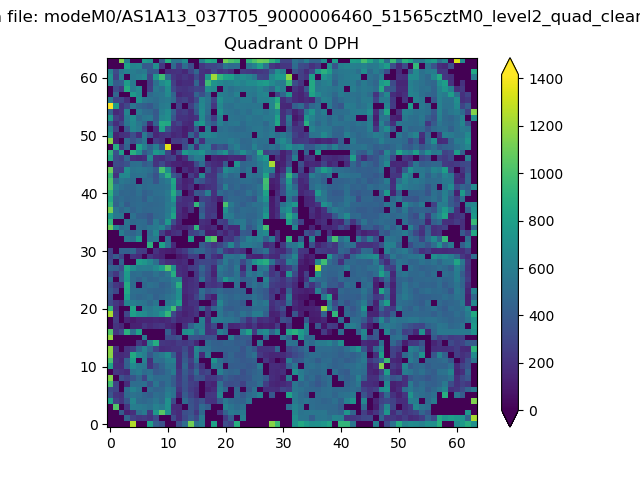 |
 |
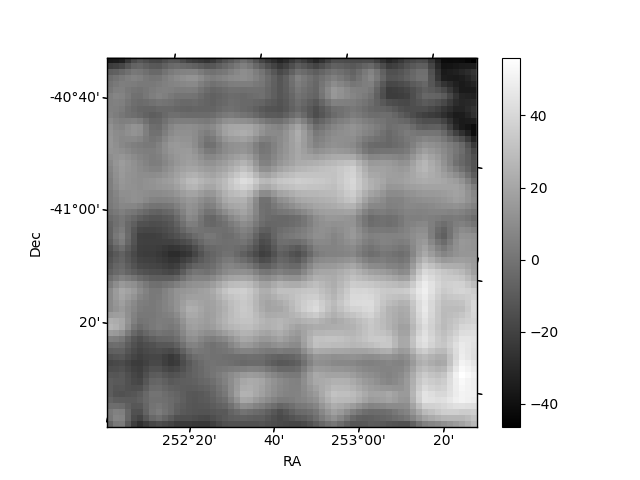
Quadrant B |
|---|---|---|---|
| Quadrant D | 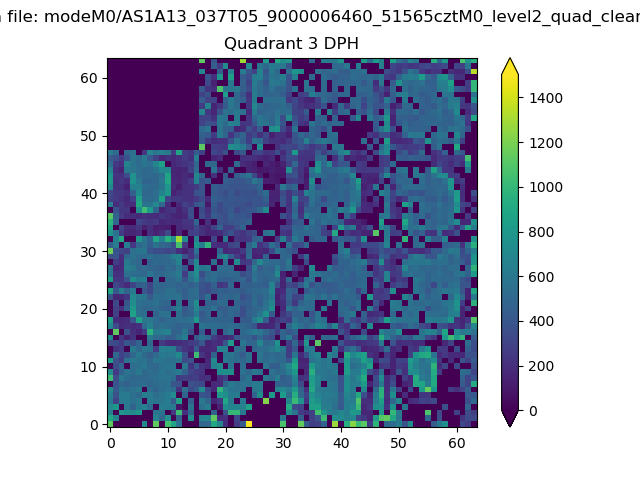 |
 |
Quadrant C |
| Plot type | Count rate plots | Images |
|---|---|---|
| Comparison with Poisson distribution Blue bars denote a histogram of data divided into 1 sec bins. Red curve is a Poisson curve with rate = median count rate of data. |
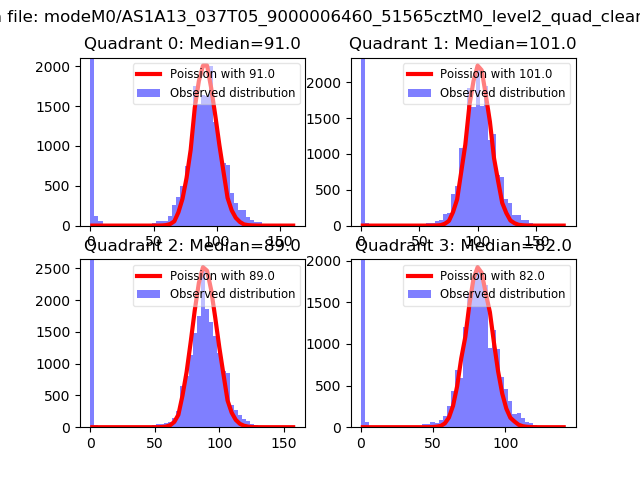 |
 |
| Quadrant-wise count rates Data is divided into 100 sec bins |
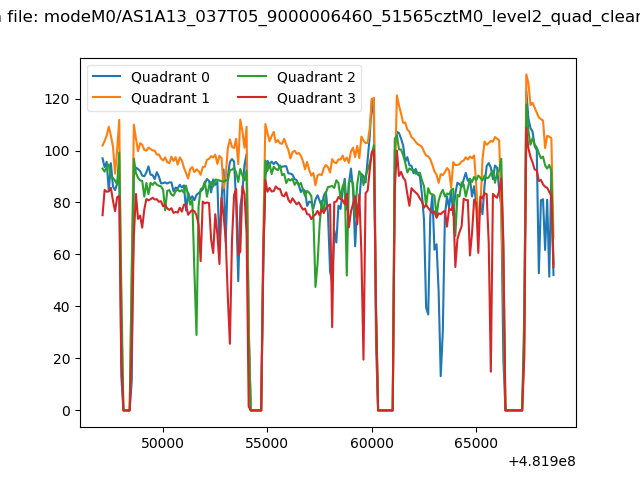 |
|
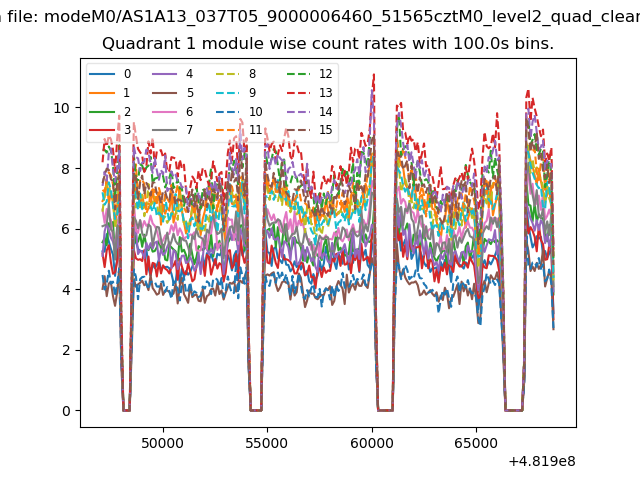
| Module-wise count rates for Quadrant A Data is divided into 100 sec bins |
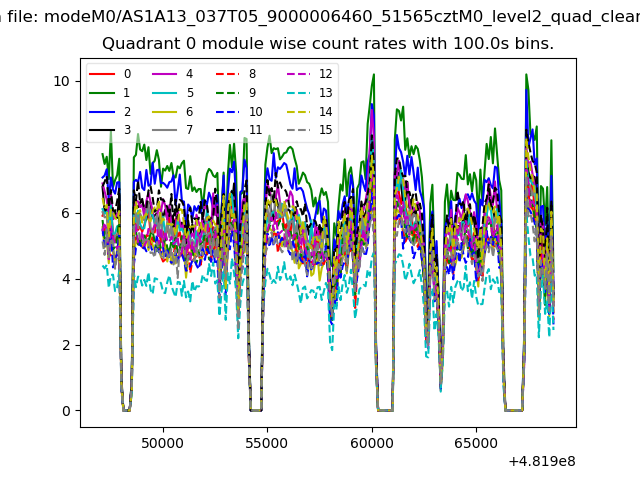 |
 |
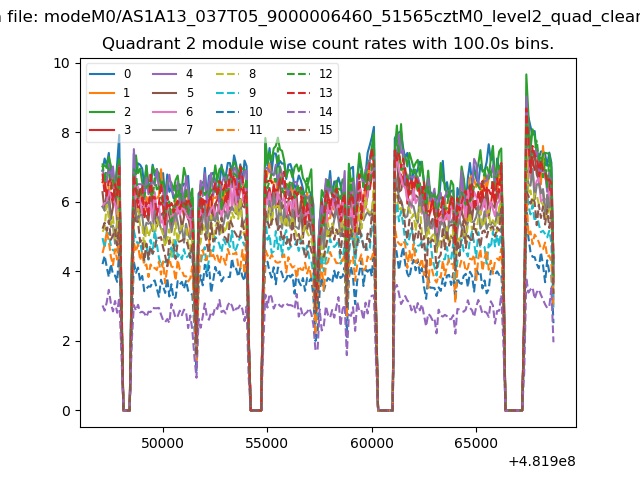
| Module-wise count rates for Quadrant B Data is divided into 100 sec bins |
 |
 |
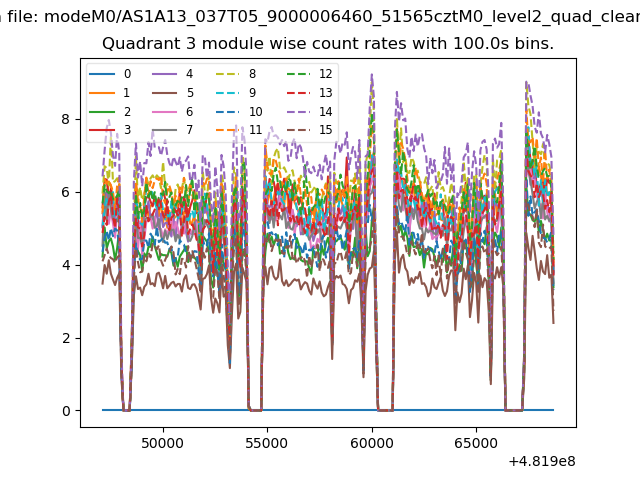
| Module-wise count rates for Quadrant C Data is divided into 100 sec bins |
 |
 |
| Module-wise count rates for Quadrant D Data is divided into 100 sec bins |
 |
 |
| Parameter | Plot |
|---|---|
| CZT HV Monitor | 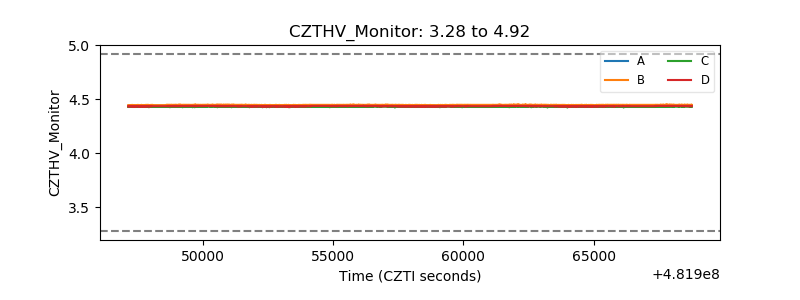 |
| D_VDD | 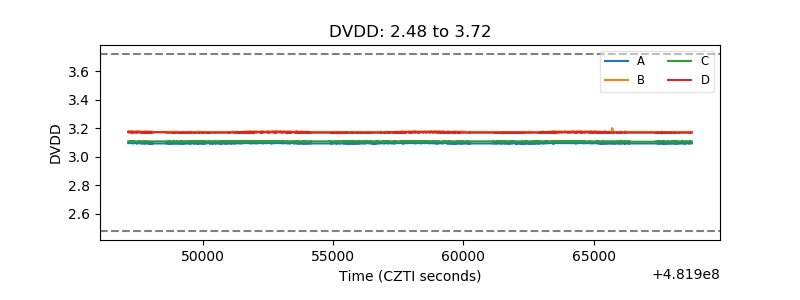 |
| Temperature 1 | 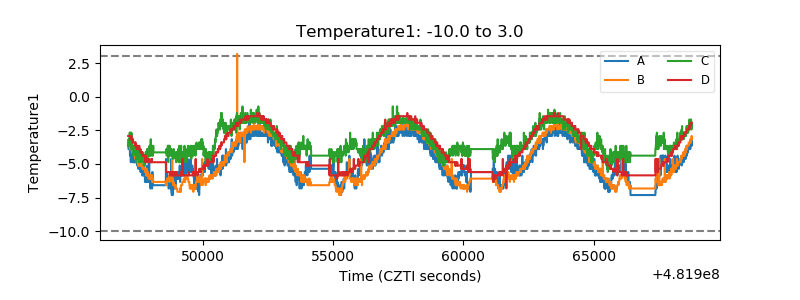 |
| Veto HV Monitor | 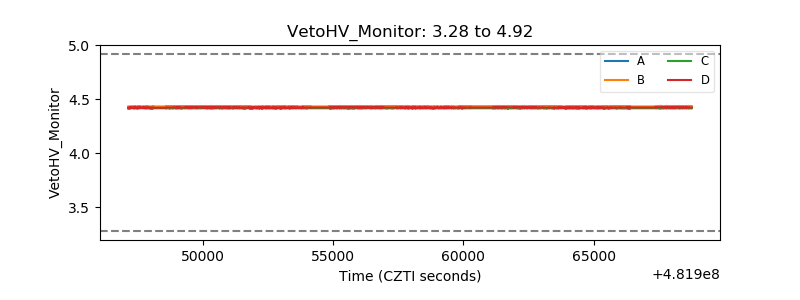 |
| Veto LLD | 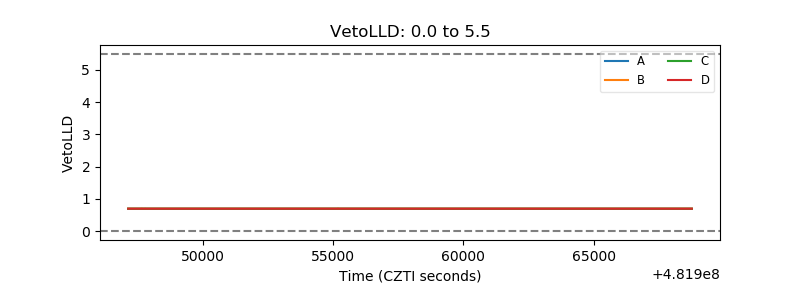 |
| Alpha Counter | 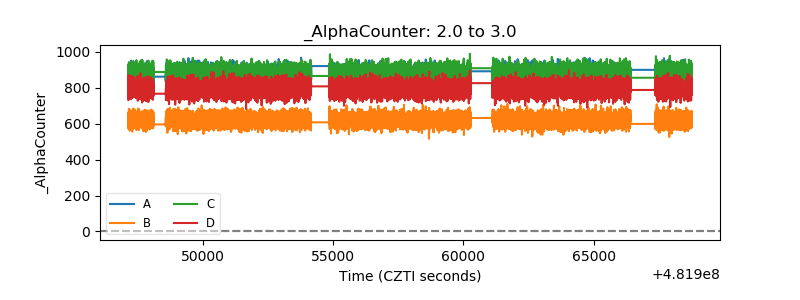 |
| _CPM_Rate | 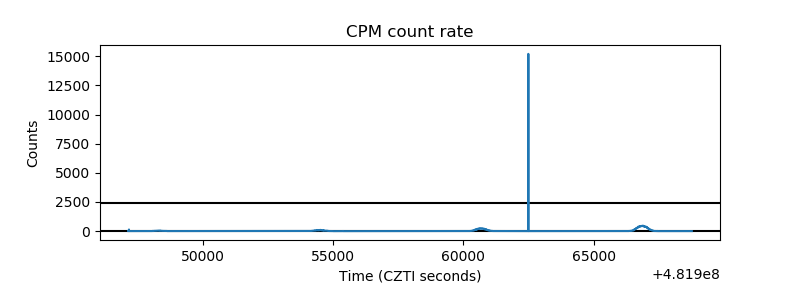 |
| CZT Counter | 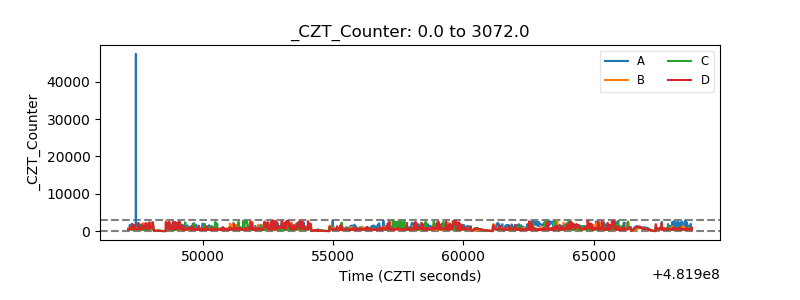 |
| +2.5 Volts monitor | 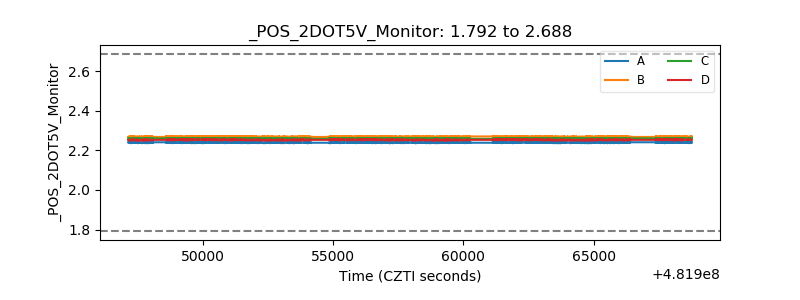 |
| +5 Volts monitor | 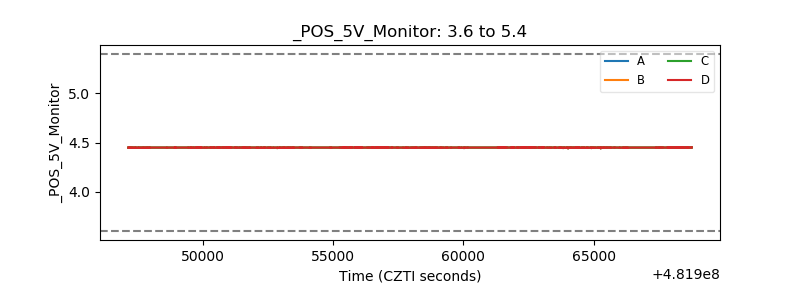 |
| _ROLL_ROT | 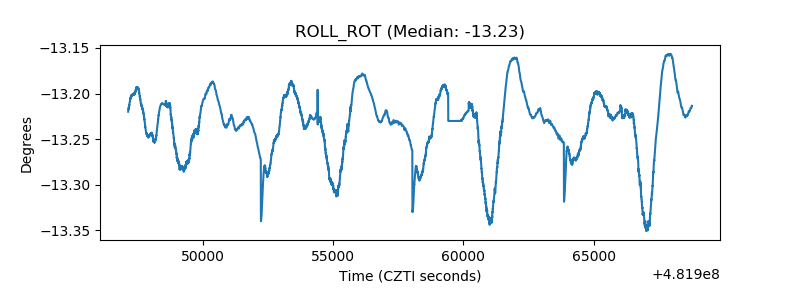 |
| _Roll_DEC | 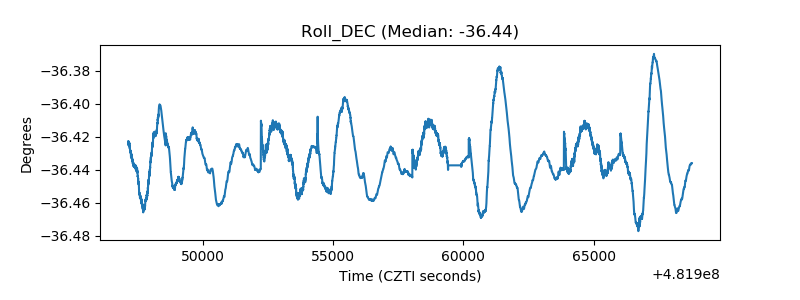 |
| _Roll_RA | 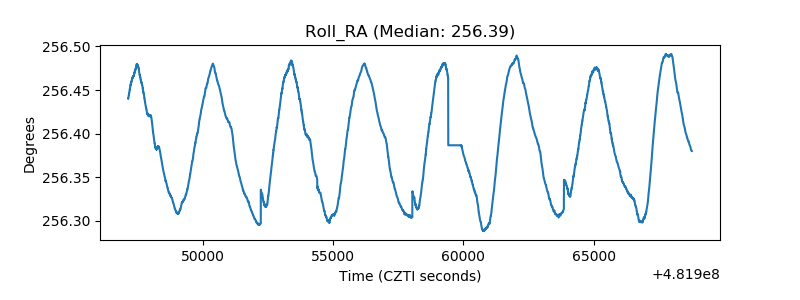 |
| Veto Counter | 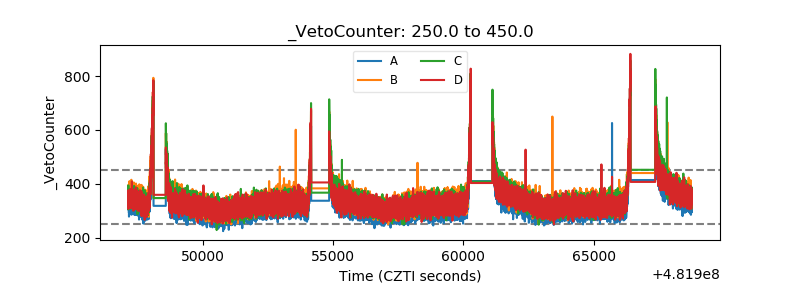 |