| Param | Original file | Final file |
|---|---|---|
| Filename | modeM0/AS1A13_037T05_9000006460_51566cztM0_level2.fits | modeM0/AS1A13_037T05_9000006460_51566cztM0_level2_quad_clean.evt |
| Size (bytes) | 587,315,520 | 94,000,320 |
| Size | 560.1 MB | 89.6 MB |
| Events in quadrant A | 8,959,005 | 525,830 |
| Events in quadrant B | 4,401,759 | 677,591 |
| Events in quadrant C | 3,385,783 | 620,492 |
| Events in quadrant D | 4,485,322 | 564,446 |
| Mode M9 | |||
|---|---|---|---|
| Quadrant | BADHDUFLAG | Total packets | Discarded packets |
| A | 0 | 10 | 0 |
| B | 0 | 10 | 0 |
| C | 0 | 10 | 0 |
| D | 0 | 10 | 0 |
| Mode M0 | |||
|---|---|---|---|
| Quadrant | BADHDUFLAG | Total packets | Discarded packets |
| A | 0 | 31147 | 1 |
| B | 0 | 17357 | 1 |
| C | 0 | 14590 | 3 |
| D | 0 | 17828 | 1 |
| Mode SS | |||
|---|---|---|---|
| Quadrant | BADHDUFLAG | Total packets | Discarded packets |
| A | 0 | 134 | 0 |
| B | 0 | 134 | 0 |
| C | 0 | 134 | 0 |
| D | 0 | 134 | 0 |
| Quadrant | Total seconds | Saturated seconds | Saturation percentage |
|---|---|---|---|
| A | 6564 | 1456 | 22.181597% |
| B | 6565 | 325 | 4.950495% |
| C | 6564 | 107 | 1.630104% |
| D | 6564 | 291 | 4.433272% |
Noise dominated data is calculated using 1-second bins in cleaned event files. If a bin has >2000 counts, and if more than 50% of those come from <1% of pixels, then it is considered to be noise-dominated and hence unusable.
| Quadrant | # 1 sec bins | Bins with >0 counts | Bins with >2000 counts | High rate bins dominated by noise | Noise dominated (total time) | Noise dominated (detector-on time) | Marked lightcurve |
|---|---|---|---|---|---|---|---|
| A | 7604 | 6565 | 1262 | 1262 | 16.60% | 19.22% |  |
| B | 7605 | 6566 | 181 | 181 | 2.38% | 2.76% |  |
| C | 7604 | 6565 | 39 | 39 | 0.51% | 0.59% | 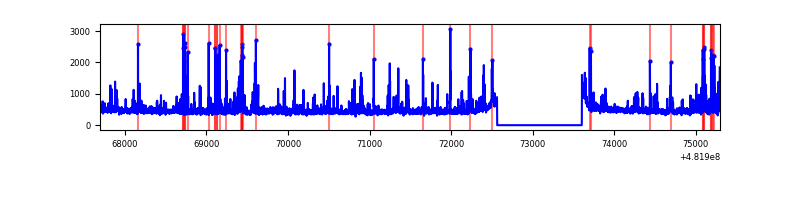 |
| D | 7604 | 6565 | 221 | 221 | 2.91% | 3.37% | 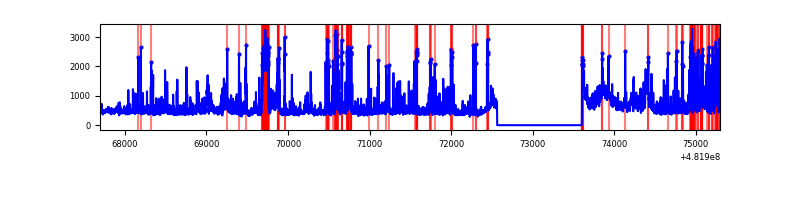 |
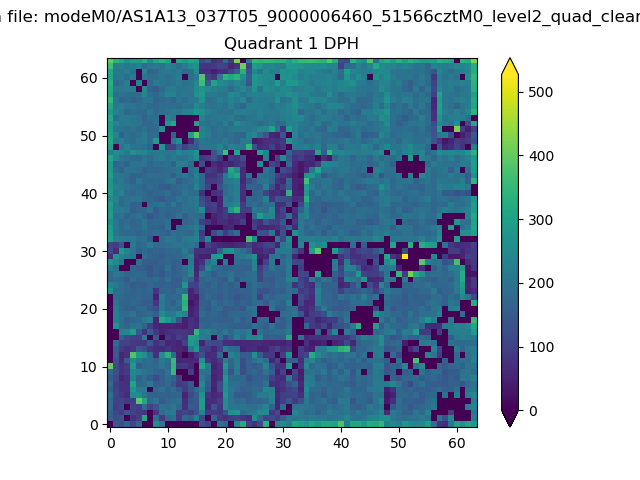
Top three noisy pixels from each quadrant. If the there are fewer than three noisy pixels in the level2.evt file, extra rows are filled as -1
| Pixel properties | Quadrant properties | ||||||
|---|---|---|---|---|---|---|---|
| Quadrant | DetID | PixID | Counts | Sigma | Mean | Median | Sigma |
| A | 12 | 3 | 2619879 | 16058.37 | 670 | 656 | 163.1 |
| A | 7 | 64 | 1824010 | 11178.92 | 670 | 656 | 163.1 |
| A | 12 | 250 | 749398 | 4590.51 | 670 | 656 | 163.1 |
| B | 10 | 44 | 661776 | 4379.78 | 710 | 688 | 150.9 |
| B | 0 | 171 | 164283 | 1083.83 | 710 | 688 | 150.9 |
| B | 4 | 81 | 145039 | 956.34 | 710 | 688 | 150.9 |
| C | 13 | 3 | 224307 | 1144.41 | 713 | 707 | 195.4 |
| C | 0 | 177 | 134138 | 682.91 | 713 | 707 | 195.4 |
| C | 14 | 245 | 91653 | 465.47 | 713 | 707 | 195.4 |
| D | 8 | 176 | 751887 | 3869.3 | 700 | 675 | 194.1 |
| D | 0 | 113 | 318357 | 1636.3 | 700 | 675 | 194.1 |
| D | 2 | 249 | 159802 | 819.62 | 700 | 675 | 194.1 |
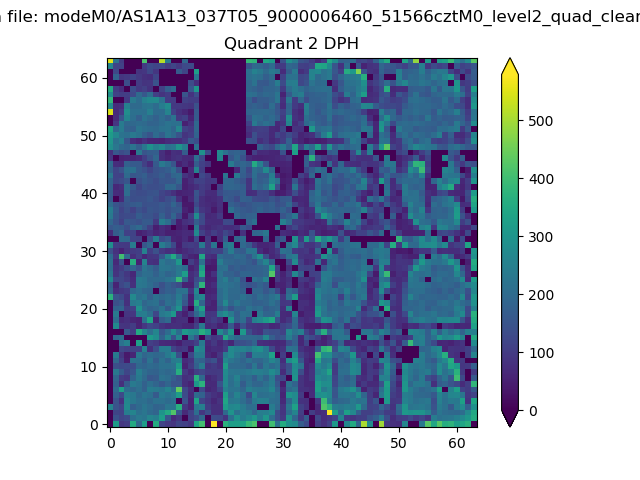
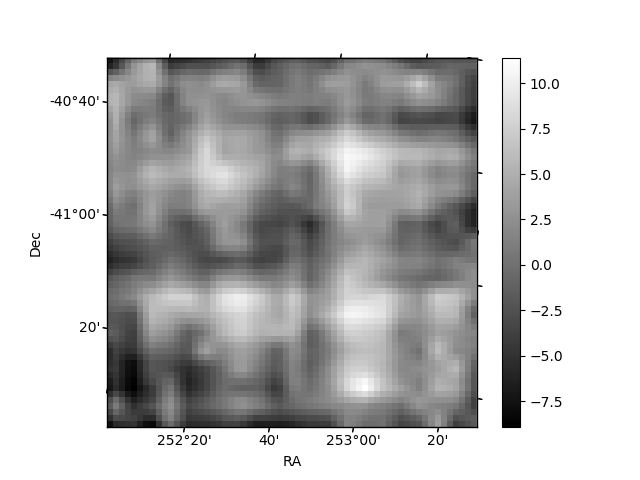
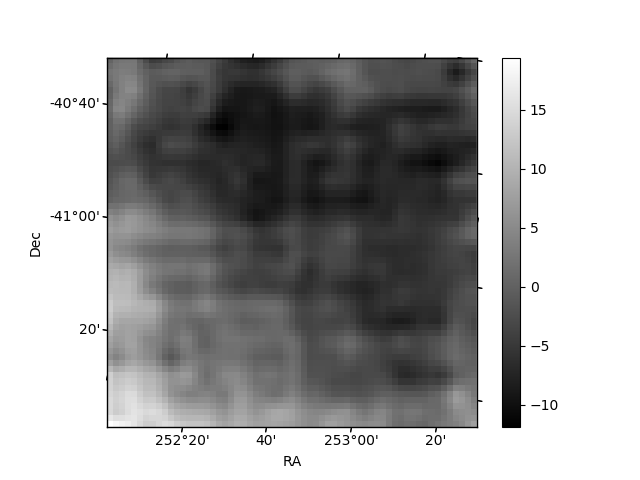
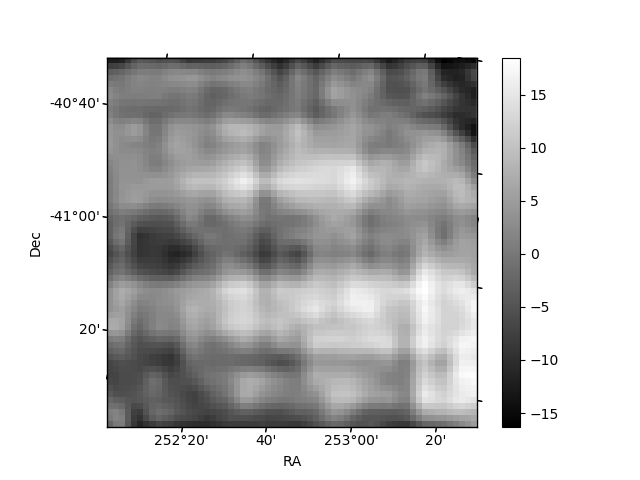
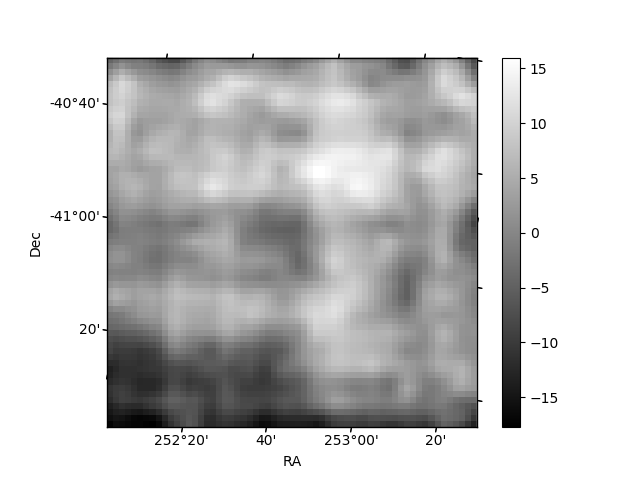
Histogram calculated using DETX and DETY for each event in the final _common_clean file
| Quadrant A | 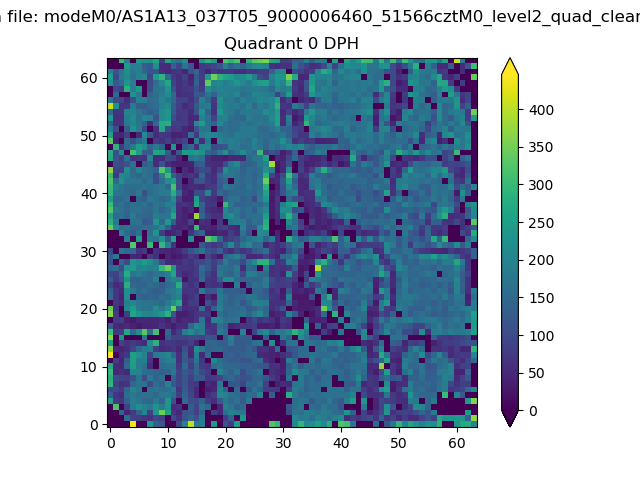 |
 |
Quadrant B |
|---|---|---|---|
| Quadrant D | 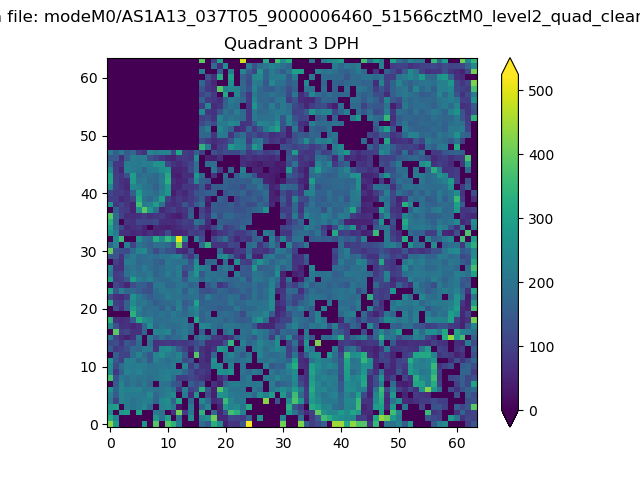 |
 |
Quadrant C |
| Plot type | Count rate plots | Images |
|---|---|---|
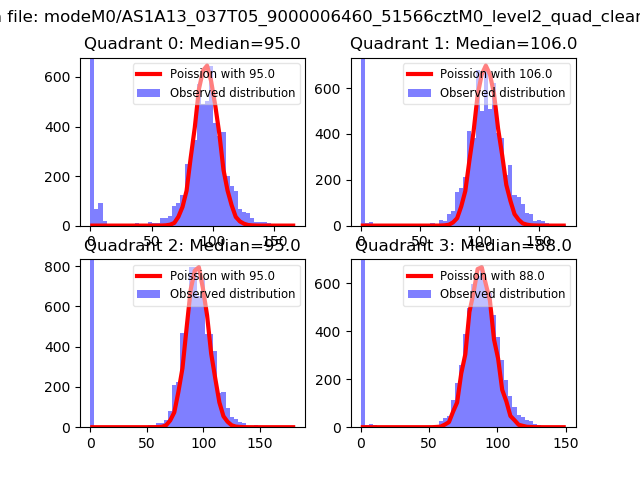
| Comparison with Poisson distribution Blue bars denote a histogram of data divided into 1 sec bins. Red curve is a Poisson curve with rate = median count rate of data. |
 |
 |
| Quadrant-wise count rates Data is divided into 100 sec bins |
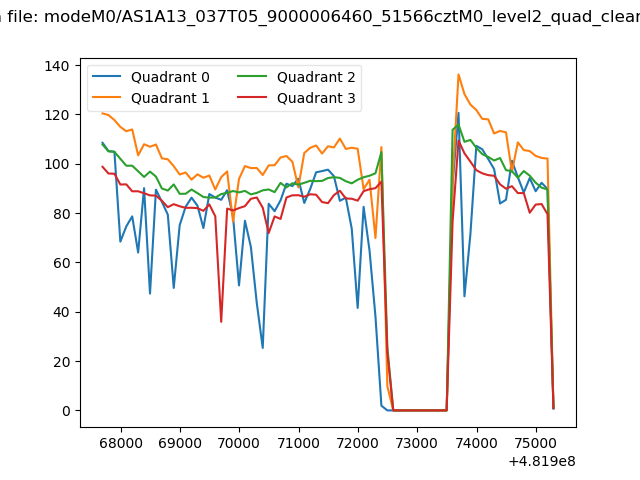 |
|
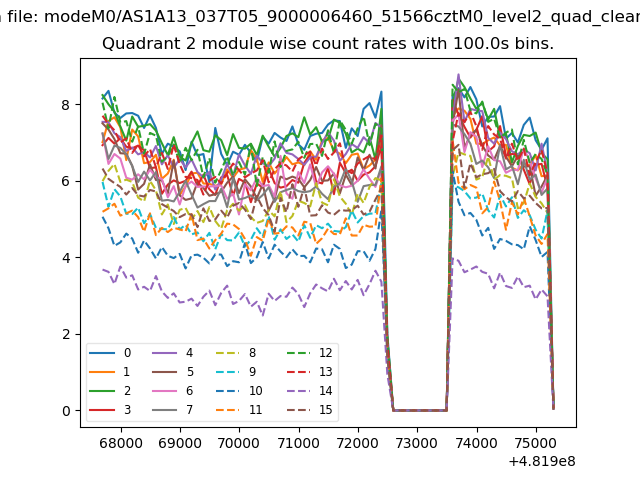
| Module-wise count rates for Quadrant A Data is divided into 100 sec bins |
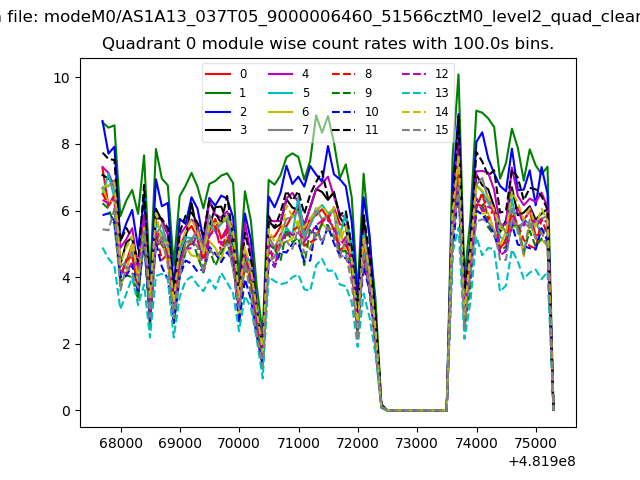 |
 |
| Module-wise count rates for Quadrant B Data is divided into 100 sec bins |
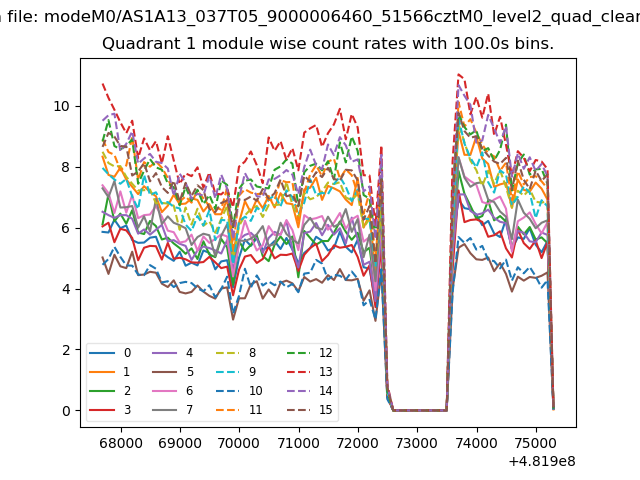 |
 |
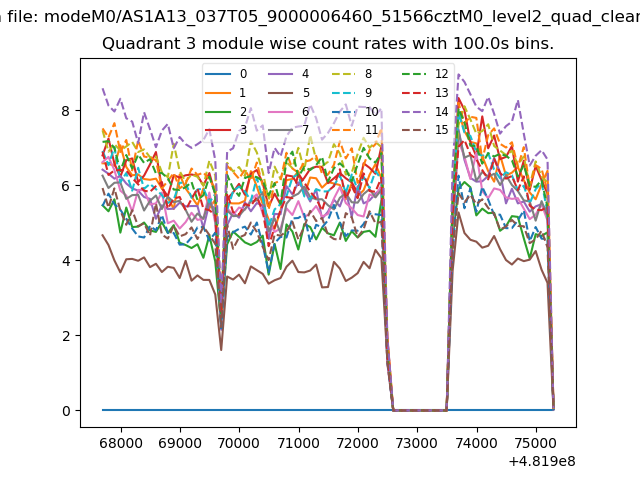
| Module-wise count rates for Quadrant C Data is divided into 100 sec bins |
 |
 |
| Module-wise count rates for Quadrant D Data is divided into 100 sec bins |
 |
 |
| Parameter | Plot |
|---|---|
| CZT HV Monitor | 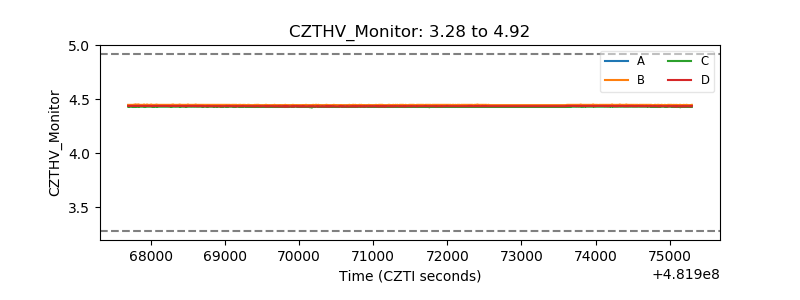 |
| D_VDD | 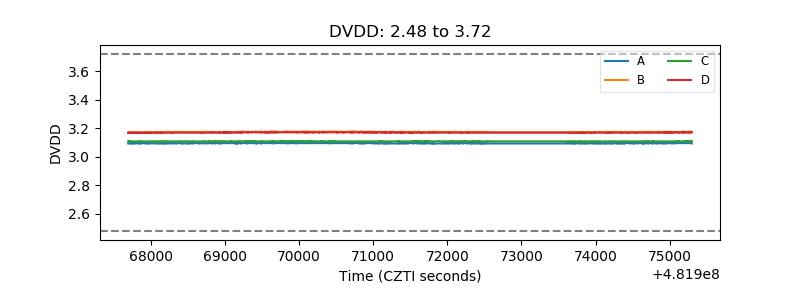 |
| Temperature 1 | 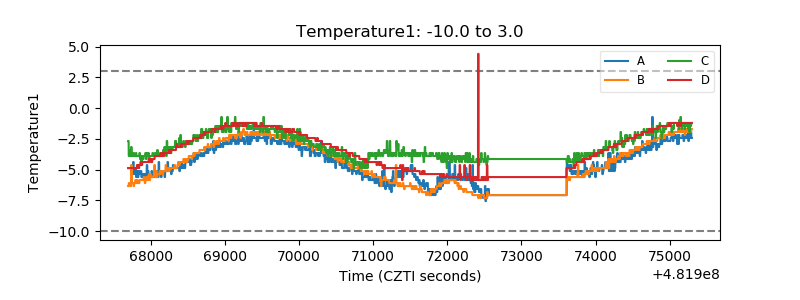 |
| Veto HV Monitor |  |
| Veto LLD | 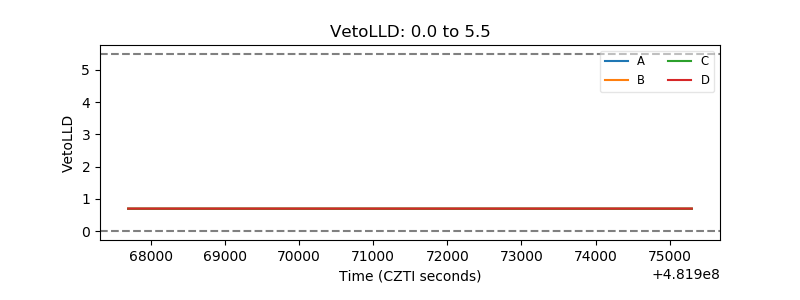 |
| Alpha Counter | 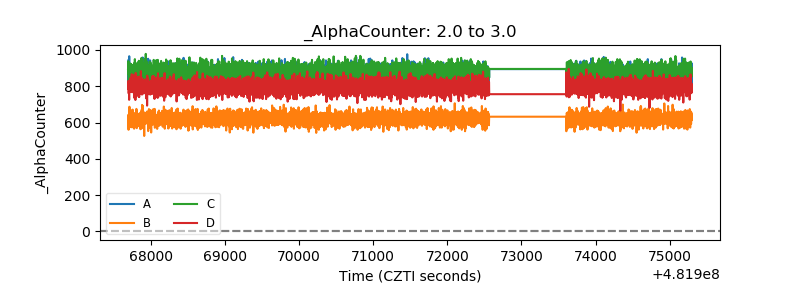 |
| _CPM_Rate | 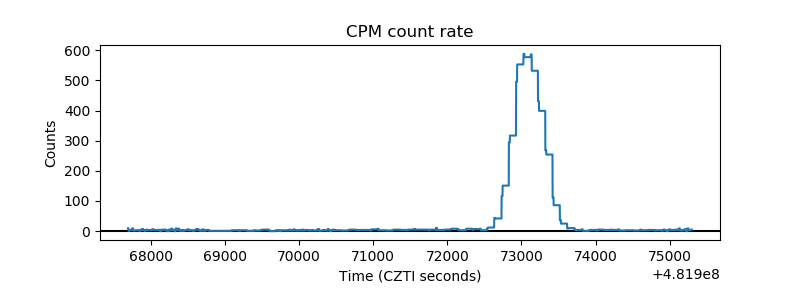 |
| CZT Counter | 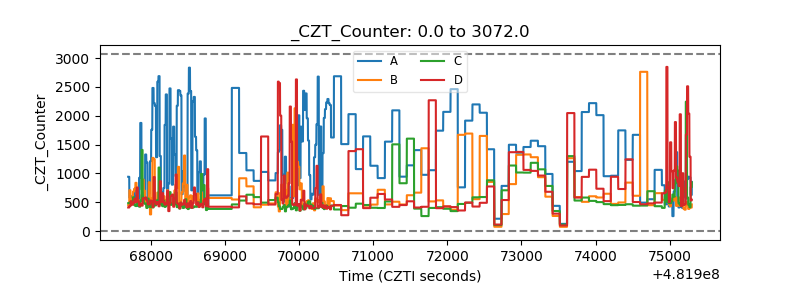 |
| +2.5 Volts monitor | 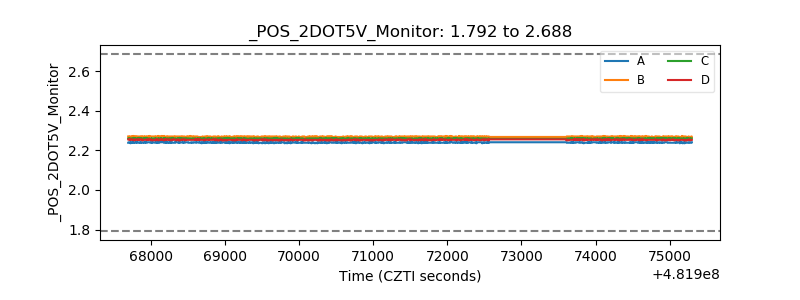 |
| +5 Volts monitor | 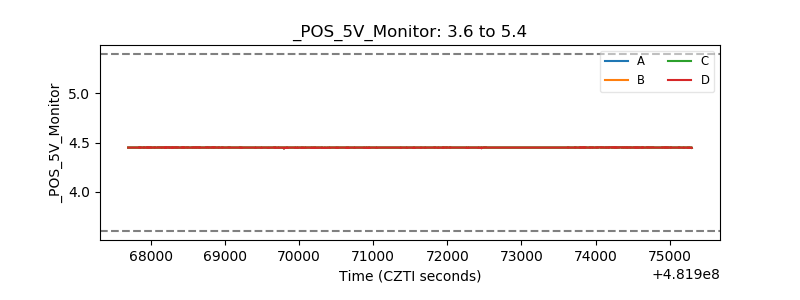 |
| _ROLL_ROT | 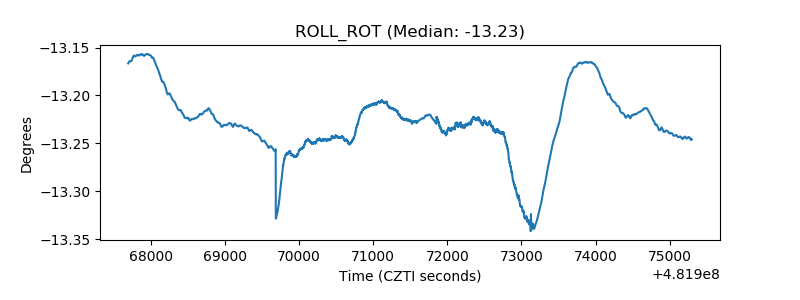 |
| _Roll_DEC | 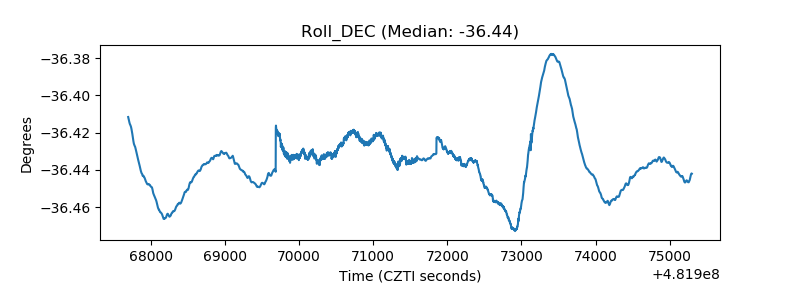 |
| _Roll_RA | 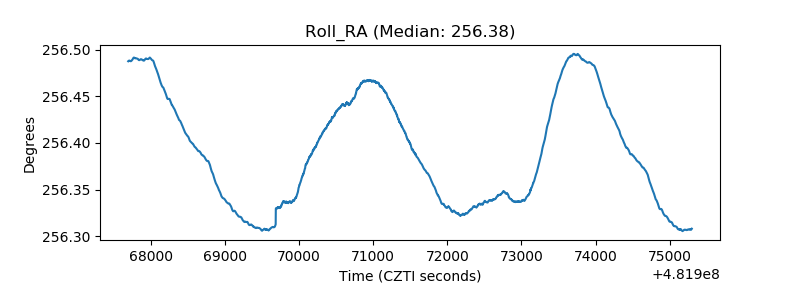 |
| Veto Counter | 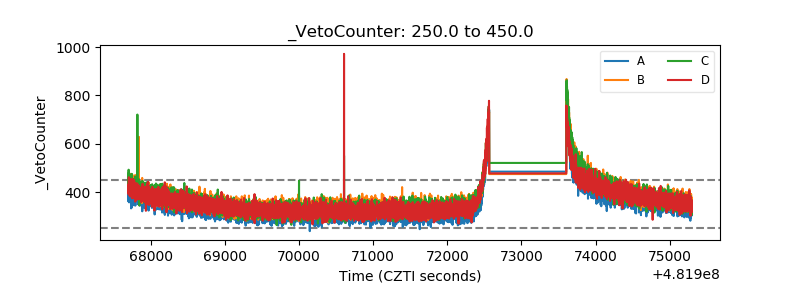 |