| Param | Original file | Final file |
|---|---|---|
| Filename | modeM0/AS1A13_037T05_9000006460_51567cztM0_level2.fits | modeM0/AS1A13_037T05_9000006460_51567cztM0_level2_quad_clean.evt |
| Size (bytes) | 582,687,360 | 91,393,920 |
| Size | 555.7 MB | 87.2 MB |
| Events in quadrant A | 7,518,971 | 549,560 |
| Events in quadrant B | 5,086,348 | 639,051 |
| Events in quadrant C | 3,605,738 | 599,412 |
| Events in quadrant D | 4,869,136 | 539,351 |
| Mode M9 | |||
|---|---|---|---|
| Quadrant | BADHDUFLAG | Total packets | Discarded packets |
| A | 0 | 11 | 0 |
| B | 0 | 11 | 0 |
| C | 0 | 11 | 0 |
| D | 0 | 11 | 0 |
| Mode M0 | |||
|---|---|---|---|
| Quadrant | BADHDUFLAG | Total packets | Discarded packets |
| A | 0 | 26704 | 0 |
| B | 0 | 19337 | 0 |
| C | 0 | 15067 | 0 |
| D | 0 | 18814 | 0 |
| Mode SS | |||
|---|---|---|---|
| Quadrant | BADHDUFLAG | Total packets | Discarded packets |
| A | 0 | 126 | 0 |
| B | 0 | 126 | 0 |
| C | 0 | 126 | 0 |
| D | 0 | 126 | 0 |
| Quadrant | Total seconds | Saturated seconds | Saturation percentage |
|---|---|---|---|
| A | 6308 | 1030 | 16.328472% |
| B | 6309 | 609 | 9.652877% |
| C | 6309 | 215 | 3.407830% |
| D | 6309 | 466 | 7.386274% |
Noise dominated data is calculated using 1-second bins in cleaned event files. If a bin has >2000 counts, and if more than 50% of those come from <1% of pixels, then it is considered to be noise-dominated and hence unusable.
| Quadrant | # 1 sec bins | Bins with >0 counts | Bins with >2000 counts | High rate bins dominated by noise | Noise dominated (total time) | Noise dominated (detector-on time) | Marked lightcurve |
|---|---|---|---|---|---|---|---|
| A | 7363 | 6309 | 645 | 645 | 8.76% | 10.22% | 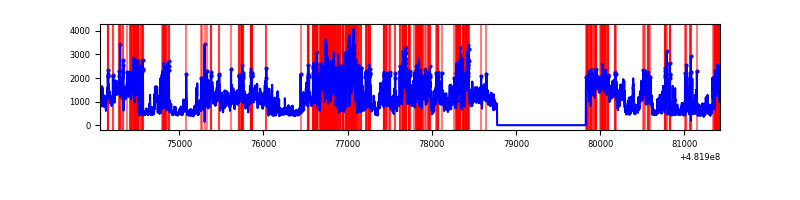 |
| B | 7364 | 6310 | 358 | 358 | 4.86% | 5.67% | 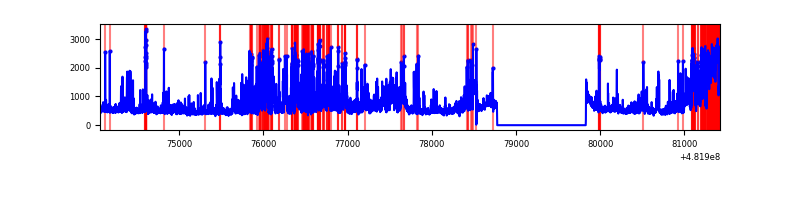 |
| C | 7364 | 6309 | 99 | 99 | 1.34% | 1.57% | 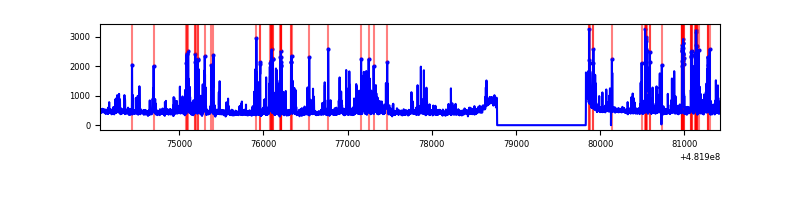 |
| D | 7364 | 6310 | 346 | 346 | 4.70% | 5.48% | 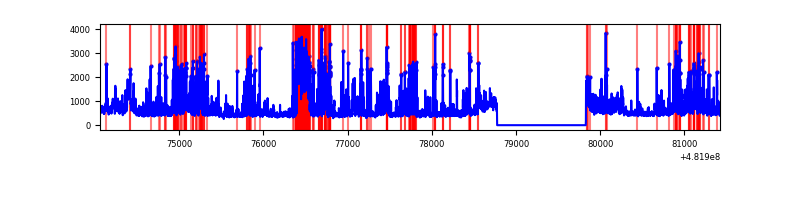 |
Top three noisy pixels from each quadrant. If the there are fewer than three noisy pixels in the level2.evt file, extra rows are filled as -1
| Pixel properties | Quadrant properties | ||||||
|---|---|---|---|---|---|---|---|
| Quadrant | DetID | PixID | Counts | Sigma | Mean | Median | Sigma |
| A | 12 | 3 | 2007471 | 12171.57 | 674 | 656 | 164.9 |
| A | 7 | 64 | 1074086 | 6510.48 | 674 | 656 | 164.9 |
| A | 12 | 250 | 798537 | 4839.24 | 674 | 656 | 164.9 |
| B | 10 | 44 | 1137038 | 7779.49 | 685 | 660 | 146.1 |
| B | 4 | 81 | 319278 | 2181.21 | 685 | 660 | 146.1 |
| B | 6 | 51 | 223170 | 1523.27 | 685 | 660 | 146.1 |
| C | 13 | 3 | 410418 | 2151.26 | 693 | 686 | 190.5 |
| C | 14 | 245 | 175939 | 920.15 | 693 | 686 | 190.5 |
| C | 0 | 177 | 120676 | 630.0 | 693 | 686 | 190.5 |
| D | 8 | 176 | 698488 | 3746.9 | 675 | 650 | 186.2 |
| D | 3 | 12 | 361096 | 1935.34 | 675 | 650 | 186.2 |
| D | 12 | 6 | 203152 | 1087.29 | 675 | 650 | 186.2 |
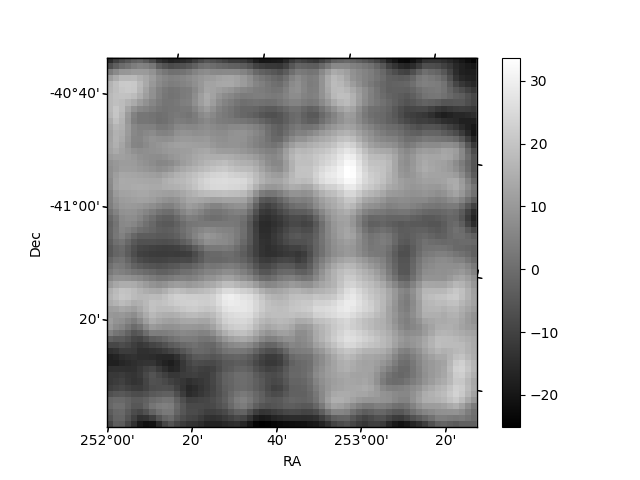
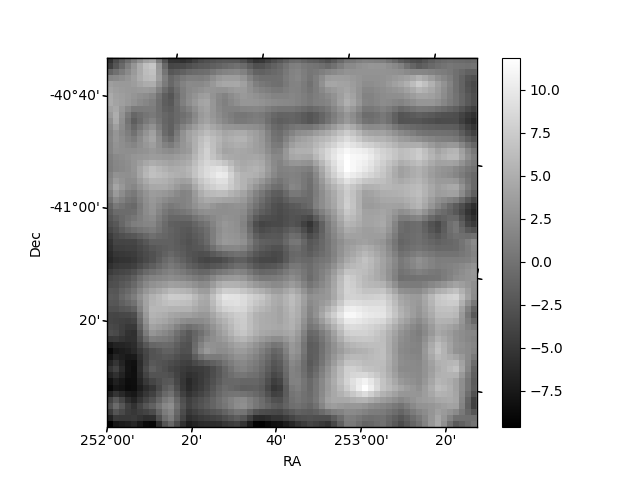
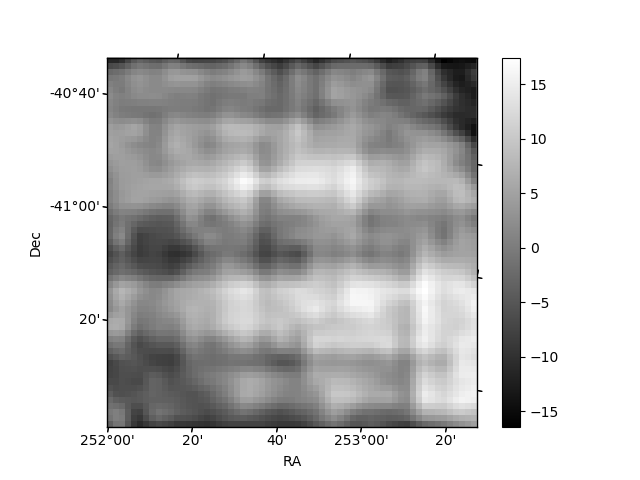
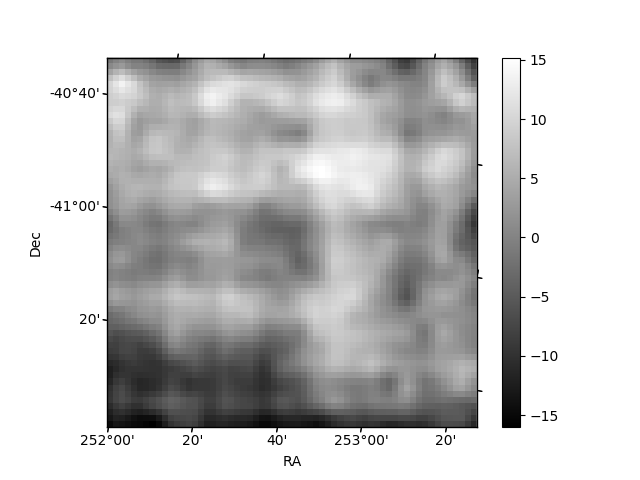
Histogram calculated using DETX and DETY for each event in the final _common_clean file
| Quadrant A | 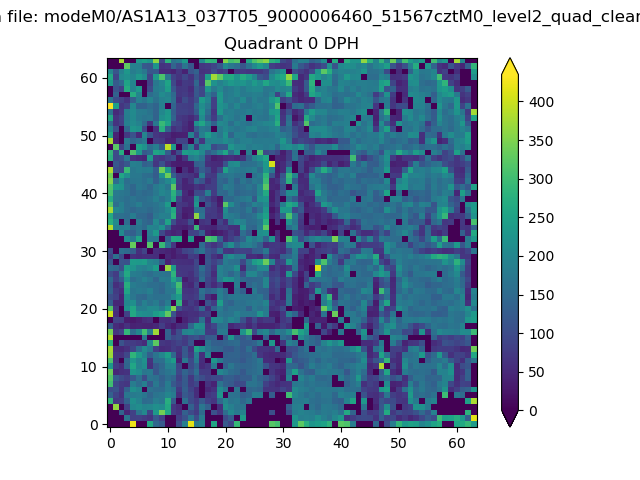 |
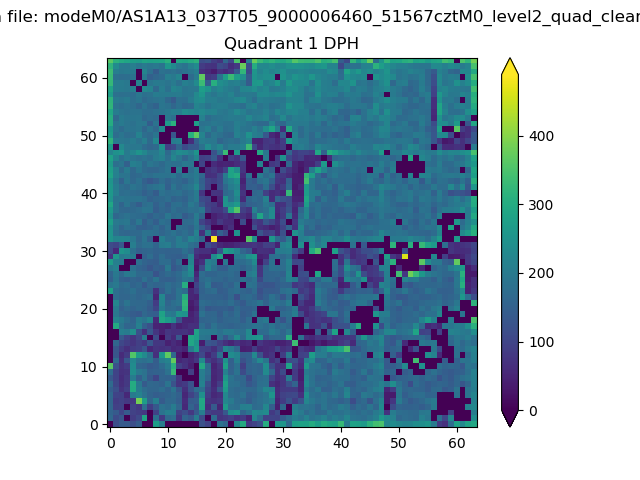 |
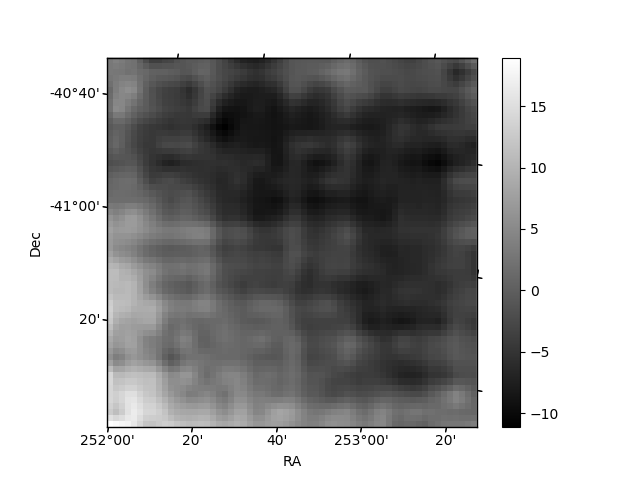
Quadrant B |
|---|---|---|---|
| Quadrant D | 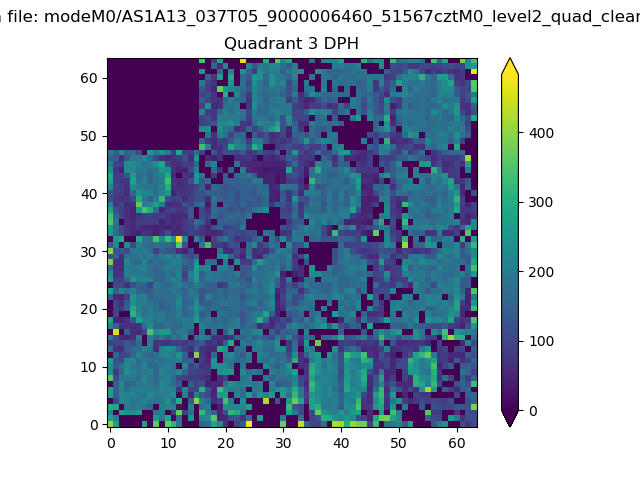 |
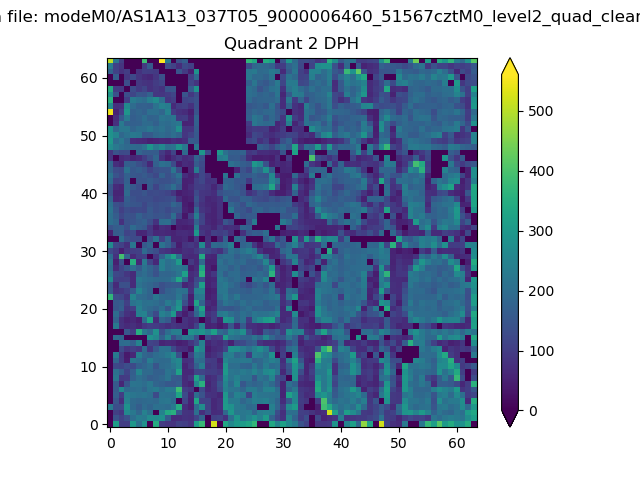 |
Quadrant C |
| Plot type | Count rate plots | Images |
|---|---|---|
| Comparison with Poisson distribution Blue bars denote a histogram of data divided into 1 sec bins. Red curve is a Poisson curve with rate = median count rate of data. |
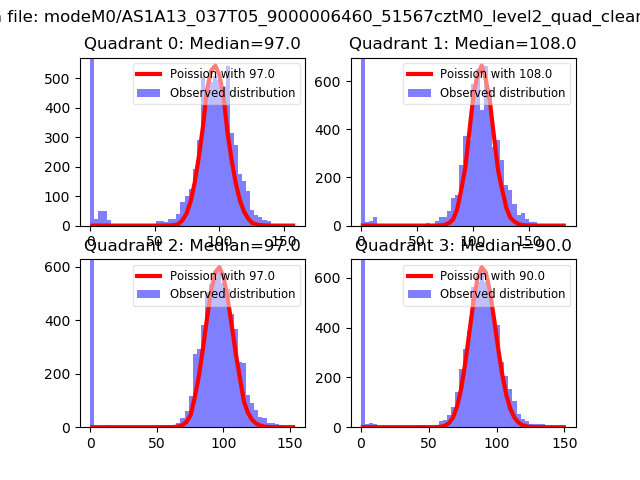 |
 |
| Quadrant-wise count rates Data is divided into 100 sec bins |
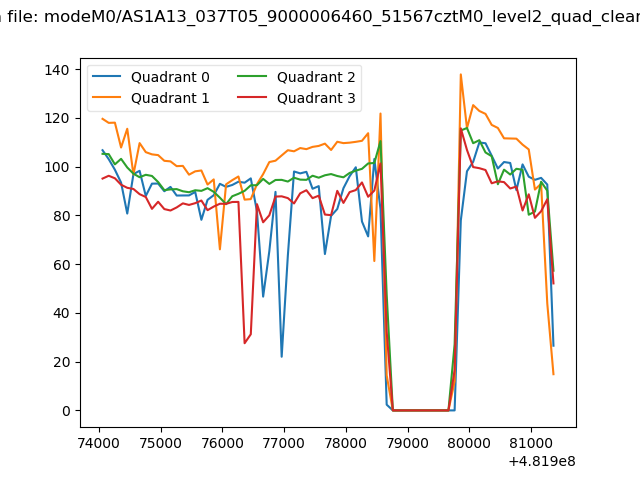 |
|
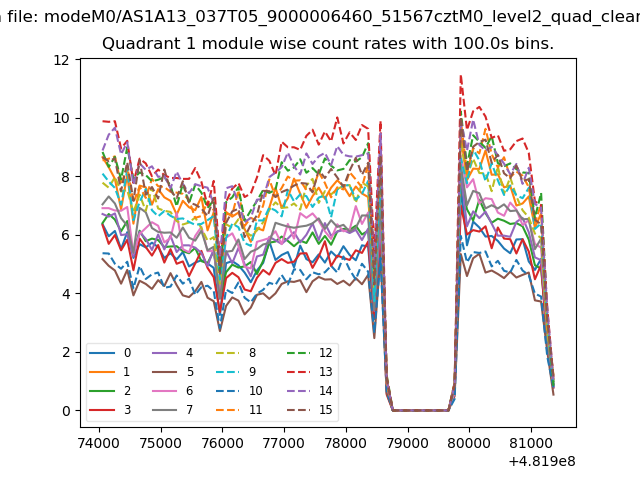
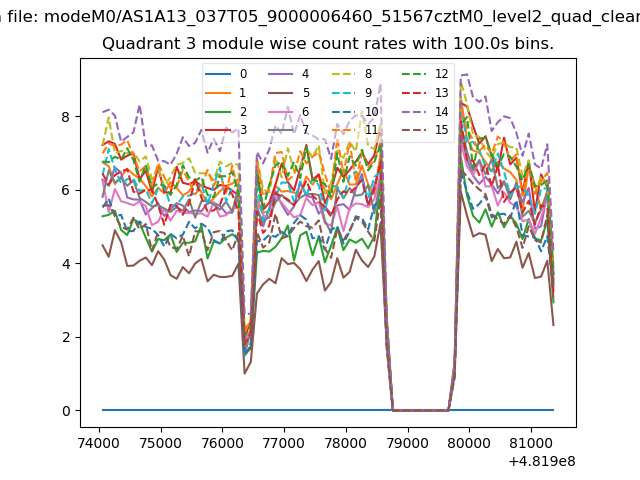
| Module-wise count rates for Quadrant A Data is divided into 100 sec bins |
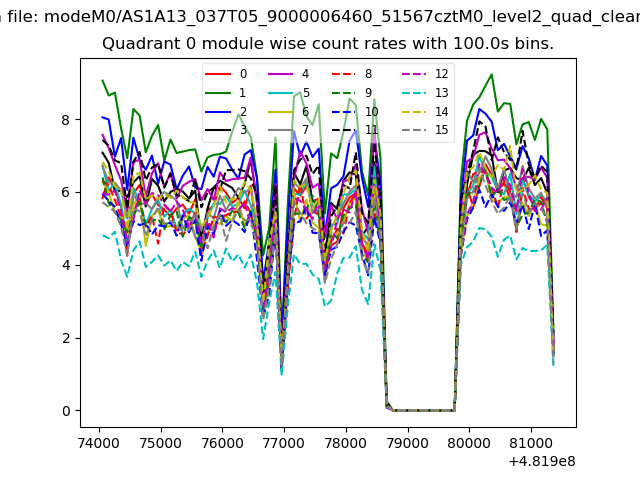 |
 |
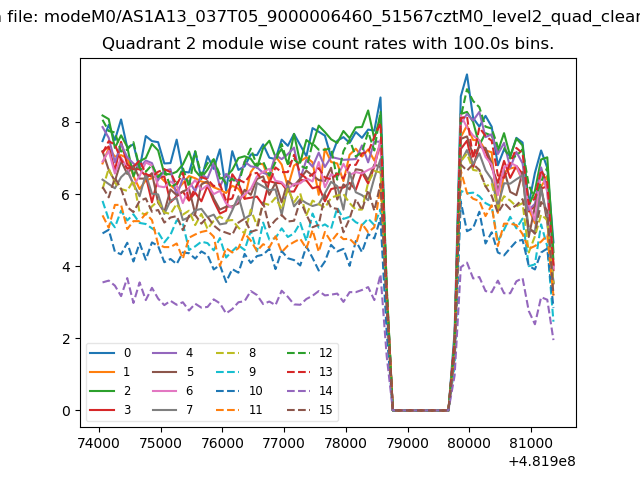
| Module-wise count rates for Quadrant B Data is divided into 100 sec bins |
 |
 |
| Module-wise count rates for Quadrant C Data is divided into 100 sec bins |
 |
 |
| Module-wise count rates for Quadrant D Data is divided into 100 sec bins |
 |
 |
| Parameter | Plot |
|---|---|
| CZT HV Monitor | 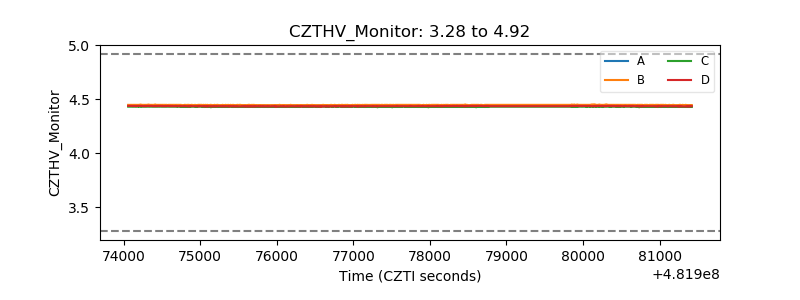 |
| D_VDD | 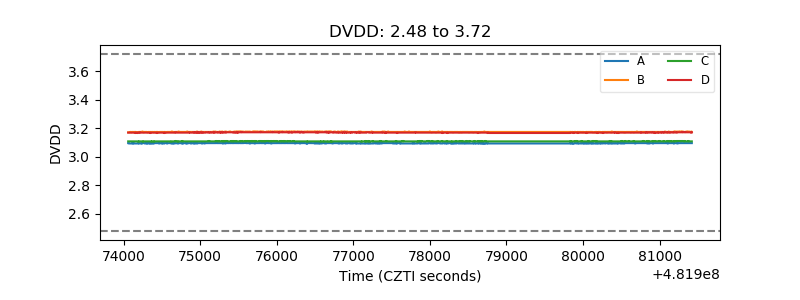 |
| Temperature 1 | 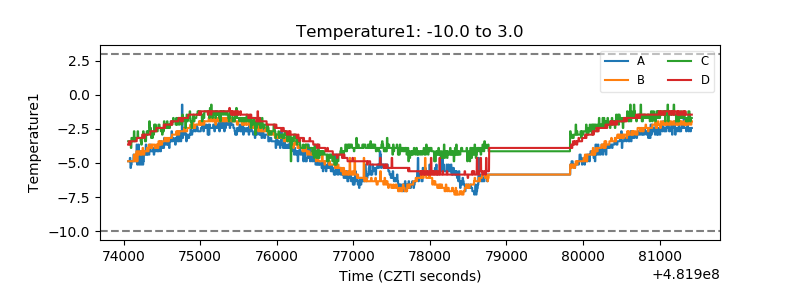 |
| Veto HV Monitor | 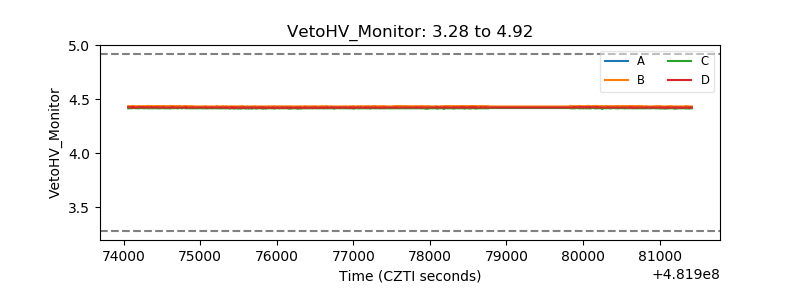 |
| Veto LLD | 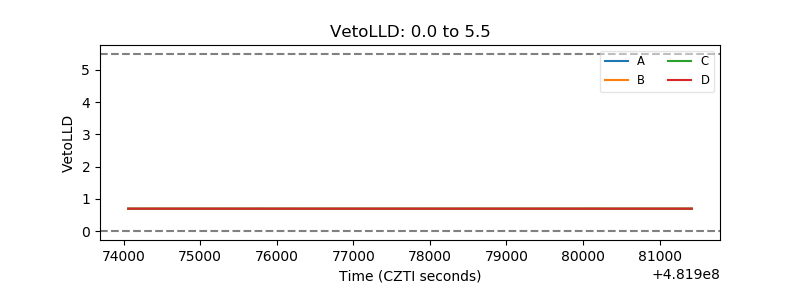 |
| Alpha Counter | 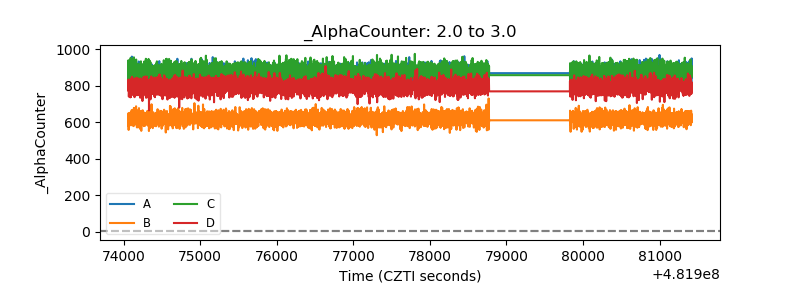 |
| _CPM_Rate | 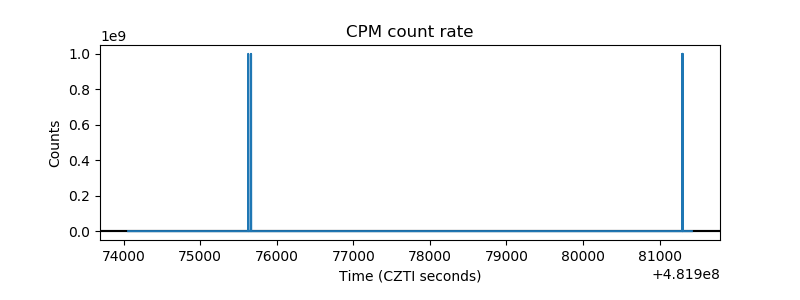 |
| CZT Counter | 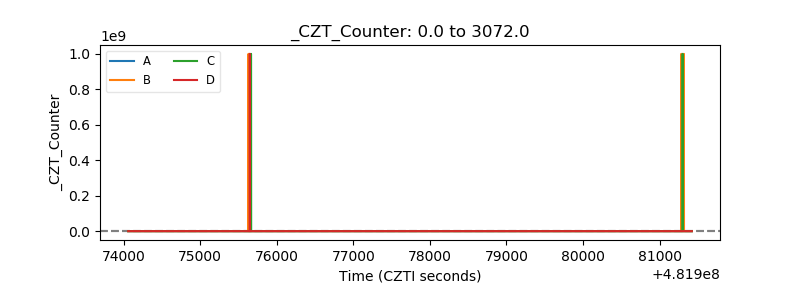 |
| +2.5 Volts monitor | 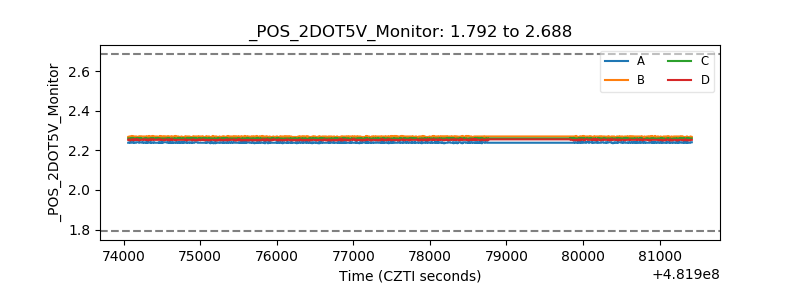 |
| +5 Volts monitor | 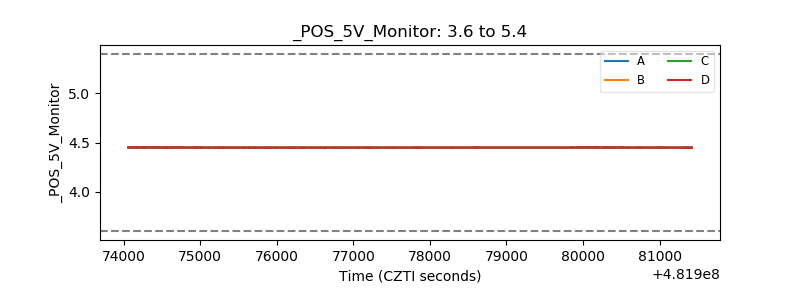 |
| _ROLL_ROT | 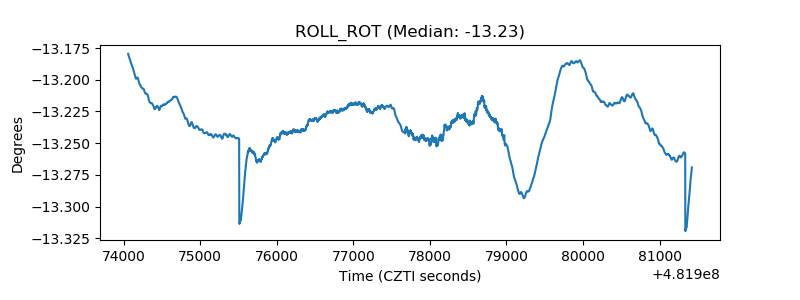 |
| _Roll_DEC | 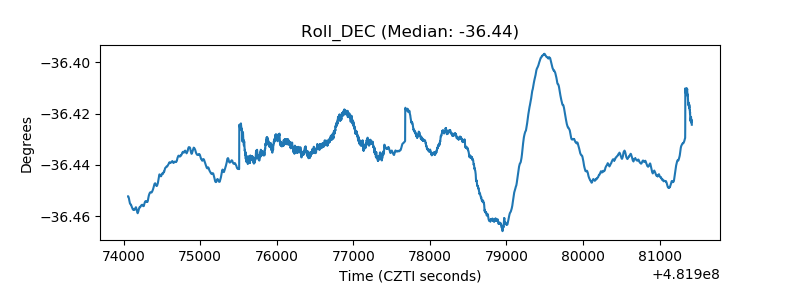 |
| _Roll_RA | 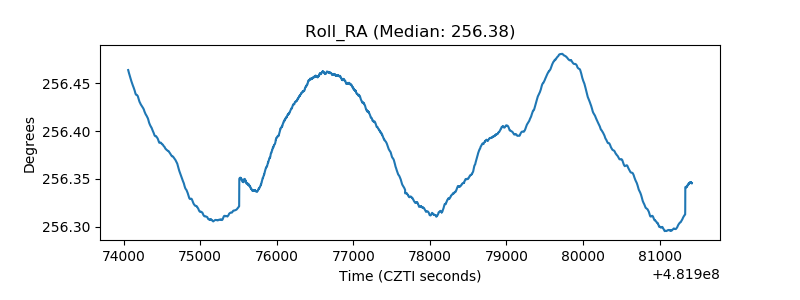 |
| Veto Counter | 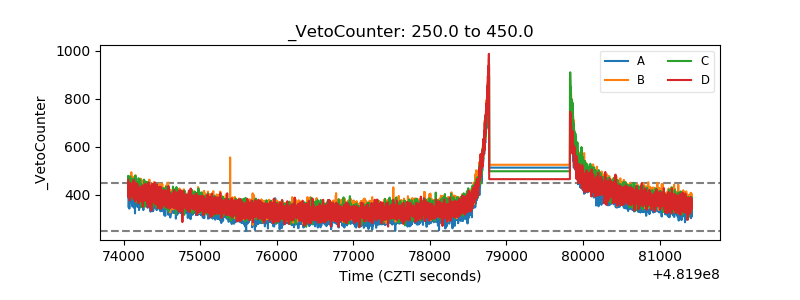 |