| Param | Original file | Final file |
|---|---|---|
| Filename | modeM0/AS1A13_037T05_9000006460_51568cztM0_level2.fits | modeM0/AS1A13_037T05_9000006460_51568cztM0_level2_quad_clean.evt |
| Size (bytes) | 894,075,840 | 83,983,680 |
| Size | 852.7 MB | 80.1 MB |
| Events in quadrant A | 8,585,413 | 559,670 |
| Events in quadrant B | 7,968,945 | 607,934 |
| Events in quadrant C | 11,048,480 | 304,298 |
| Events in quadrant D | 4,964,256 | 595,201 |
| Mode M9 | |||
|---|---|---|---|
| Quadrant | BADHDUFLAG | Total packets | Discarded packets |
| A | 0 | 11 | 0 |
| B | 0 | 12 | 0 |
| C | 0 | 12 | 0 |
| D | 0 | 12 | 0 |
| Mode M0 | |||
|---|---|---|---|
| Quadrant | BADHDUFLAG | Total packets | Discarded packets |
| A | 0 | 30296 | 0 |
| B | 0 | 28387 | 0 |
| C | 0 | 37406 | 0 |
| D | 0 | 19380 | 0 |
| Mode SS | |||
|---|---|---|---|
| Quadrant | BADHDUFLAG | Total packets | Discarded packets |
| A | 0 | 136 | 0 |
| B | 0 | 136 | 0 |
| C | 0 | 136 | 0 |
| D | 0 | 136 | 0 |
| Quadrant | Total seconds | Saturated seconds | Saturation percentage |
|---|---|---|---|
| A | 6836 | 1581 | 23.127560% |
| B | 6836 | 1582 | 23.142188% |
| C | 6836 | 3893 | 56.948508% |
| D | 6836 | 420 | 6.143944% |
Noise dominated data is calculated using 1-second bins in cleaned event files. If a bin has >2000 counts, and if more than 50% of those come from <1% of pixels, then it is considered to be noise-dominated and hence unusable.
| Quadrant | # 1 sec bins | Bins with >0 counts | Bins with >2000 counts | High rate bins dominated by noise | Noise dominated (total time) | Noise dominated (detector-on time) | Marked lightcurve |
|---|---|---|---|---|---|---|---|
| A | 7871 | 6837 | 1005 | 1005 | 12.77% | 14.70% | 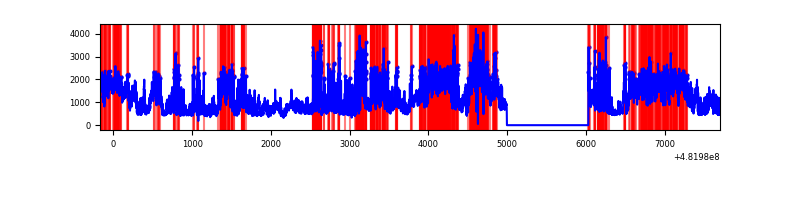 |
| B | 7871 | 6837 | 1167 | 1167 | 14.83% | 17.07% | 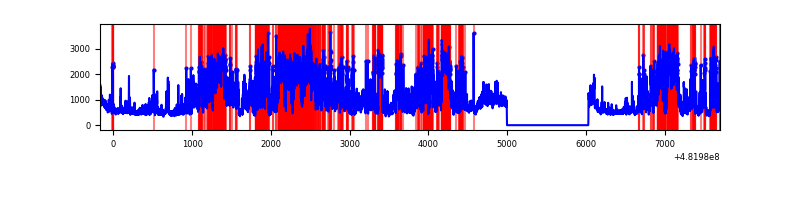 |
| C | 7871 | 6836 | 3243 | 3243 | 41.20% | 47.44% | 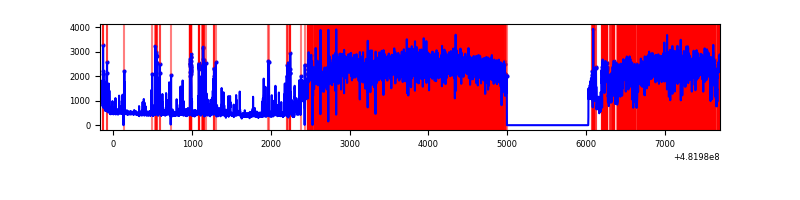 |
| D | 7871 | 6837 | 291 | 291 | 3.70% | 4.26% | 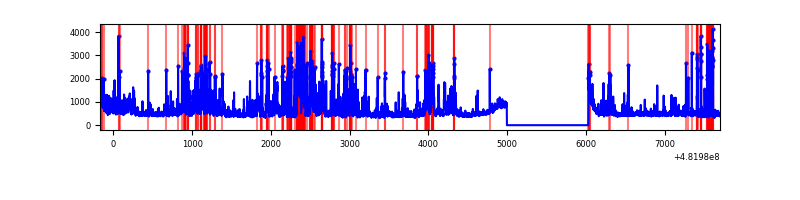 |
Top three noisy pixels from each quadrant. If the there are fewer than three noisy pixels in the level2.evt file, extra rows are filled as -1
| Pixel properties | Quadrant properties | ||||||
|---|---|---|---|---|---|---|---|
| Quadrant | DetID | PixID | Counts | Sigma | Mean | Median | Sigma |
| A | 12 | 3 | 1946158 | 10874.69 | 729 | 713 | 178.9 |
| A | 7 | 64 | 1475650 | 8244.63 | 729 | 713 | 178.9 |
| A | 12 | 250 | 1160707 | 6484.16 | 729 | 713 | 178.9 |
| B | 10 | 44 | 2988770 | 19299.04 | 728 | 701 | 154.8 |
| B | 4 | 81 | 1050293 | 6779.0 | 728 | 701 | 154.8 |
| B | 4 | 174 | 252904 | 1628.9 | 728 | 701 | 154.8 |
| C | 15 | 198 | 8324415 | 59604.8 | 509 | 505 | 139.7 |
| C | 13 | 3 | 316961 | 2266.03 | 509 | 505 | 139.7 |
| C | 14 | 245 | 146692 | 1046.79 | 509 | 505 | 139.7 |
| D | 8 | 176 | 766095 | 3698.07 | 753 | 729 | 207.0 |
| D | 2 | 249 | 263850 | 1271.34 | 753 | 729 | 207.0 |
| D | 12 | 6 | 214487 | 1032.83 | 753 | 729 | 207.0 |
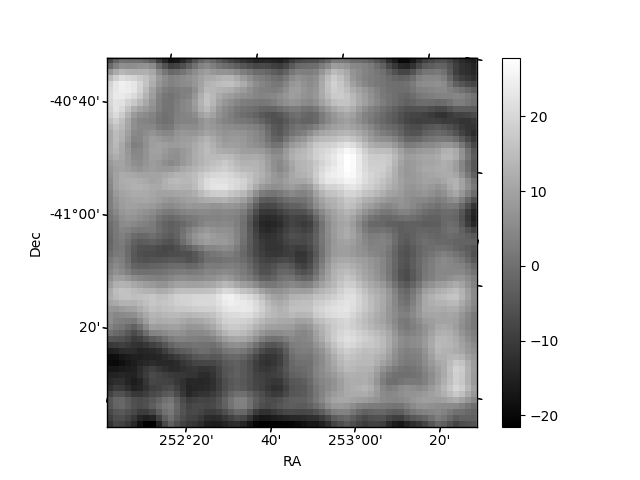
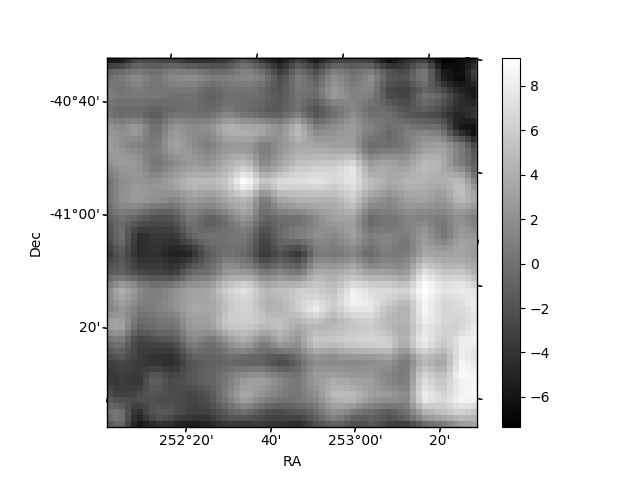
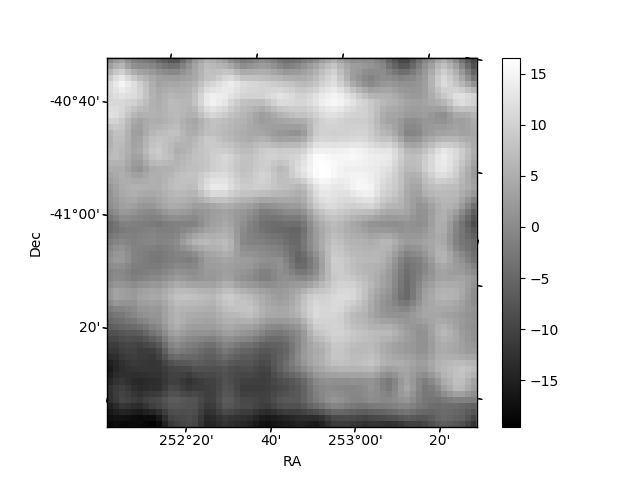
Histogram calculated using DETX and DETY for each event in the final _common_clean file
| Quadrant A | 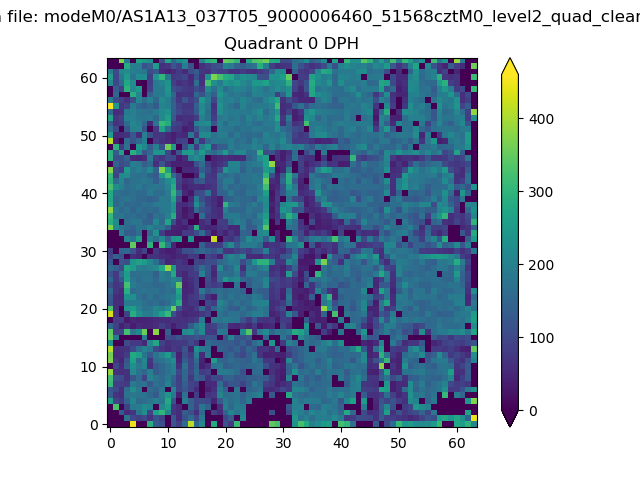 |
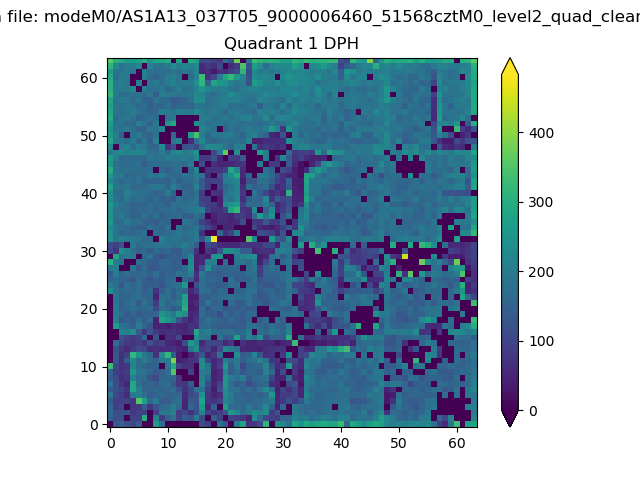 |
Quadrant B |
|---|---|---|---|
| Quadrant D | 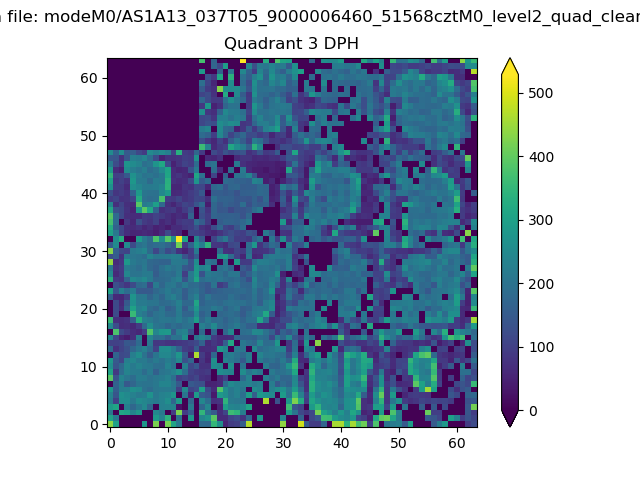 |
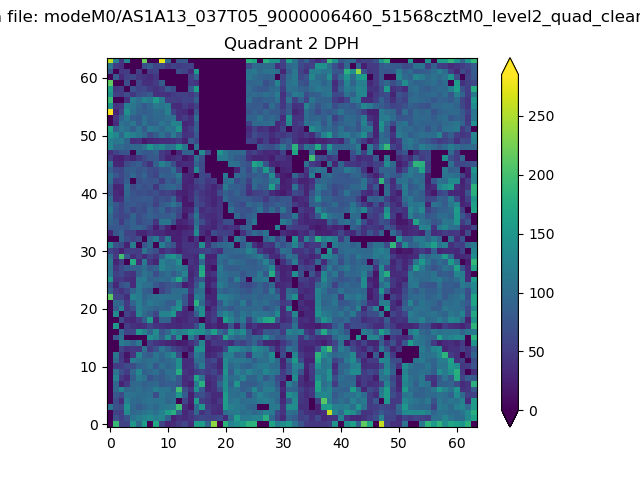 |
Quadrant C |
| Plot type | Count rate plots | Images |
|---|---|---|
| Comparison with Poisson distribution Blue bars denote a histogram of data divided into 1 sec bins. Red curve is a Poisson curve with rate = median count rate of data. |
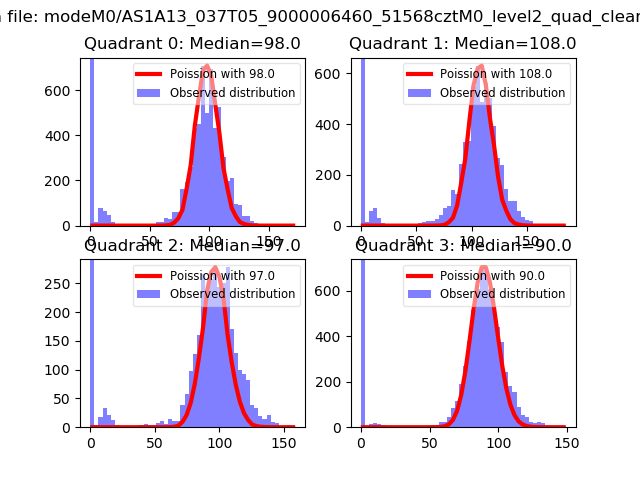 |
 |
| Quadrant-wise count rates Data is divided into 100 sec bins |
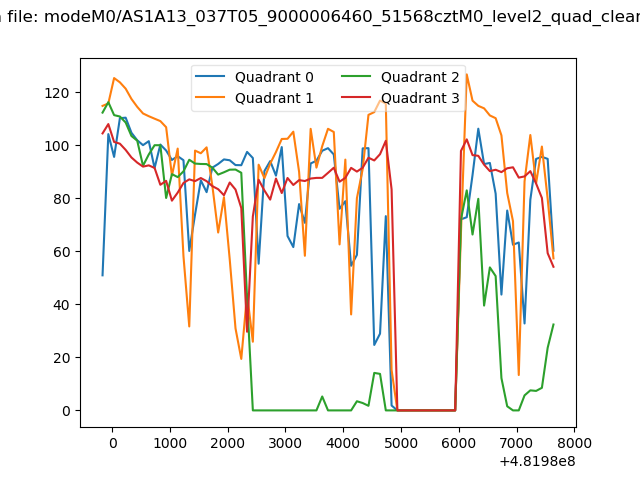 |
|
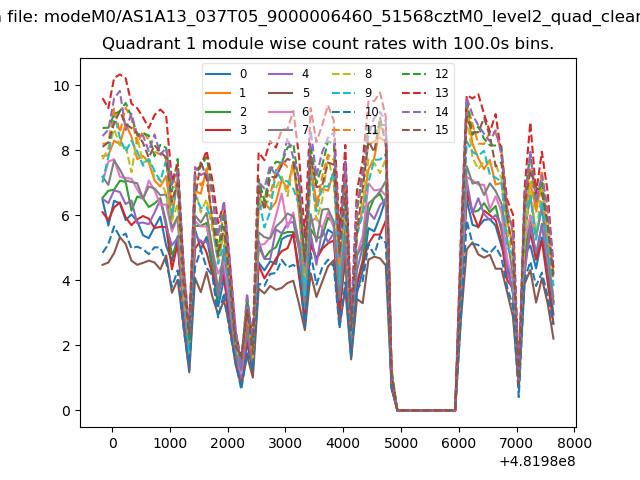
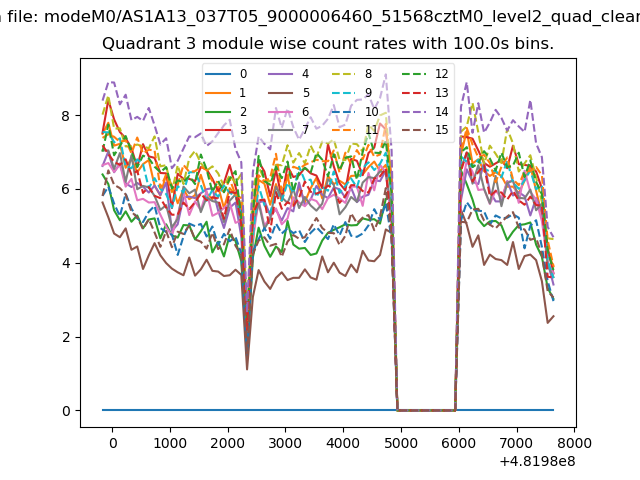
| Module-wise count rates for Quadrant A Data is divided into 100 sec bins |
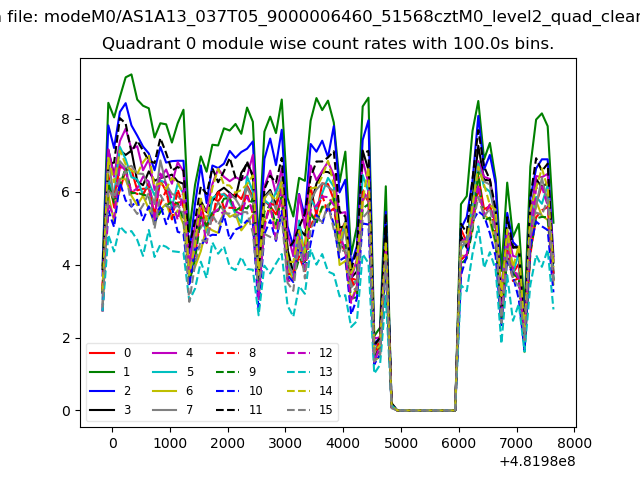 |
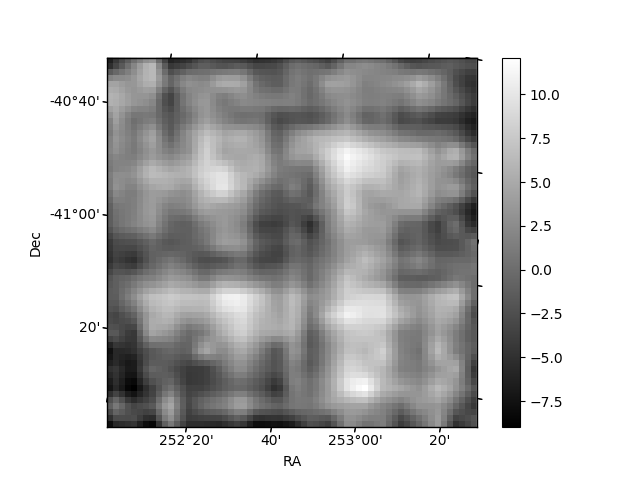 |
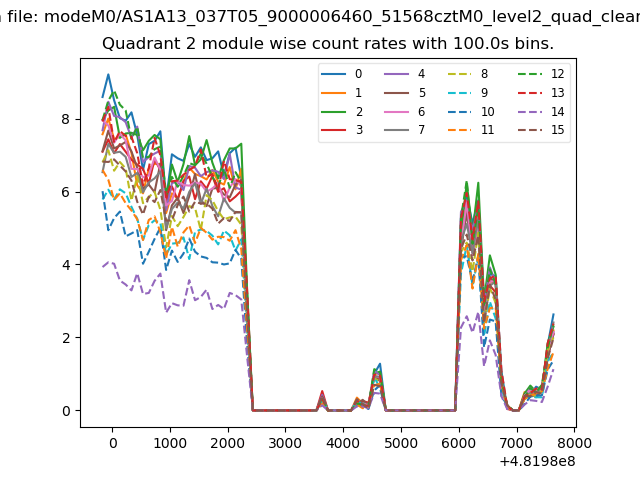
| Module-wise count rates for Quadrant B Data is divided into 100 sec bins |
 |
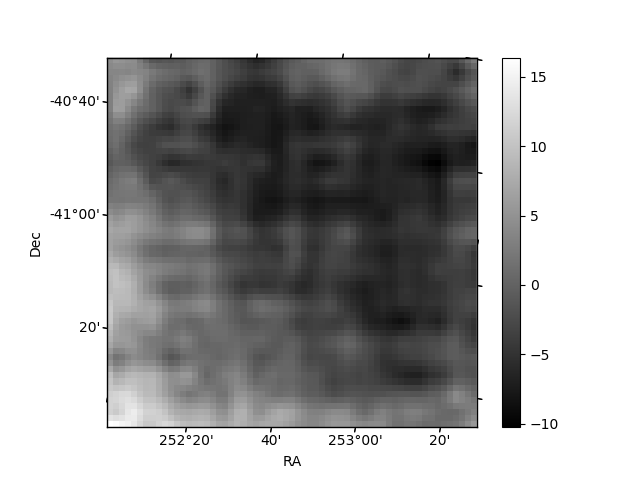 |
| Module-wise count rates for Quadrant C Data is divided into 100 sec bins |
 |
 |
| Module-wise count rates for Quadrant D Data is divided into 100 sec bins |
 |
 |
| Parameter | Plot |
|---|---|
| CZT HV Monitor |  |
| D_VDD | 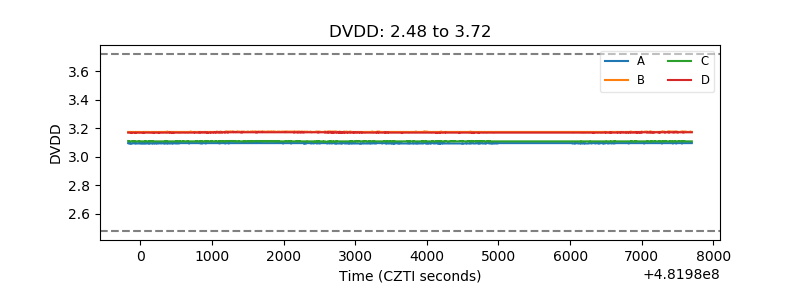 |
| Temperature 1 | 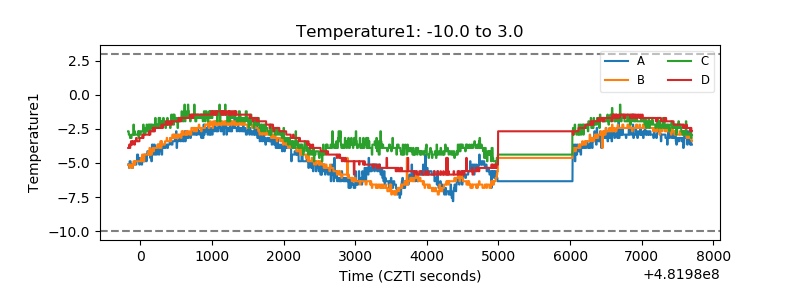 |
| Veto HV Monitor | 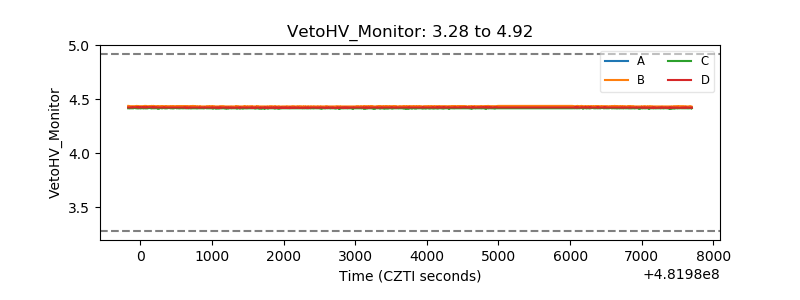 |
| Veto LLD | 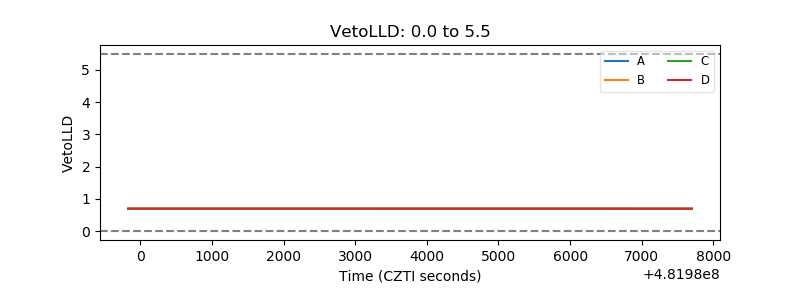 |
| Alpha Counter | 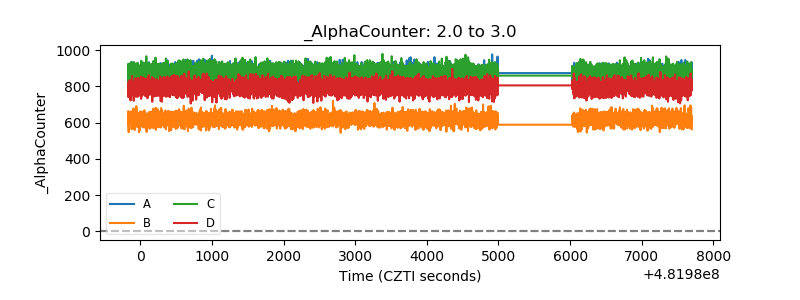 |
| _CPM_Rate | 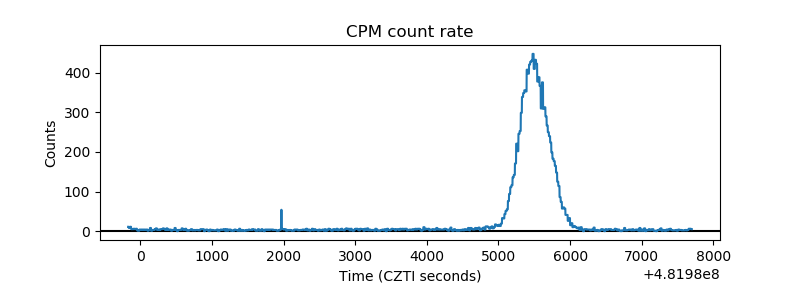 |
| CZT Counter | 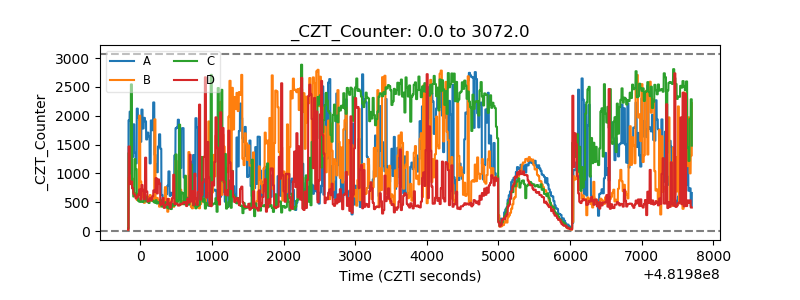 |
| +2.5 Volts monitor | 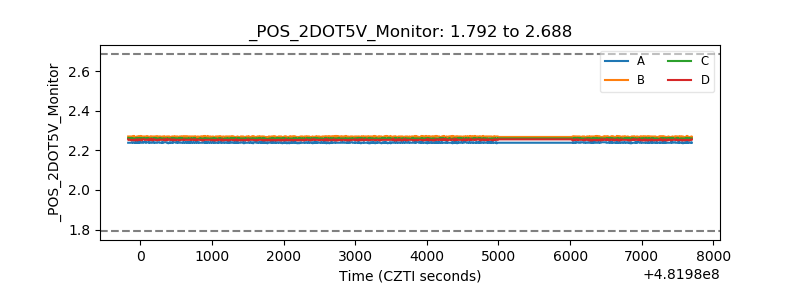 |
| +5 Volts monitor | 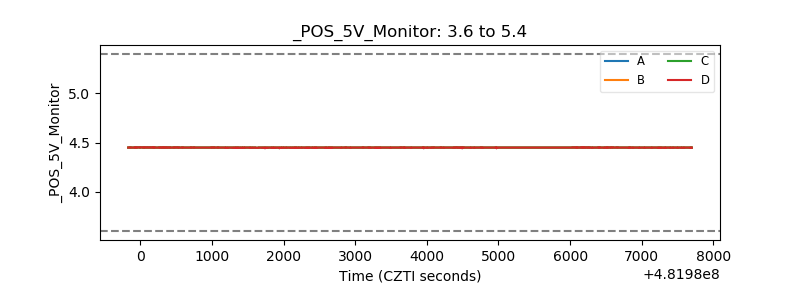 |
| _ROLL_ROT | 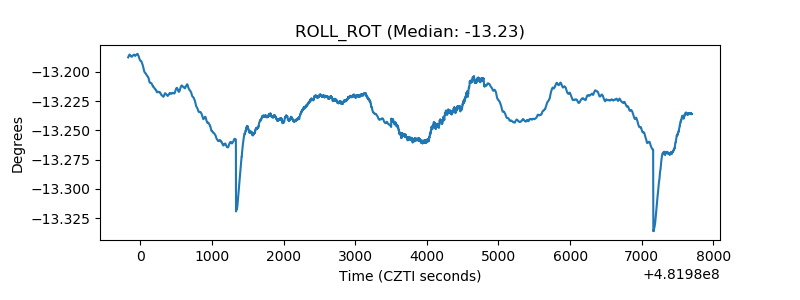 |
| _Roll_DEC | 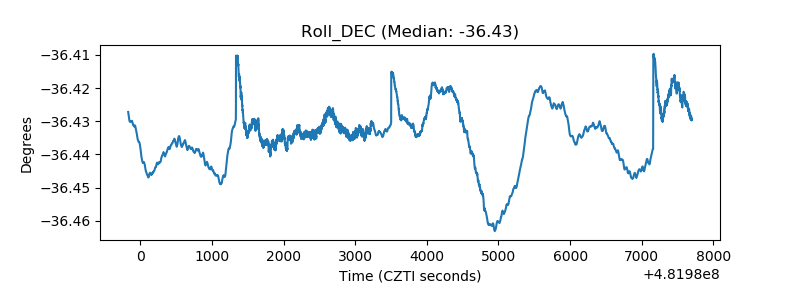 |
| _Roll_RA | 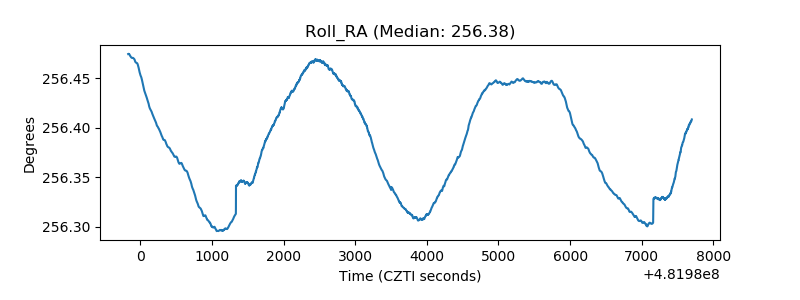 |
| Veto Counter | 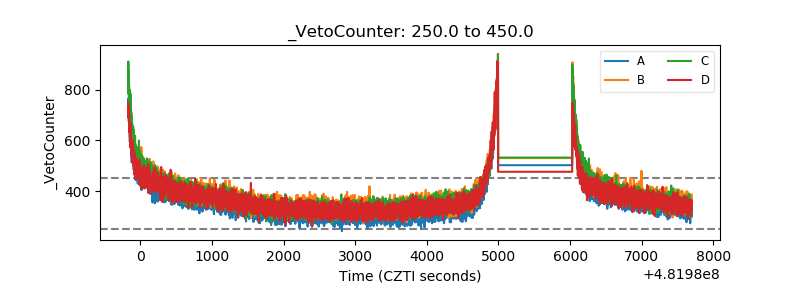 |