| Param | Original file | Final file |
|---|---|---|
| Filename | modeM0/AS1A13_037T05_9000006460_51569cztM0_level2.fits | modeM0/AS1A13_037T05_9000006460_51569cztM0_level2_quad_clean.evt |
| Size (bytes) | 837,990,720 | 85,832,640 |
| Size | 799.2 MB | 81.9 MB |
| Events in quadrant A | 7,327,905 | 590,047 |
| Events in quadrant B | 6,213,056 | 643,656 |
| Events in quadrant C | 12,344,064 | 299,555 |
| Events in quadrant D | 4,606,954 | 590,354 |
| Mode M9 | |||
|---|---|---|---|
| Quadrant | BADHDUFLAG | Total packets | Discarded packets |
| A | 0 | 12 | 0 |
| B | 0 | 13 | 0 |
| C | 0 | 13 | 0 |
| D | 0 | 13 | 0 |
| Mode M0 | |||
|---|---|---|---|
| Quadrant | BADHDUFLAG | Total packets | Discarded packets |
| A | 0 | 26536 | 1 |
| B | 0 | 23119 | 1 |
| C | 0 | 41353 | 1 |
| D | 0 | 18328 | 1 |
| Mode SS | |||
|---|---|---|---|
| Quadrant | BADHDUFLAG | Total packets | Discarded packets |
| A | 0 | 138 | 0 |
| B | 0 | 138 | 0 |
| C | 0 | 138 | 0 |
| D | 0 | 138 | 0 |
| Quadrant | Total seconds | Saturated seconds | Saturation percentage |
|---|---|---|---|
| A | 6818 | 1100 | 16.133764% |
| B | 6818 | 986 | 14.461719% |
| C | 6818 | 3878 | 56.878850% |
| D | 6818 | 334 | 4.898797% |
Noise dominated data is calculated using 1-second bins in cleaned event files. If a bin has >2000 counts, and if more than 50% of those come from <1% of pixels, then it is considered to be noise-dominated and hence unusable.
| Quadrant | # 1 sec bins | Bins with >0 counts | Bins with >2000 counts | High rate bins dominated by noise | Noise dominated (total time) | Noise dominated (detector-on time) | Marked lightcurve |
|---|---|---|---|---|---|---|---|
| A | 7808 | 6819 | 593 | 593 | 7.59% | 8.70% | 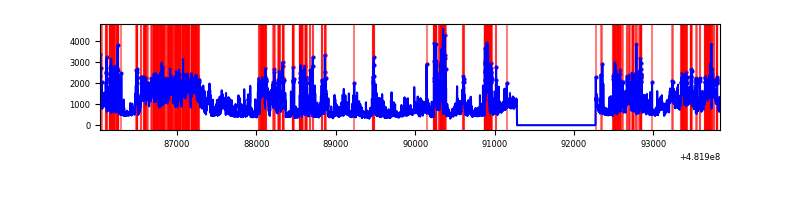 |
| B | 7808 | 6819 | 620 | 620 | 7.94% | 9.09% | 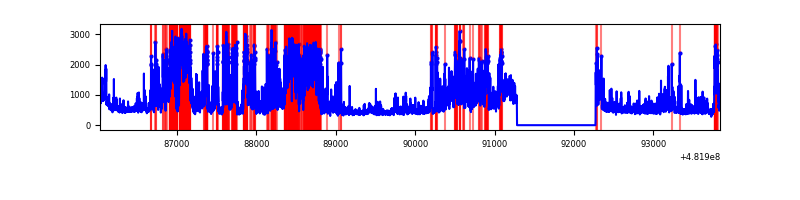 |
| C | 7808 | 6819 | 3534 | 3534 | 45.26% | 51.83% | 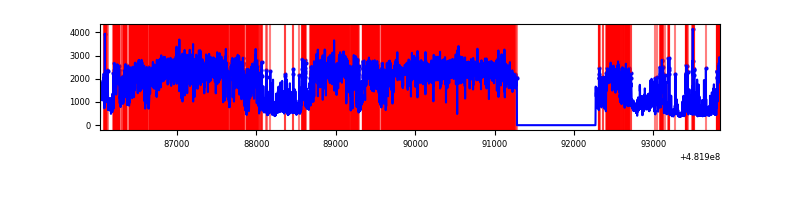 |
| D | 7808 | 6819 | 187 | 187 | 2.39% | 2.74% | 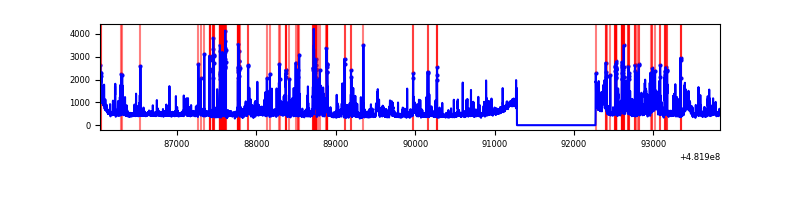 |
Top three noisy pixels from each quadrant. If the there are fewer than three noisy pixels in the level2.evt file, extra rows are filled as -1
| Pixel properties | Quadrant properties | ||||||
|---|---|---|---|---|---|---|---|
| Quadrant | DetID | PixID | Counts | Sigma | Mean | Median | Sigma |
| A | 12 | 3 | 1448473 | 8051.91 | 738 | 719 | 179.8 |
| A | 7 | 64 | 1224799 | 6807.91 | 738 | 719 | 179.8 |
| A | 12 | 250 | 856486 | 4759.48 | 738 | 719 | 179.8 |
| B | 10 | 44 | 1364911 | 8641.9 | 736 | 710 | 157.9 |
| B | 4 | 81 | 1102781 | 6981.37 | 736 | 710 | 157.9 |
| B | 4 | 174 | 246965 | 1559.97 | 736 | 710 | 157.9 |
| C | 15 | 198 | 9206873 | 63429.98 | 530 | 527 | 145.1 |
| C | 3 | 242 | 531605 | 3659.03 | 530 | 527 | 145.1 |
| C | 13 | 3 | 275515 | 1894.62 | 530 | 527 | 145.1 |
| D | 8 | 176 | 684183 | 3311.81 | 744 | 720 | 206.4 |
| D | 2 | 249 | 249403 | 1205.03 | 744 | 720 | 206.4 |
| D | 6 | 42 | 195017 | 941.49 | 744 | 720 | 206.4 |
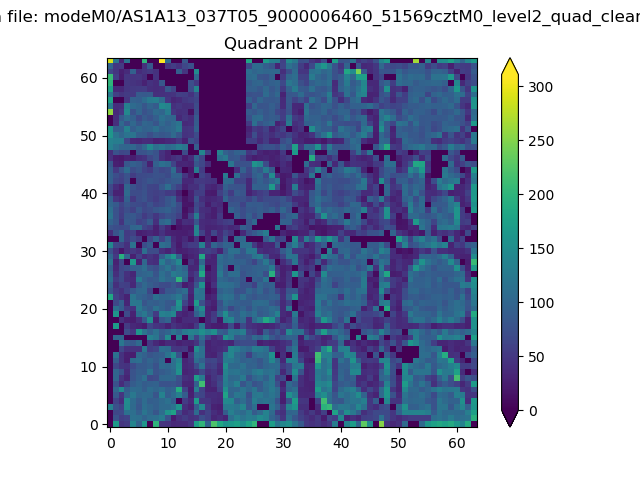
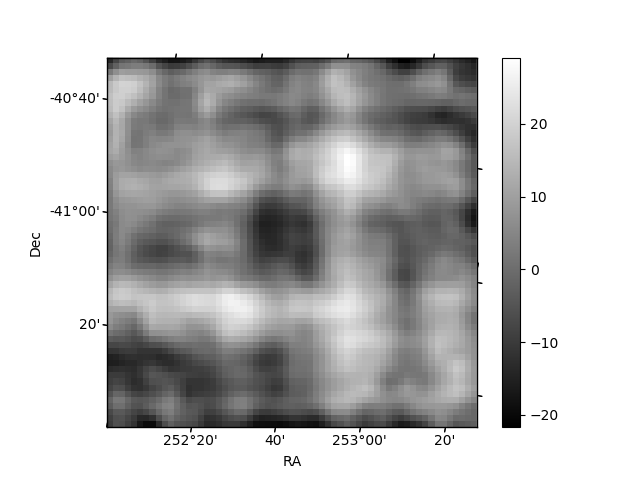
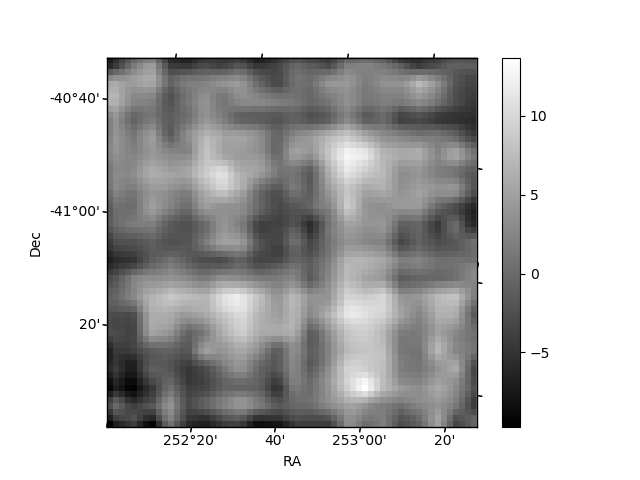
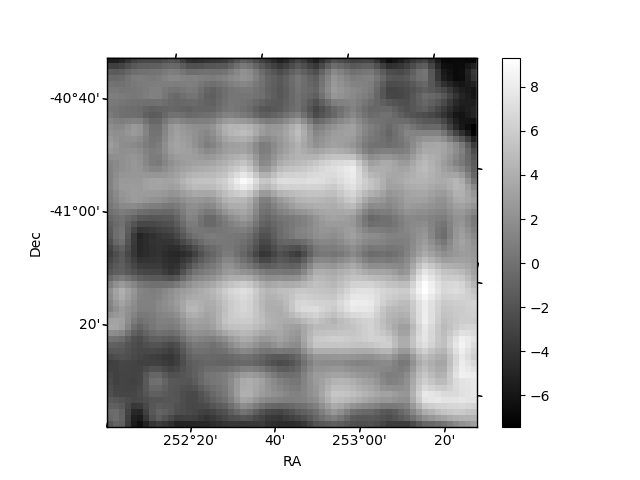
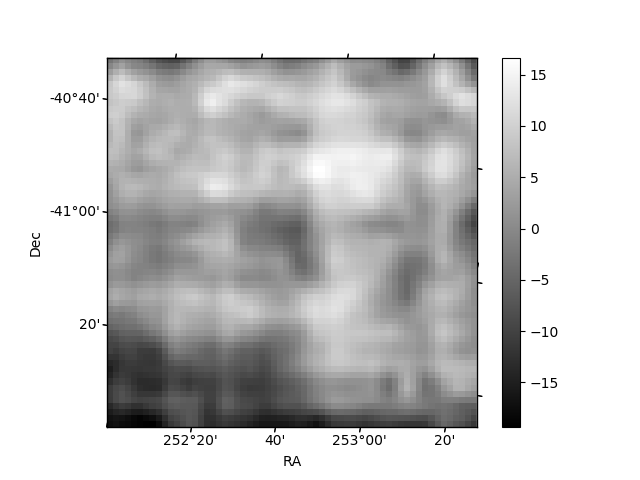
Histogram calculated using DETX and DETY for each event in the final _common_clean file
| Quadrant A | 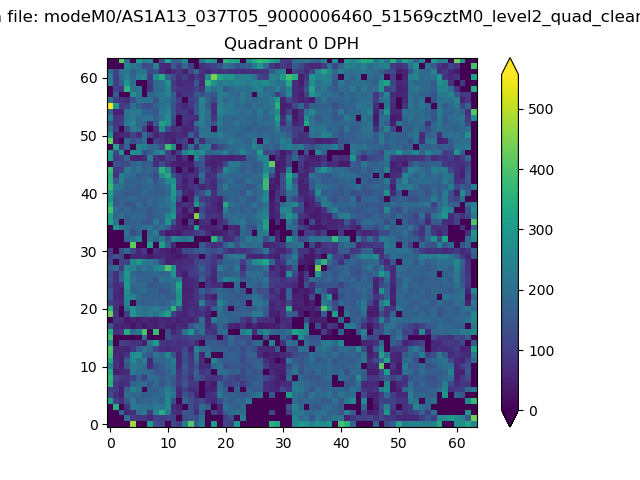 |
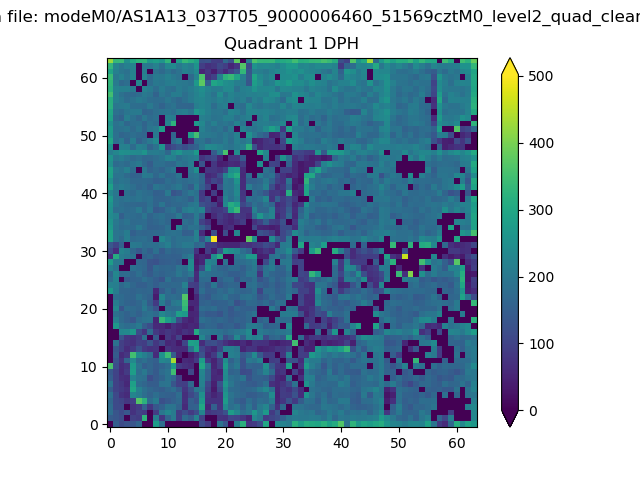 |
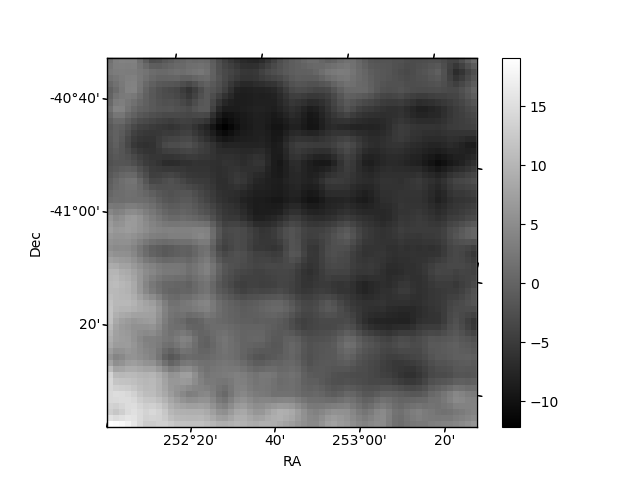
Quadrant B |
|---|---|---|---|
| Quadrant D | 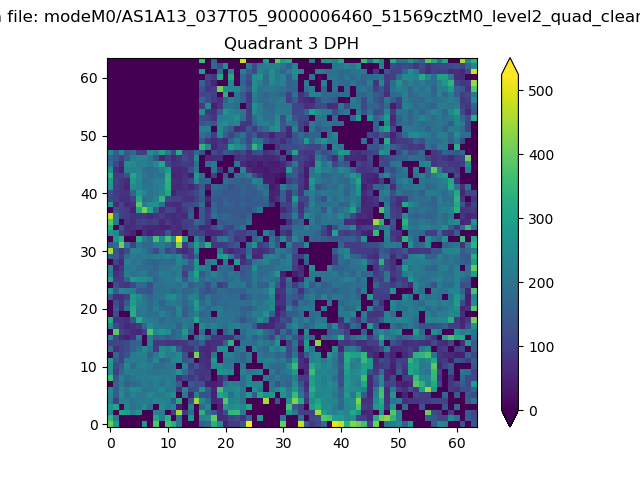 |
 |
Quadrant C |
| Plot type | Count rate plots | Images |
|---|---|---|
| Comparison with Poisson distribution Blue bars denote a histogram of data divided into 1 sec bins. Red curve is a Poisson curve with rate = median count rate of data. |
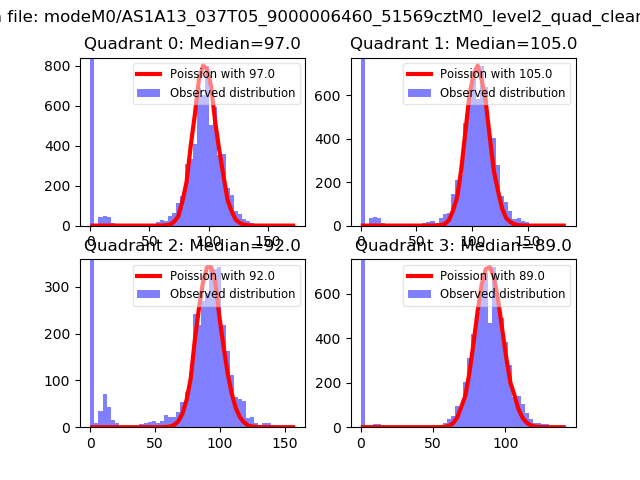 |
 |
| Quadrant-wise count rates Data is divided into 100 sec bins |
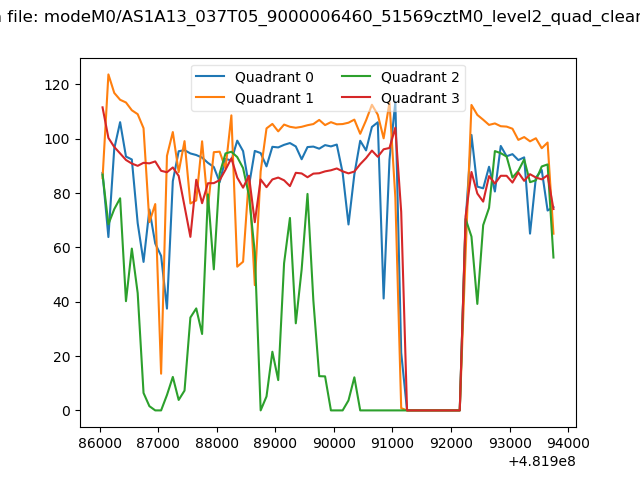 |
|
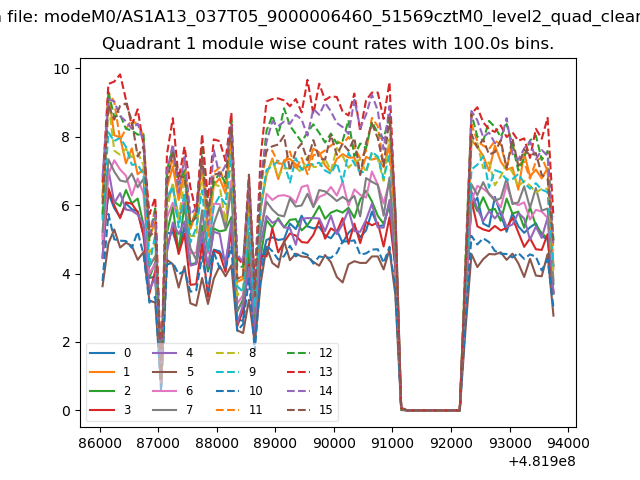
| Module-wise count rates for Quadrant A Data is divided into 100 sec bins |
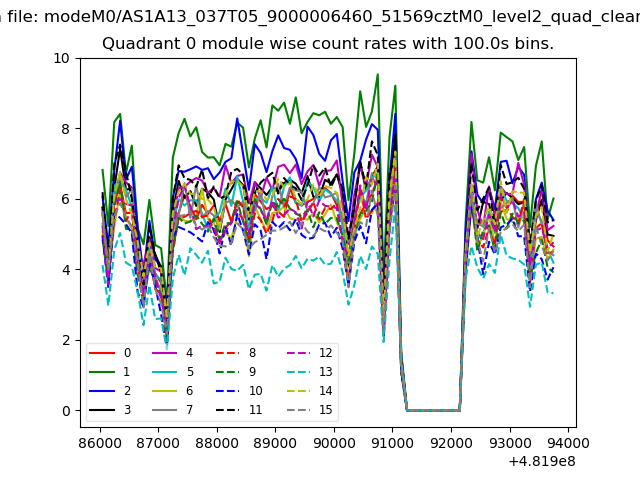 |
 |
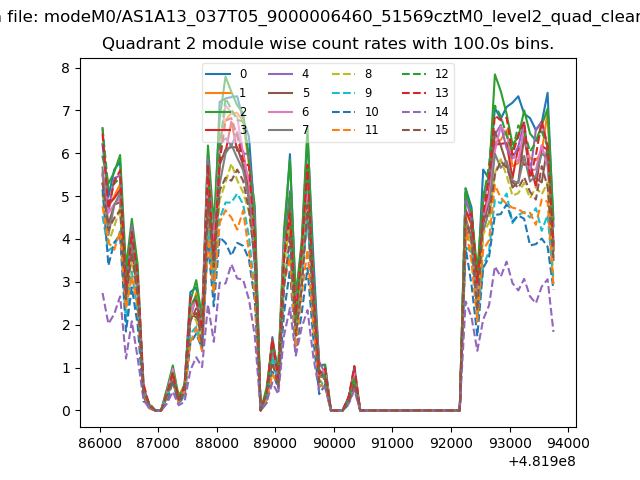
| Module-wise count rates for Quadrant B Data is divided into 100 sec bins |
 |
 |
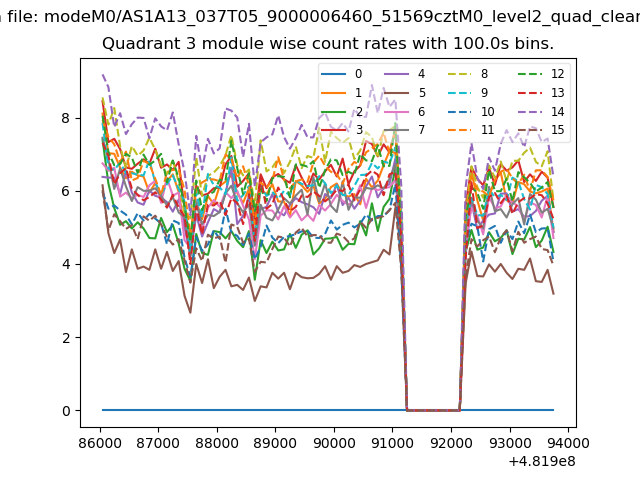
| Module-wise count rates for Quadrant C Data is divided into 100 sec bins |
 |
 |
| Module-wise count rates for Quadrant D Data is divided into 100 sec bins |
 |
 |
| Parameter | Plot |
|---|---|
| CZT HV Monitor |  |
| D_VDD | 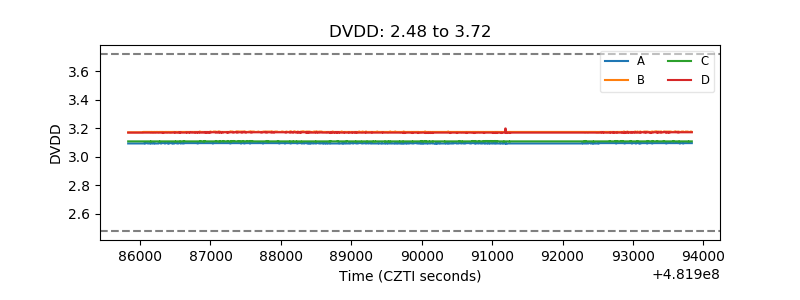 |
| Temperature 1 | 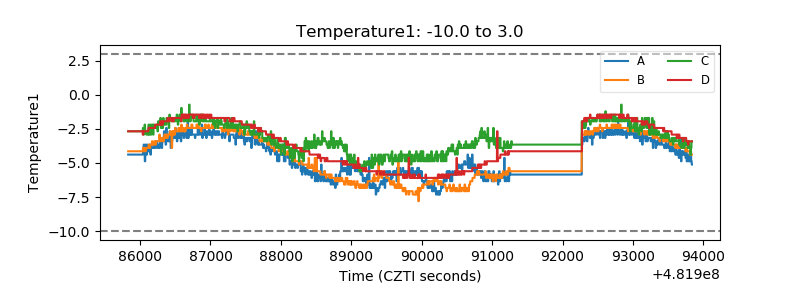 |
| Veto HV Monitor | 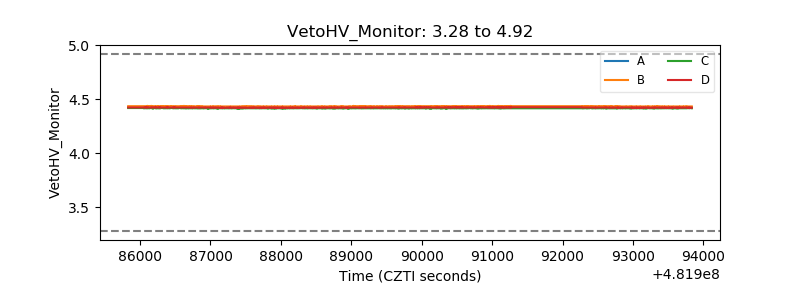 |
| Veto LLD | 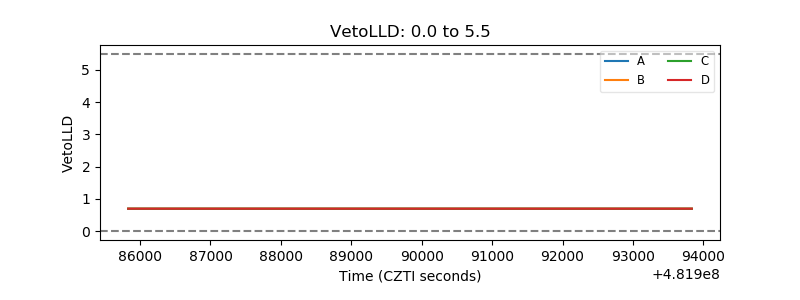 |
| Alpha Counter | 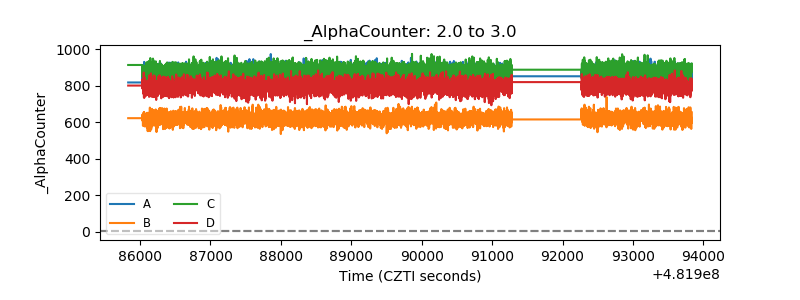 |
| _CPM_Rate | 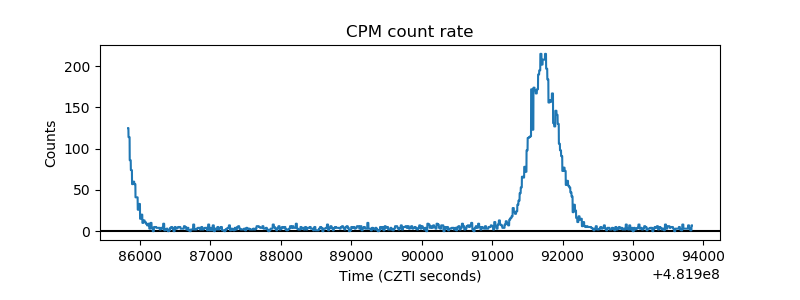 |
| CZT Counter | 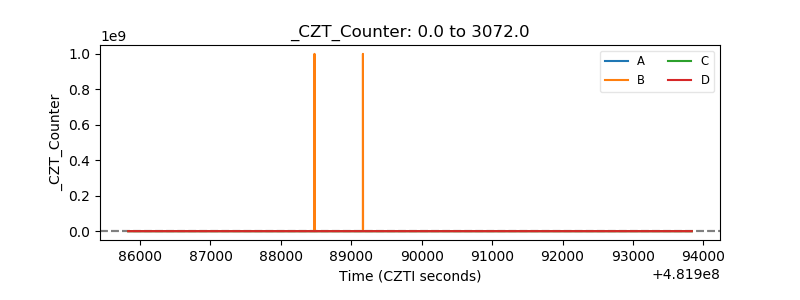 |
| +2.5 Volts monitor | 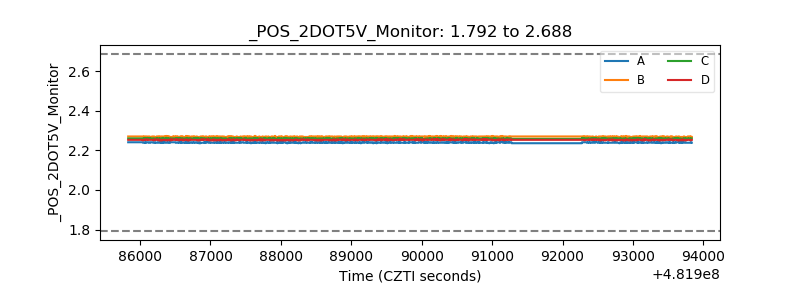 |
| +5 Volts monitor | 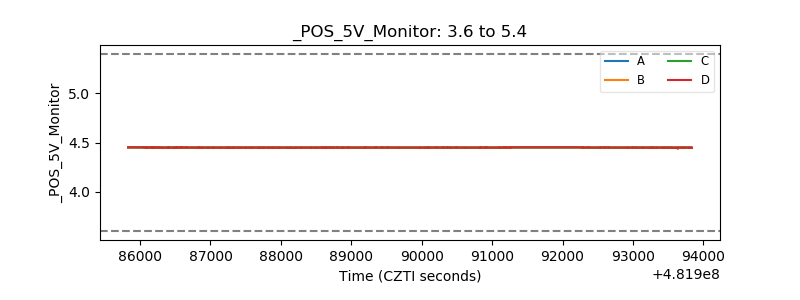 |
| _ROLL_ROT | 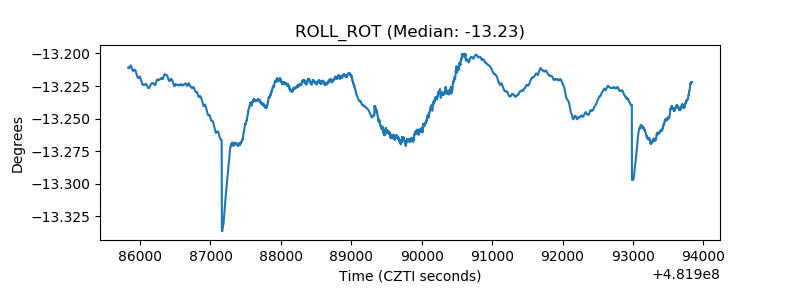 |
| _Roll_DEC | 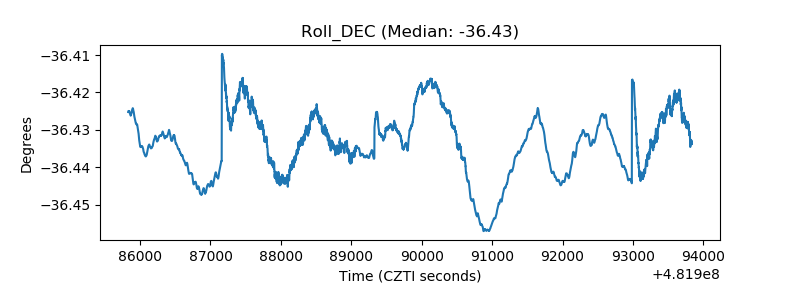 |
| _Roll_RA | 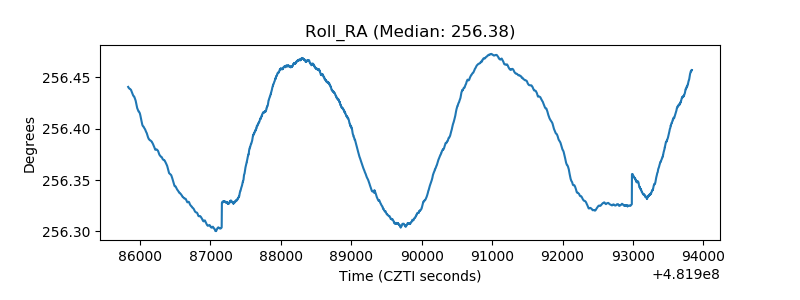 |
| Veto Counter | 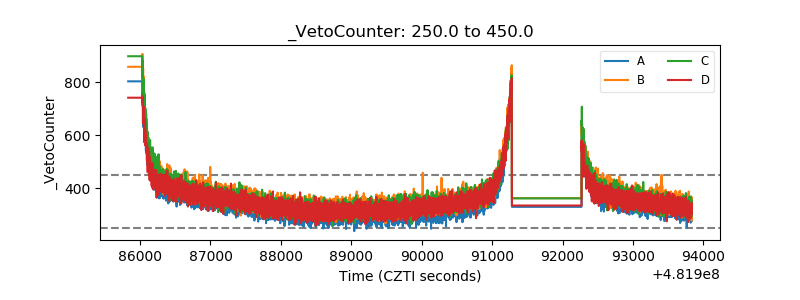 |