| Param | Original file | Final file |
|---|---|---|
| Filename | modeM0/AS1A13_037T05_9000006460_51571cztM0_level2.fits | modeM0/AS1A13_037T05_9000006460_51571cztM0_level2_quad_clean.evt |
| Size (bytes) | 1,053,696,960 | 84,648,960 |
| Size | 1004.9 MB | 80.7 MB |
| Events in quadrant A | 12,015,800 | 526,122 |
| Events in quadrant B | 4,326,694 | 779,582 |
| Events in quadrant C | 15,887,916 | 104,541 |
| Events in quadrant D | 6,188,462 | 626,239 |
| Mode M9 | |||
|---|---|---|---|
| Quadrant | BADHDUFLAG | Total packets | Discarded packets |
| A | 0 | 10 | 0 |
| B | 0 | 10 | 0 |
| C | 0 | 10 | 0 |
| D | 0 | 10 | 0 |
| Mode M0 | |||
|---|---|---|---|
| Quadrant | BADHDUFLAG | Total packets | Discarded packets |
| A | 0 | 40960 | 7 |
| B | 0 | 18044 | 2 |
| C | 0 | 52363 | 2 |
| D | 0 | 23592 | 2 |
| Mode SS | |||
|---|---|---|---|
| Quadrant | BADHDUFLAG | Total packets | Discarded packets |
| A | 0 | 154 | 0 |
| B | 0 | 154 | 0 |
| C | 0 | 154 | 0 |
| D | 0 | 154 | 0 |
| Quadrant | Total seconds | Saturated seconds | Saturation percentage |
|---|---|---|---|
| A | 7567 | 2578 | 34.068984% |
| B | 7568 | 280 | 3.699789% |
| C | 7568 | 6613 | 87.381078% |
| D | 7568 | 543 | 7.174947% |
Noise dominated data is calculated using 1-second bins in cleaned event files. If a bin has >2000 counts, and if more than 50% of those come from <1% of pixels, then it is considered to be noise-dominated and hence unusable.
| Quadrant | # 1 sec bins | Bins with >0 counts | Bins with >2000 counts | High rate bins dominated by noise | Noise dominated (total time) | Noise dominated (detector-on time) | Marked lightcurve |
|---|---|---|---|---|---|---|---|
| A | 8532 | 7569 | 1892 | 1892 | 22.18% | 25.00% | 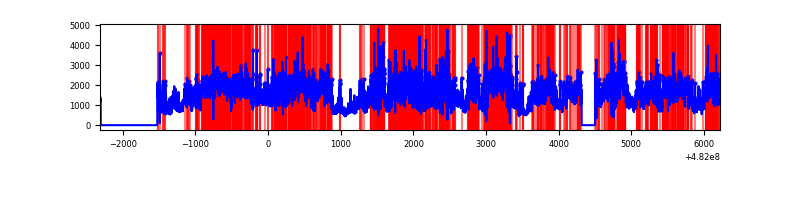 |
| B | 8533 | 7570 | 52 | 52 | 0.61% | 0.69% | 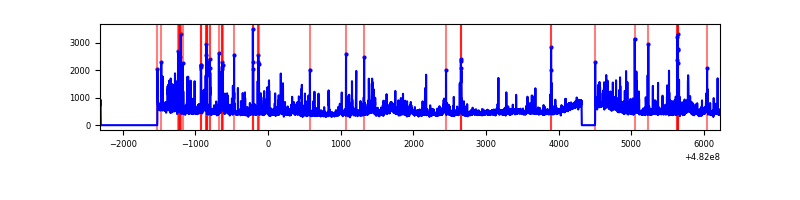 |
| C | 8533 | 7568 | 4701 | 4701 | 55.09% | 62.12% | 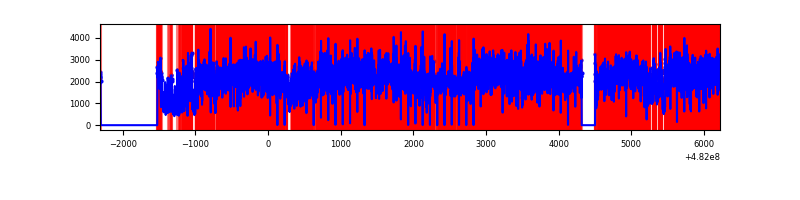 |
| D | 8533 | 7570 | 448 | 448 | 5.25% | 5.92% |  |
Top three noisy pixels from each quadrant. If the there are fewer than three noisy pixels in the level2.evt file, extra rows are filled as -1
| Pixel properties | Quadrant properties | ||||||
|---|---|---|---|---|---|---|---|
| Quadrant | DetID | PixID | Counts | Sigma | Mean | Median | Sigma |
| A | 12 | 3 | 3954410 | 21392.57 | 753 | 735 | 184.8 |
| A | 7 | 64 | 1865210 | 10088.31 | 753 | 735 | 184.8 |
| A | 12 | 250 | 839388 | 4537.79 | 753 | 735 | 184.8 |
| B | 4 | 174 | 189253 | 1044.22 | 838 | 807 | 180.5 |
| B | 0 | 171 | 133006 | 732.54 | 838 | 807 | 180.5 |
| B | 6 | 51 | 117260 | 645.29 | 838 | 807 | 180.5 |
| C | 15 | 198 | 14139934 | 156748.54 | 327 | 324 | 90.2 |
| C | 13 | 3 | 155153 | 1716.4 | 327 | 324 | 90.2 |
| C | 3 | 242 | 142906 | 1580.63 | 327 | 324 | 90.2 |
| D | 8 | 176 | 2028891 | 9094.94 | 796 | 766 | 223.0 |
| D | 12 | 6 | 277331 | 1240.23 | 796 | 766 | 223.0 |
| D | 3 | 12 | 207768 | 928.28 | 796 | 766 | 223.0 |
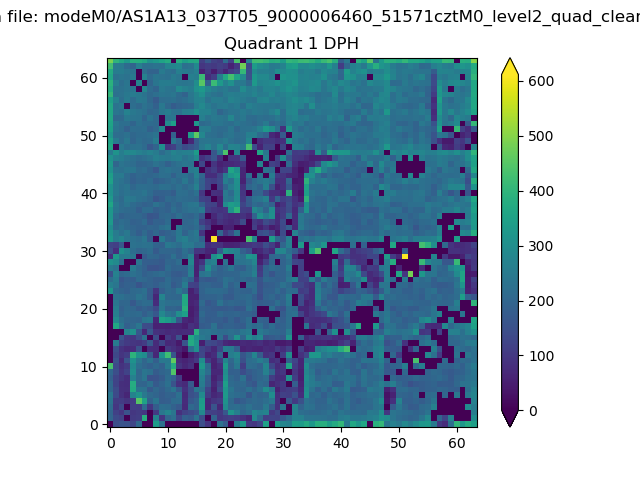
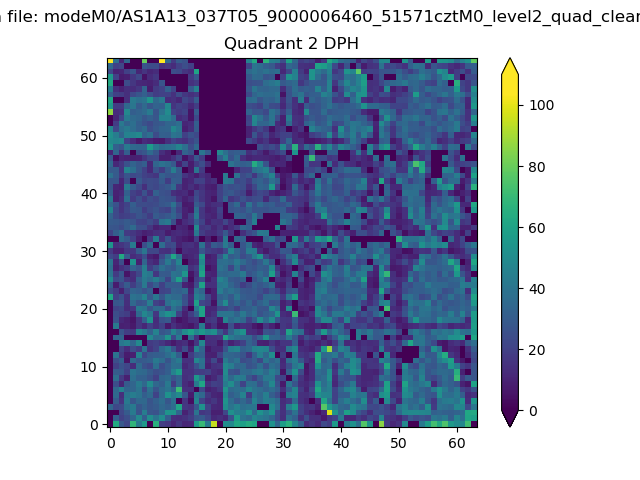
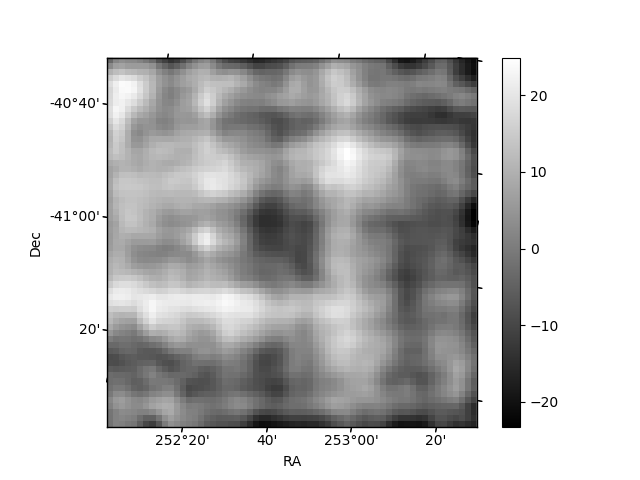
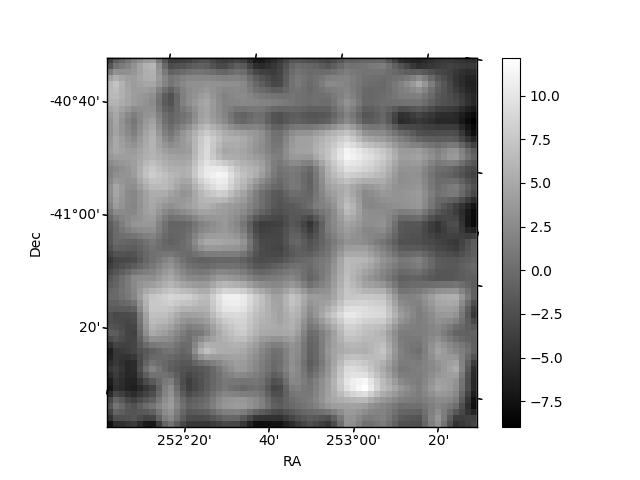
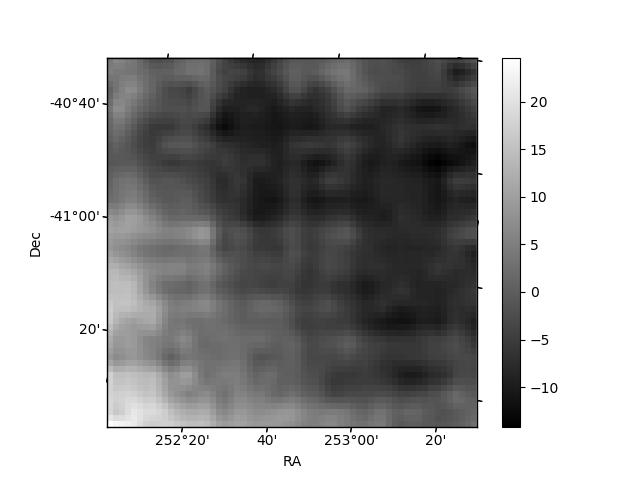
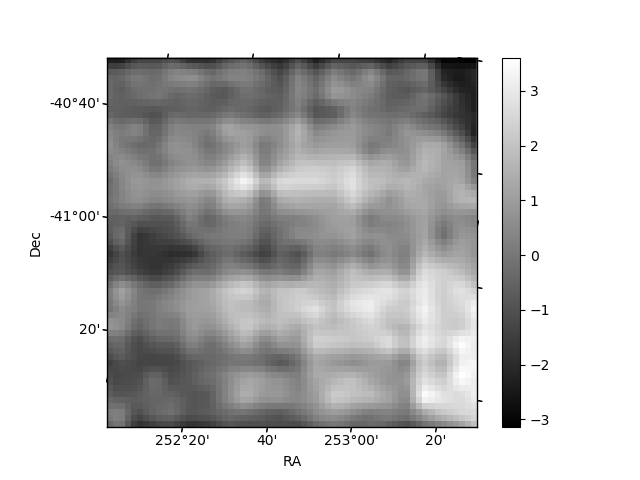
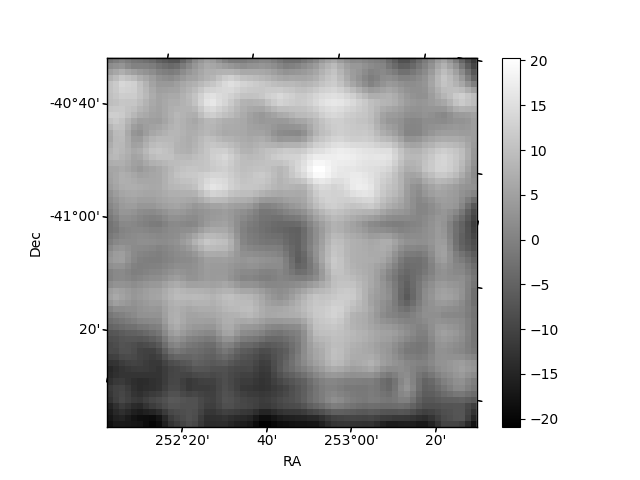
Histogram calculated using DETX and DETY for each event in the final _common_clean file
| Quadrant A | 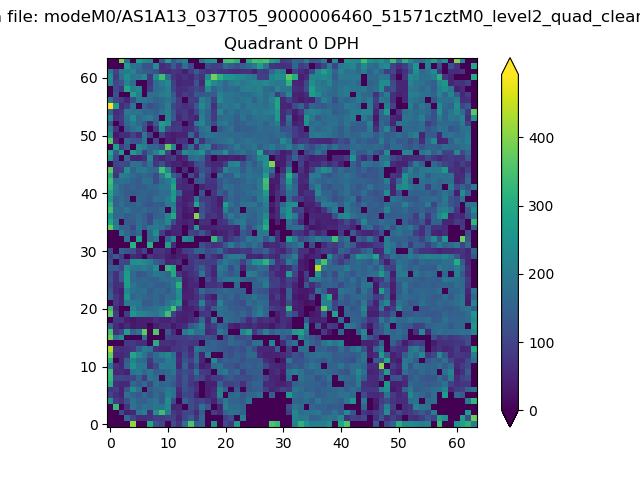 |
 |
Quadrant B |
|---|---|---|---|
| Quadrant D | 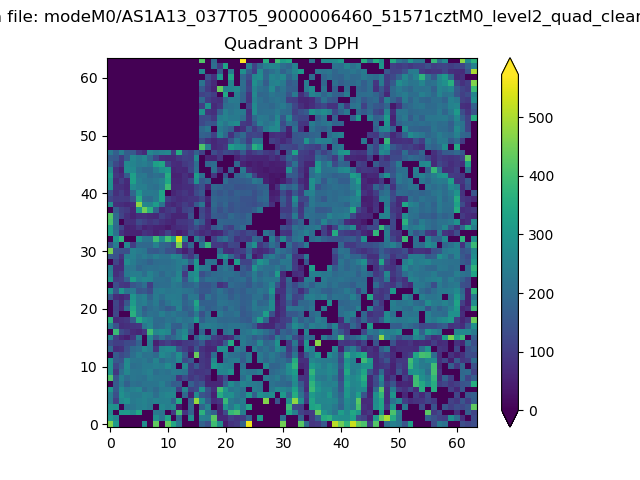 |
 |
Quadrant C |
| Plot type | Count rate plots | Images |
|---|---|---|
| Comparison with Poisson distribution Blue bars denote a histogram of data divided into 1 sec bins. Red curve is a Poisson curve with rate = median count rate of data. |
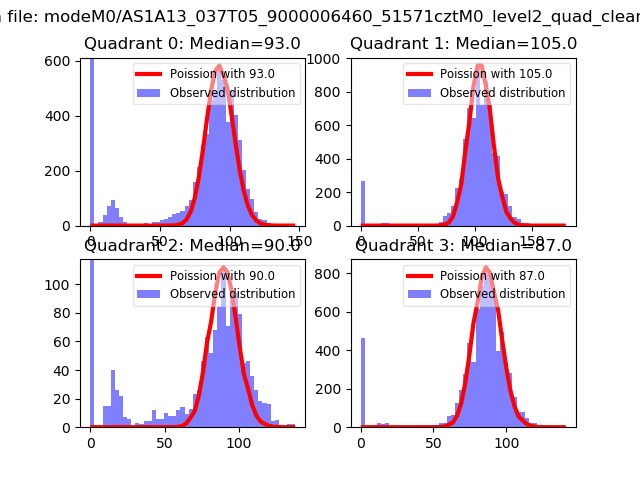 |
 |
| Quadrant-wise count rates Data is divided into 100 sec bins |
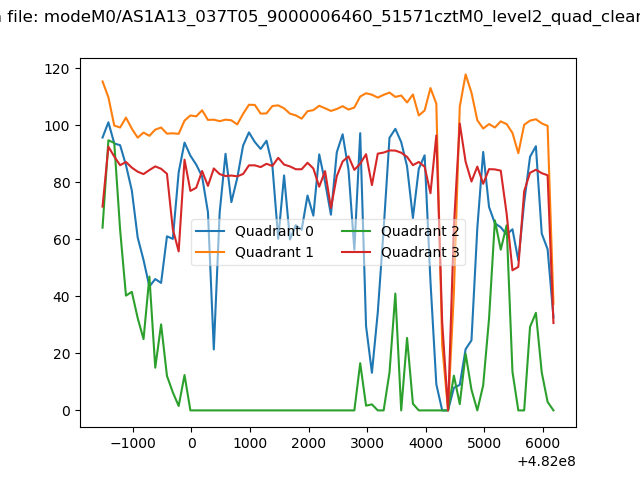 |
|
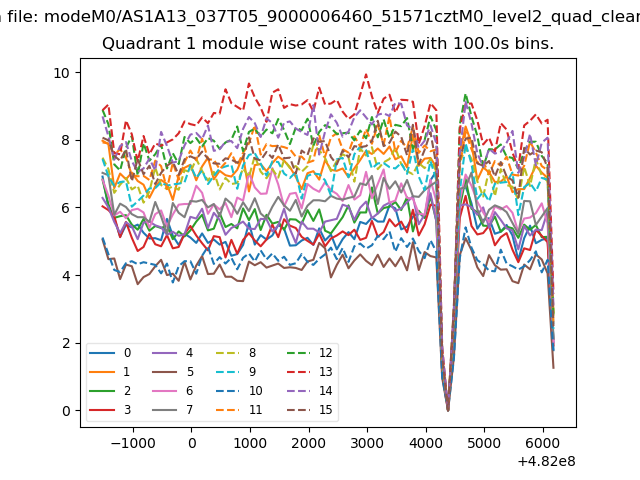
| Module-wise count rates for Quadrant A Data is divided into 100 sec bins |
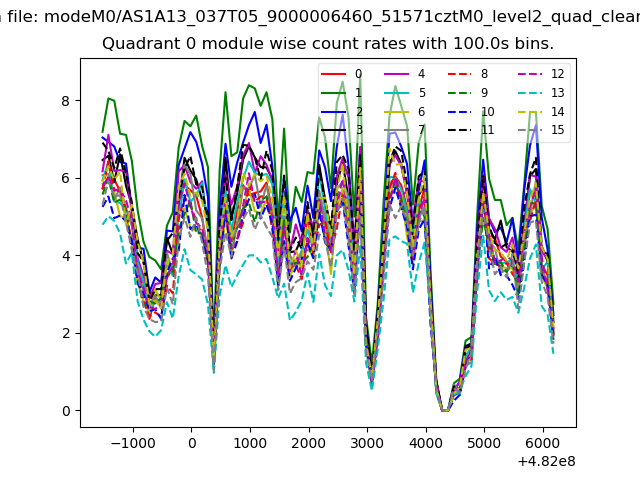 |
 |
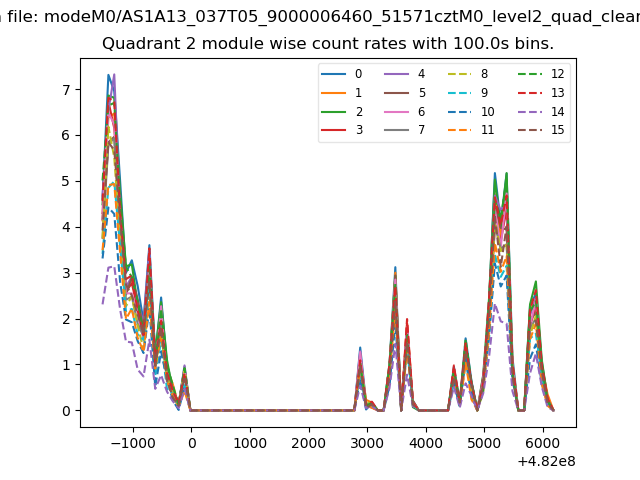
| Module-wise count rates for Quadrant B Data is divided into 100 sec bins |
 |
 |
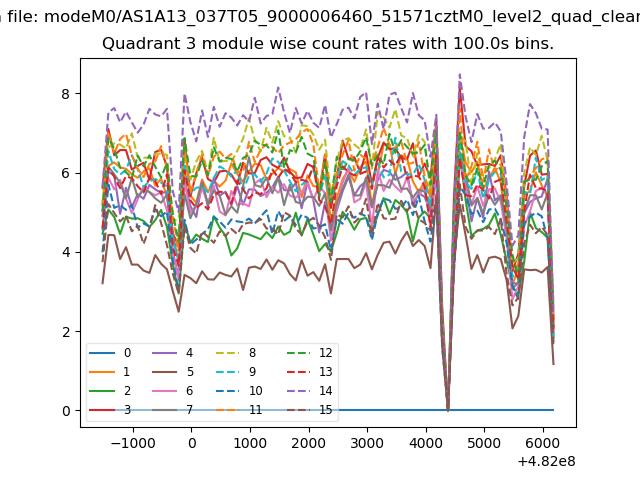
| Module-wise count rates for Quadrant C Data is divided into 100 sec bins |
 |
 |
| Module-wise count rates for Quadrant D Data is divided into 100 sec bins |
 |
 |
| Parameter | Plot |
|---|---|
| CZT HV Monitor | 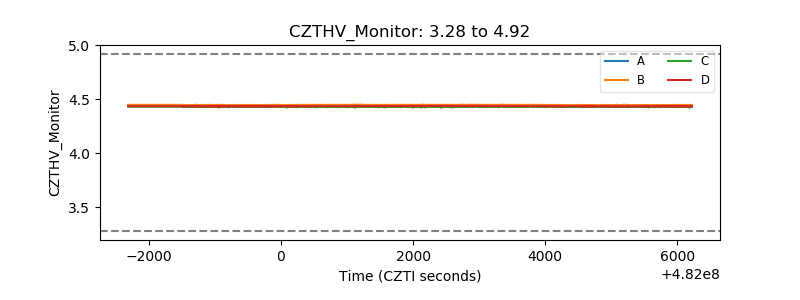 |
| D_VDD | 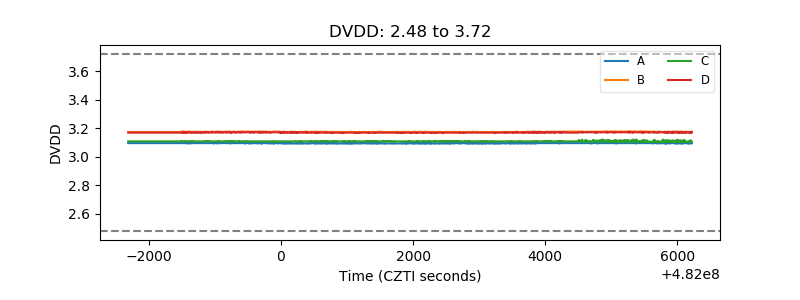 |
| Temperature 1 | 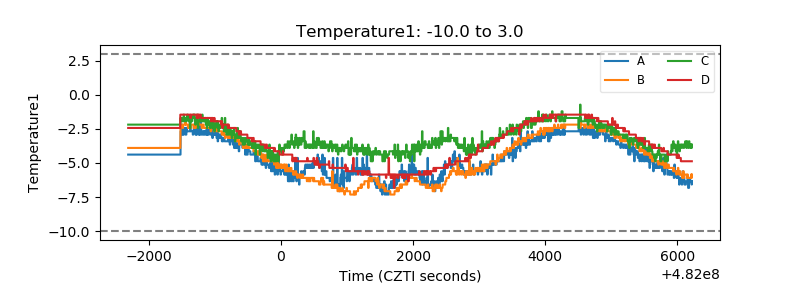 |
| Veto HV Monitor | 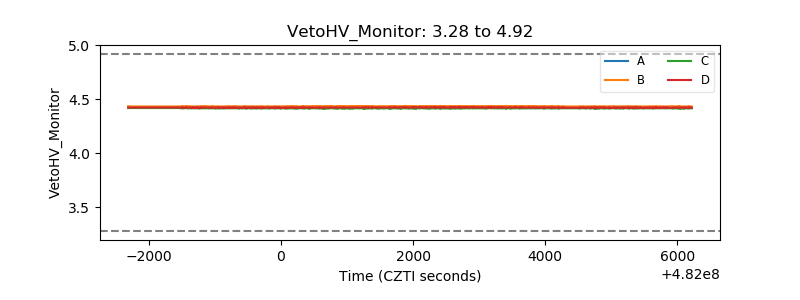 |
| Veto LLD | 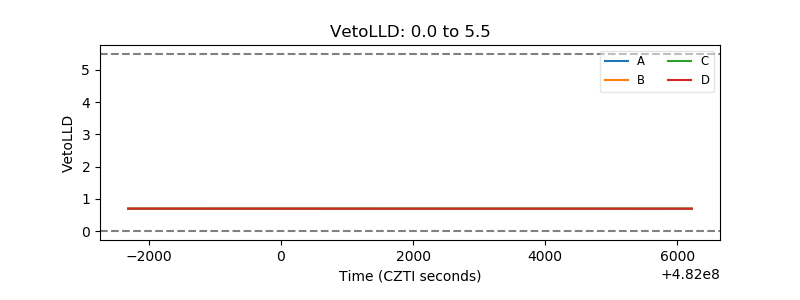 |
| Alpha Counter | 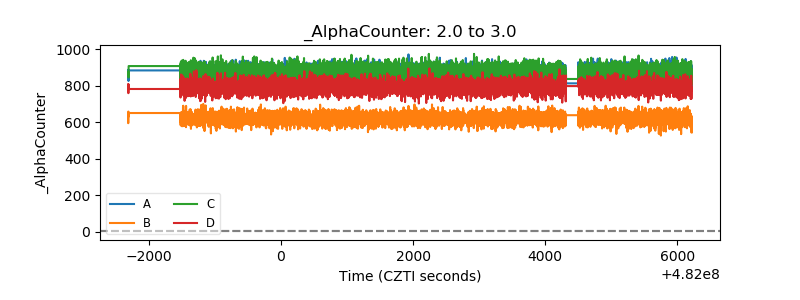 |
| _CPM_Rate | 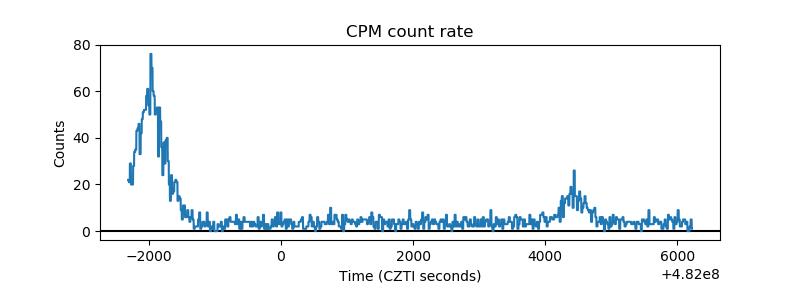 |
| CZT Counter | 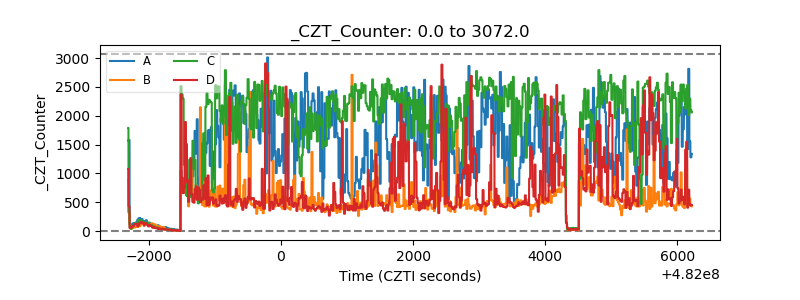 |
| +2.5 Volts monitor | 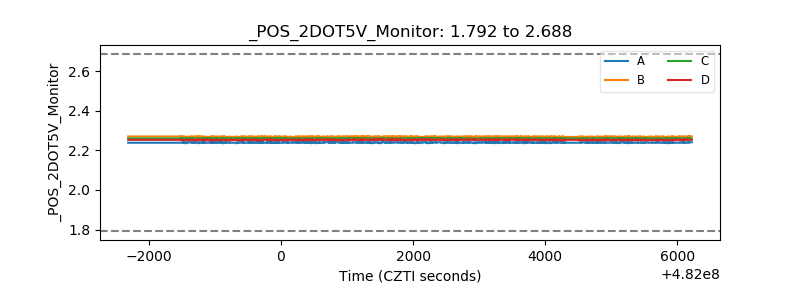 |
| +5 Volts monitor | 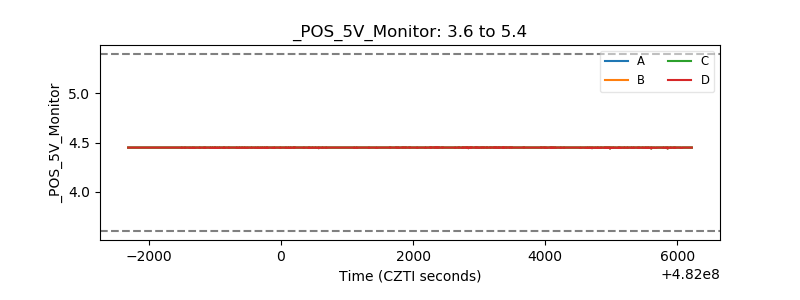 |
| _ROLL_ROT | 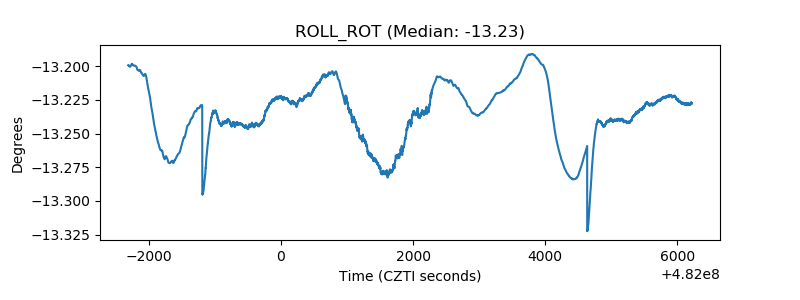 |
| _Roll_DEC | 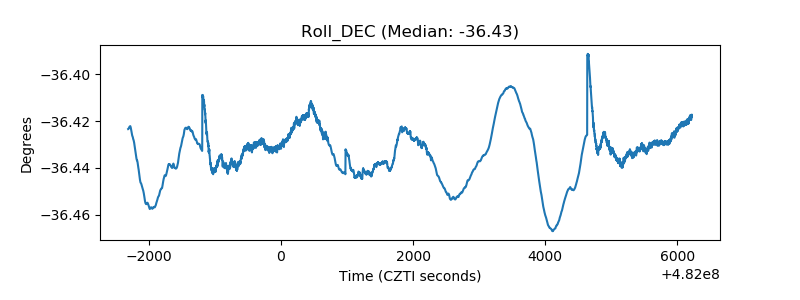 |
| _Roll_RA | 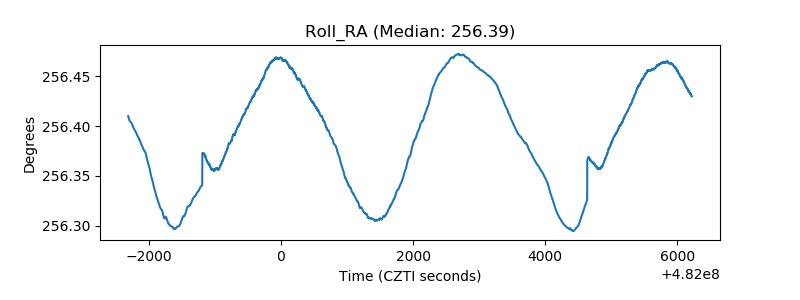 |
| Veto Counter | 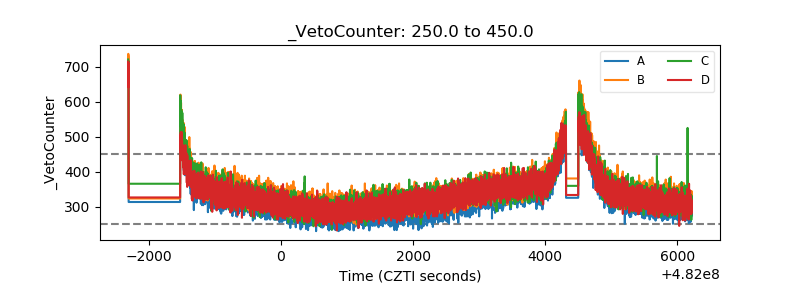 |