| Param | Original file | Final file |
|---|---|---|
| Filename | modeM0/AS1A13_037T05_9000006460_51572cztM0_level2.fits | modeM0/AS1A13_037T05_9000006460_51572cztM0_level2_quad_clean.evt |
| Size (bytes) | 1,092,392,640 | 88,462,080 |
| Size | 1.0 GB | 84.4 MB |
| Events in quadrant A | 12,722,248 | 494,574 |
| Events in quadrant B | 4,207,423 | 797,810 |
| Events in quadrant C | 14,603,973 | 243,691 |
| Events in quadrant D | 8,301,251 | 600,184 |
| Mode M0 | |||
|---|---|---|---|
| Quadrant | BADHDUFLAG | Total packets | Discarded packets |
| A | 0 | 43228 | 0 |
| B | 0 | 17882 | 0 |
| C | 0 | 48639 | 0 |
| D | 0 | 30061 | 1 |
| Mode SS | |||
|---|---|---|---|
| Quadrant | BADHDUFLAG | Total packets | Discarded packets |
| A | 0 | 156 | 0 |
| B | 0 | 156 | 0 |
| C | 0 | 156 | 0 |
| D | 0 | 156 | 0 |
| Quadrant | Total seconds | Saturated seconds | Saturation percentage |
|---|---|---|---|
| A | 7791 | 2982 | 38.274933% |
| B | 7791 | 133 | 1.707098% |
| C | 7792 | 5313 | 68.185318% |
| D | 7791 | 996 | 12.783982% |
Noise dominated data is calculated using 1-second bins in cleaned event files. If a bin has >2000 counts, and if more than 50% of those come from <1% of pixels, then it is considered to be noise-dominated and hence unusable.
| Quadrant | # 1 sec bins | Bins with >0 counts | Bins with >2000 counts | High rate bins dominated by noise | Noise dominated (total time) | Noise dominated (detector-on time) | Marked lightcurve |
|---|---|---|---|---|---|---|---|
| A | 7791 | 7791 | 2335 | 2335 | 29.97% | 29.97% | 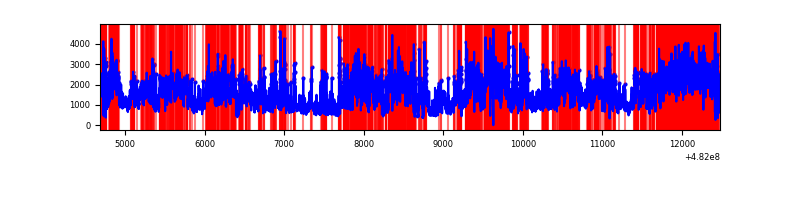 |
| B | 7791 | 7791 | 69 | 69 | 0.89% | 0.89% | 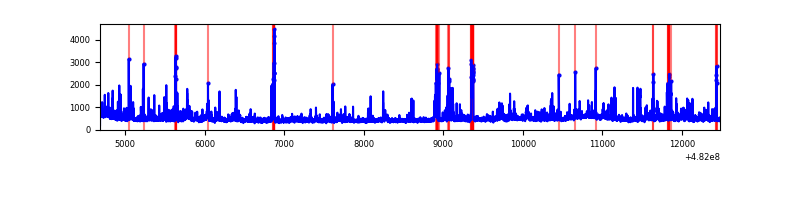 |
| C | 7792 | 7790 | 4256 | 4256 | 54.62% | 54.63% | 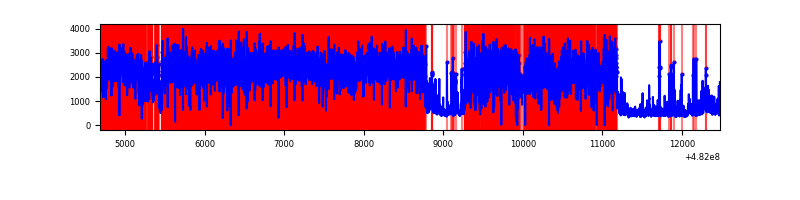 |
| D | 7791 | 7791 | 1003 | 1003 | 12.87% | 12.87% | 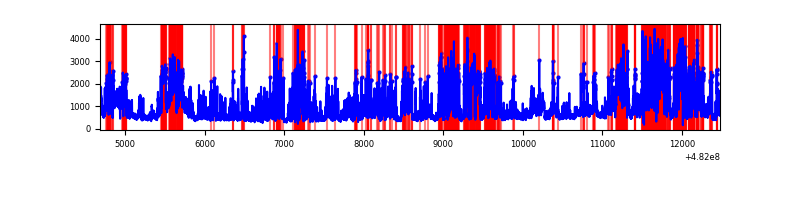 |
Top three noisy pixels from each quadrant. If the there are fewer than three noisy pixels in the level2.evt file, extra rows are filled as -1
| Pixel properties | Quadrant properties | ||||||
|---|---|---|---|---|---|---|---|
| Quadrant | DetID | PixID | Counts | Sigma | Mean | Median | Sigma |
| A | 7 | 64 | 2992143 | 16967.56 | 713 | 700 | 176.3 |
| A | 12 | 3 | 2945355 | 16702.18 | 713 | 700 | 176.3 |
| A | 12 | 250 | 1747639 | 9908.7 | 713 | 700 | 176.3 |
| B | 8 | 128 | 182078 | 1007.94 | 836 | 807 | 179.8 |
| B | 0 | 171 | 138607 | 766.23 | 836 | 807 | 179.8 |
| B | 7 | 252 | 92728 | 511.12 | 836 | 807 | 179.8 |
| C | 15 | 198 | 12272792 | 91547.91 | 478 | 472 | 134.1 |
| C | 0 | 177 | 141518 | 1052.16 | 478 | 472 | 134.1 |
| C | 13 | 3 | 121435 | 902.35 | 478 | 472 | 134.1 |
| D | 8 | 176 | 3688396 | 16782.74 | 774 | 747 | 219.7 |
| D | 12 | 6 | 621085 | 2823.2 | 774 | 747 | 219.7 |
| D | 3 | 12 | 247921 | 1124.91 | 774 | 747 | 219.7 |
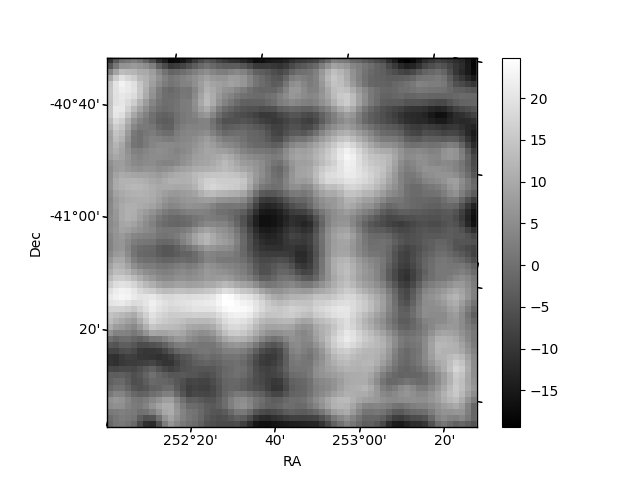
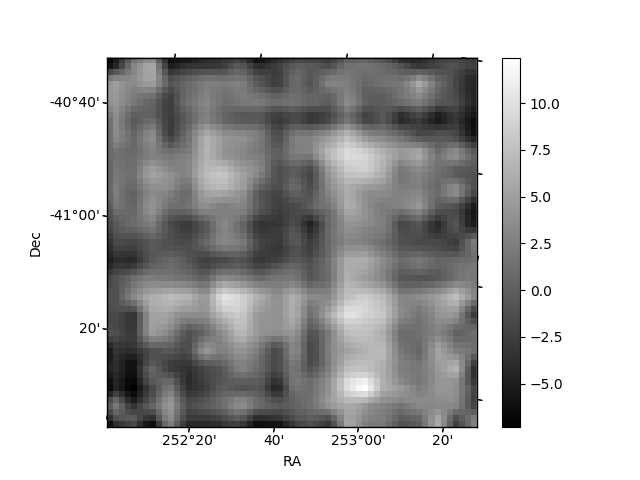
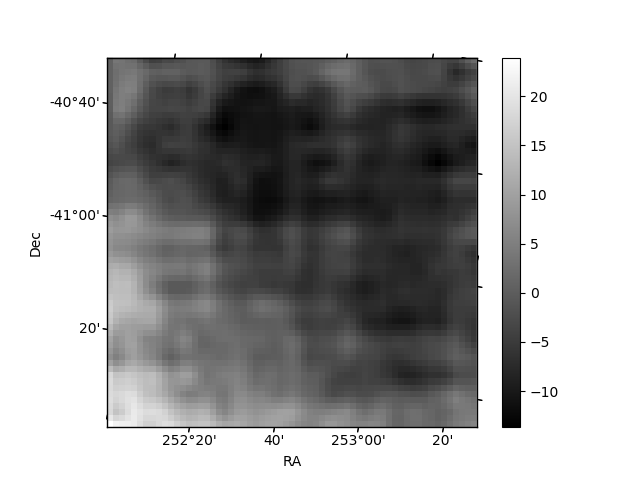
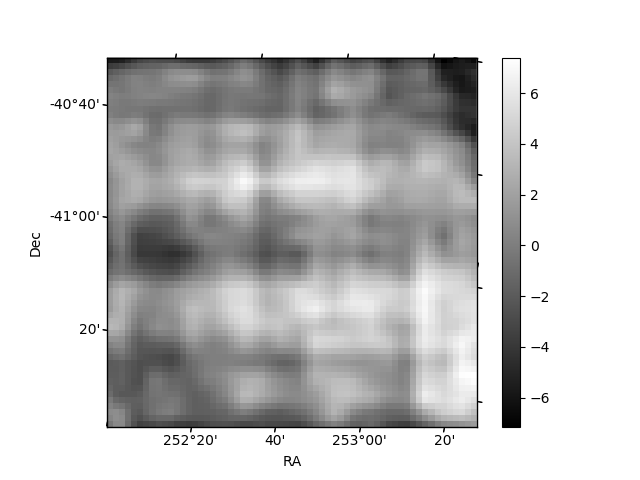
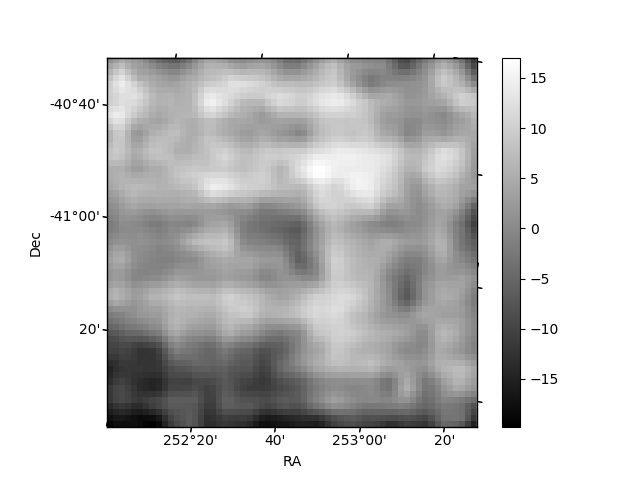
Histogram calculated using DETX and DETY for each event in the final _common_clean file
| Quadrant A | 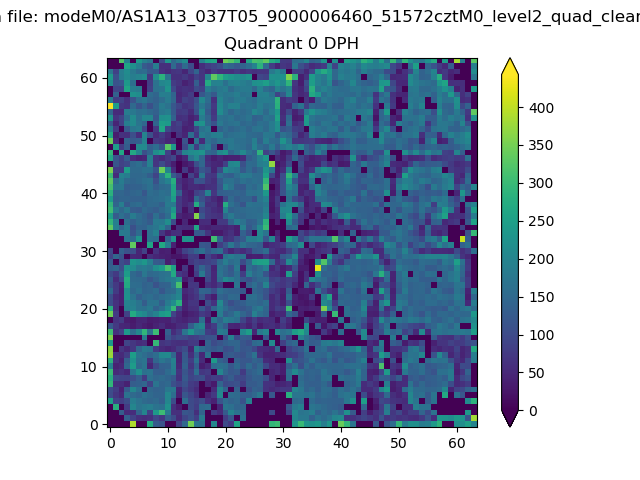 |
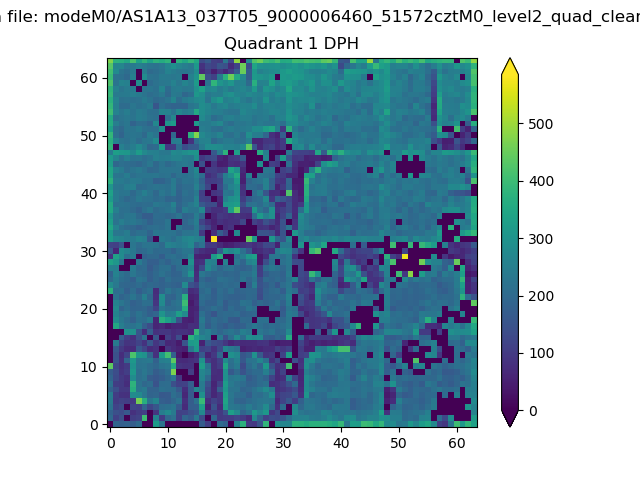 |
Quadrant B |
|---|---|---|---|
| Quadrant D |  |
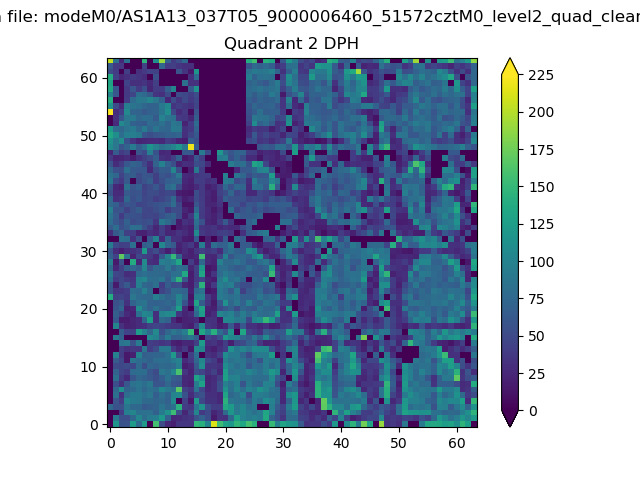 |
Quadrant C |
| Plot type | Count rate plots | Images |
|---|---|---|
| Comparison with Poisson distribution Blue bars denote a histogram of data divided into 1 sec bins. Red curve is a Poisson curve with rate = median count rate of data. |
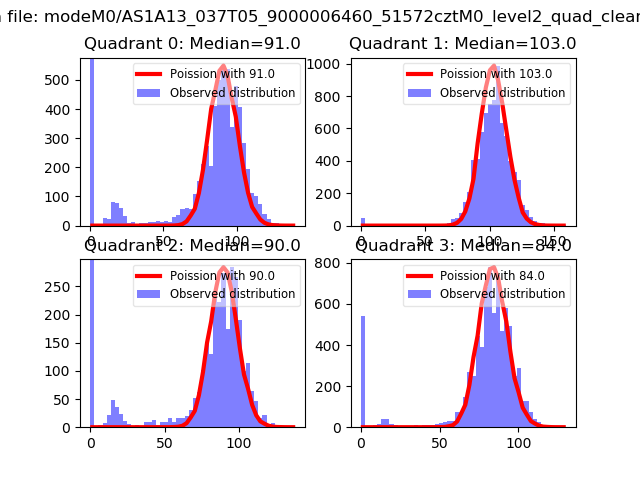 |
 |
| Quadrant-wise count rates Data is divided into 100 sec bins |
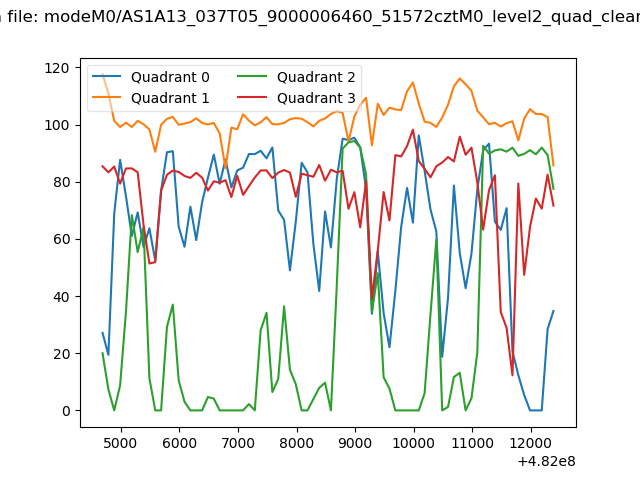 |
|
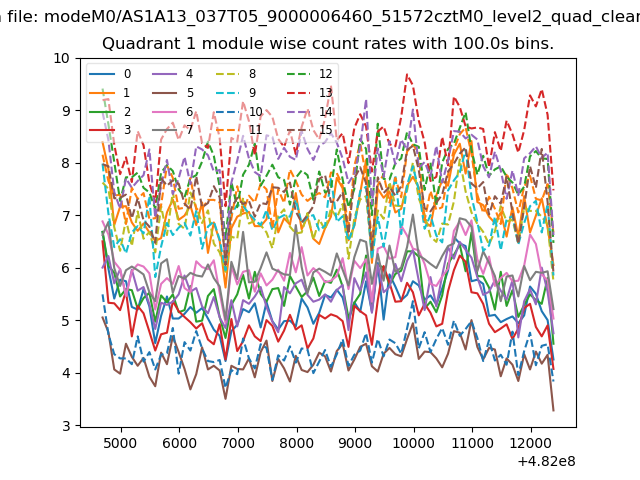
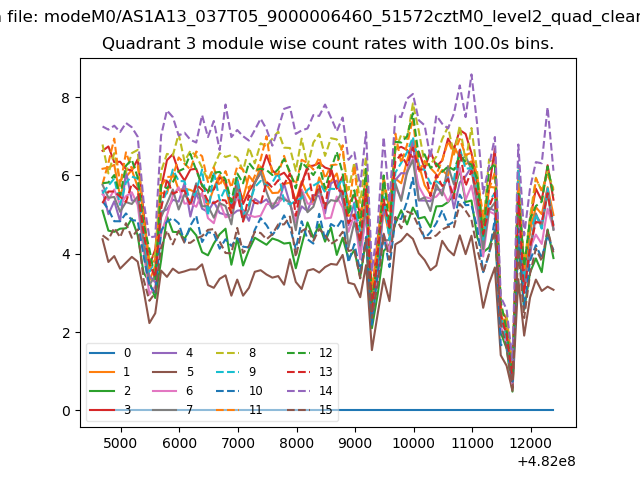
| Module-wise count rates for Quadrant A Data is divided into 100 sec bins |
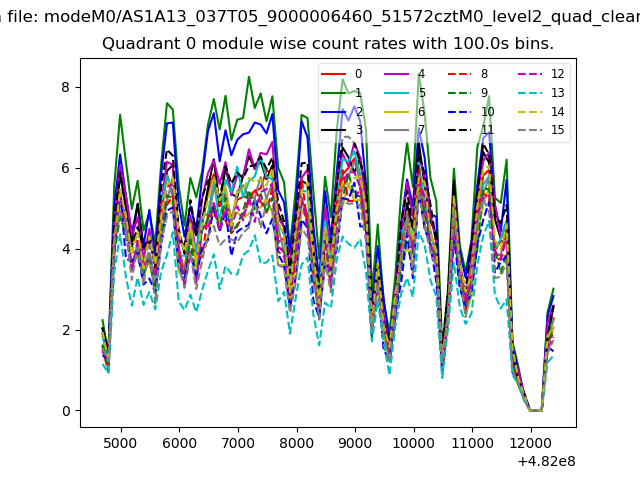 |
 |
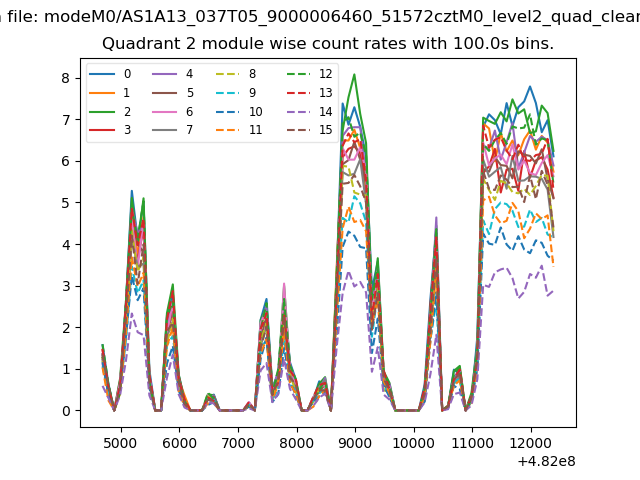
| Module-wise count rates for Quadrant B Data is divided into 100 sec bins |
 |
 |
| Module-wise count rates for Quadrant C Data is divided into 100 sec bins |
 |
 |
| Module-wise count rates for Quadrant D Data is divided into 100 sec bins |
 |
 |
| Parameter | Plot |
|---|---|
| CZT HV Monitor | 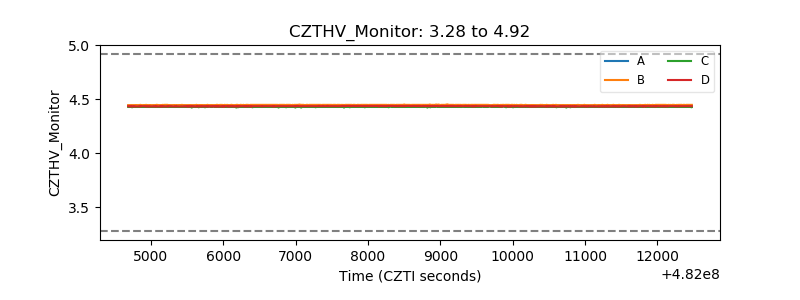 |
| D_VDD | 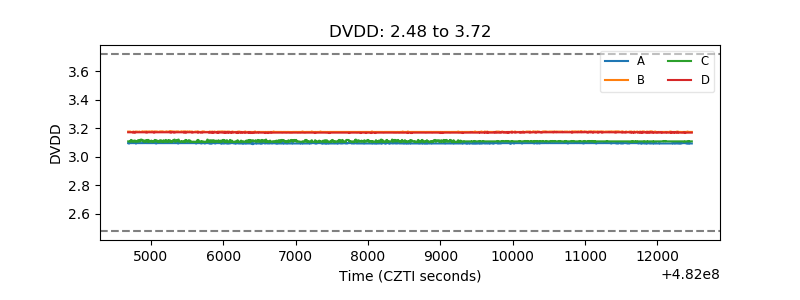 |
| Temperature 1 | 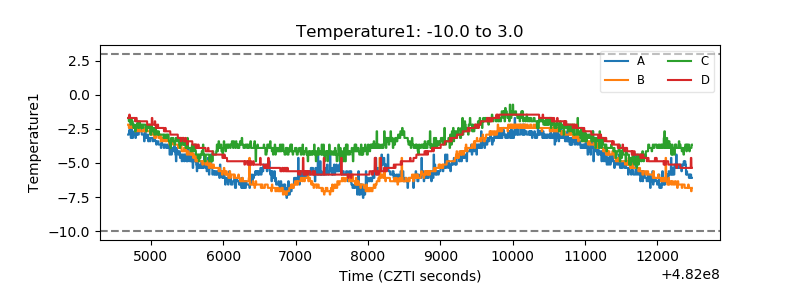 |
| Veto HV Monitor | 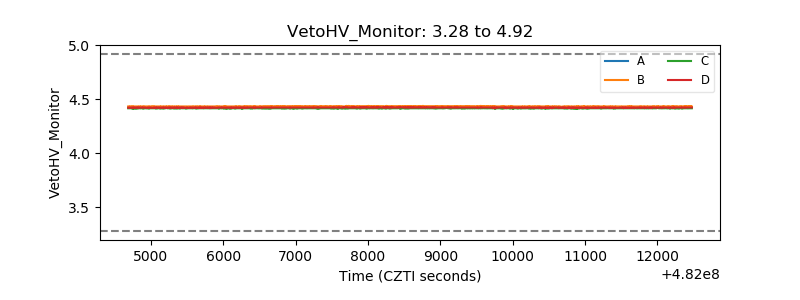 |
| Veto LLD | 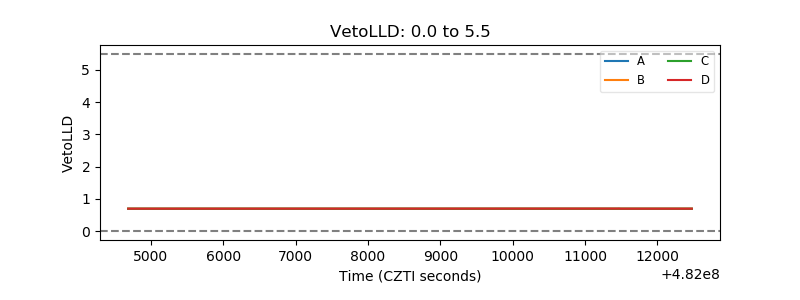 |
| Alpha Counter | 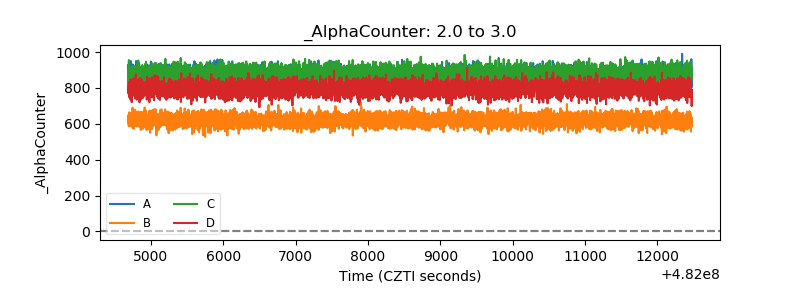 |
| _CPM_Rate | 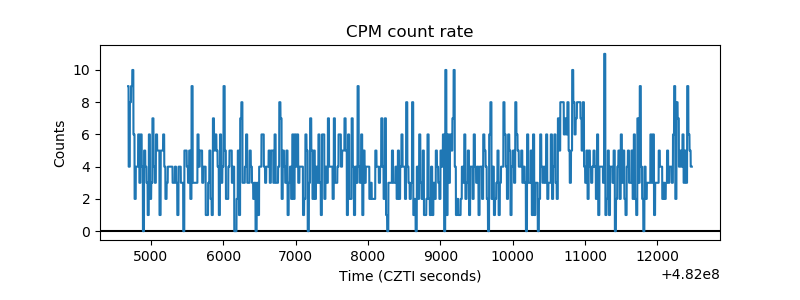 |
| CZT Counter | 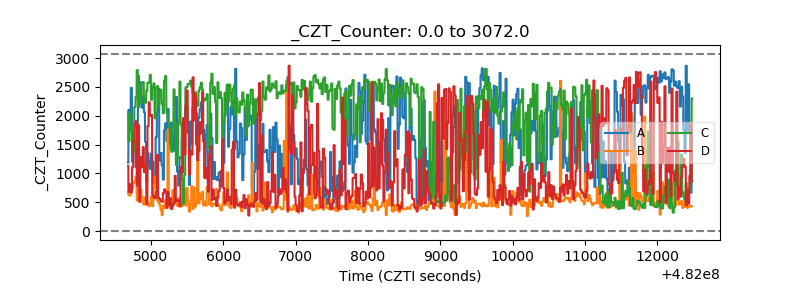 |
| +2.5 Volts monitor | 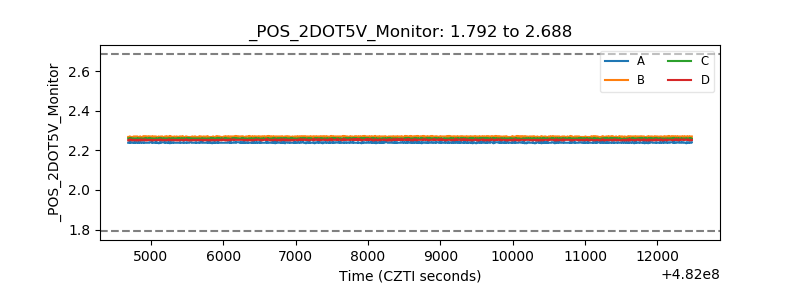 |
| +5 Volts monitor | 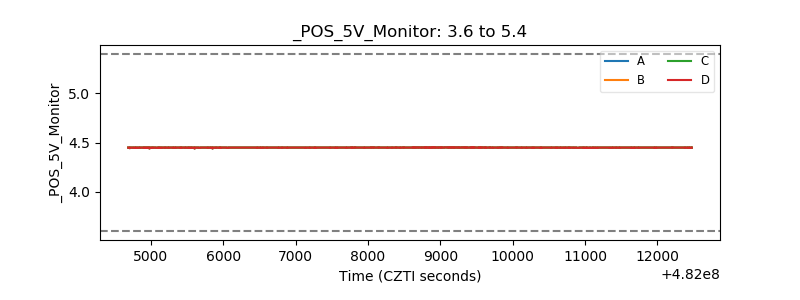 |
| _ROLL_ROT | 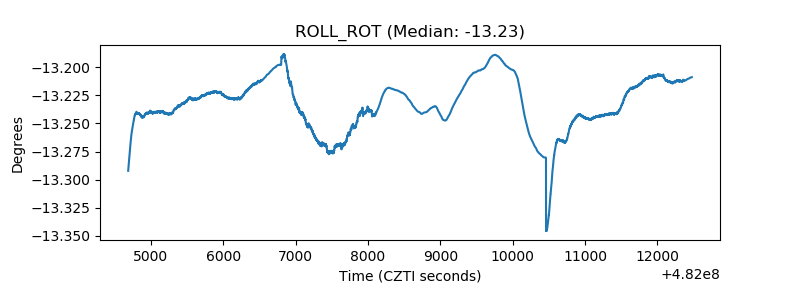 |
| _Roll_DEC | 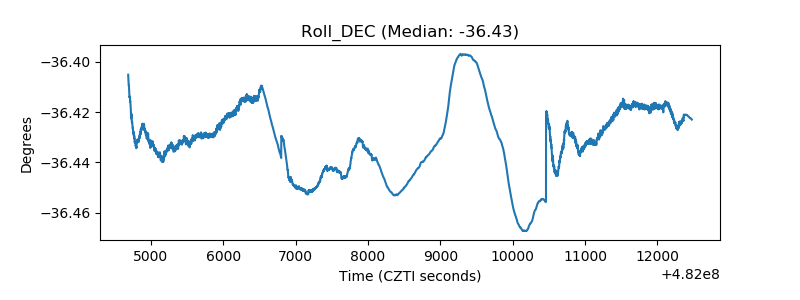 |
| _Roll_RA | 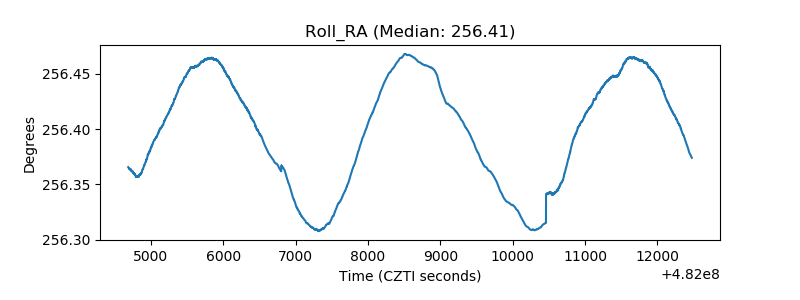 |
| Veto Counter | 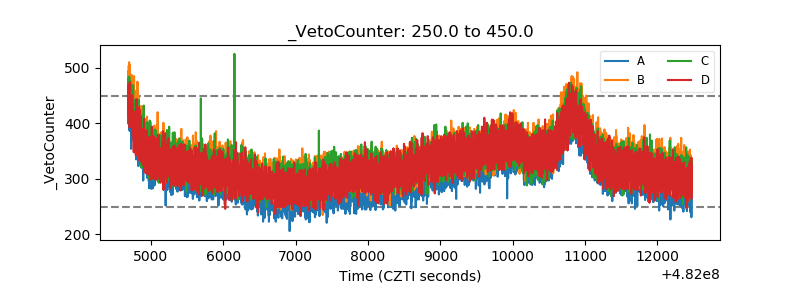 |