| Param | Original file | Final file |
|---|---|---|
| Filename | modeM0/AS1A13_037T05_9000006460_51573cztM0_level2.fits | modeM0/AS1A13_037T05_9000006460_51573cztM0_level2_quad_clean.evt |
| Size (bytes) | 873,552,960 | 95,616,000 |
| Size | 833.1 MB | 91.2 MB |
| Events in quadrant A | 11,993,596 | 461,509 |
| Events in quadrant B | 4,063,425 | 765,447 |
| Events in quadrant C | 8,793,502 | 568,342 |
| Events in quadrant D | 6,904,774 | 576,616 |
| Mode M0 | |||
|---|---|---|---|
| Quadrant | BADHDUFLAG | Total packets | Discarded packets |
| A | 0 | 40898 | 0 |
| B | 0 | 17306 | 0 |
| C | 0 | 31332 | 0 |
| D | 0 | 25642 | 0 |
| Mode SS | |||
|---|---|---|---|
| Quadrant | BADHDUFLAG | Total packets | Discarded packets |
| A | 0 | 150 | 0 |
| B | 0 | 150 | 0 |
| C | 0 | 150 | 0 |
| D | 0 | 150 | 0 |
| Quadrant | Total seconds | Saturated seconds | Saturation percentage |
|---|---|---|---|
| A | 7515 | 3003 | 39.960080% |
| B | 7516 | 104 | 1.383715% |
| C | 7516 | 1450 | 19.292177% |
| D | 7516 | 809 | 10.763704% |
Noise dominated data is calculated using 1-second bins in cleaned event files. If a bin has >2000 counts, and if more than 50% of those come from <1% of pixels, then it is considered to be noise-dominated and hence unusable.
| Quadrant | # 1 sec bins | Bins with >0 counts | Bins with >2000 counts | High rate bins dominated by noise | Noise dominated (total time) | Noise dominated (detector-on time) | Marked lightcurve |
|---|---|---|---|---|---|---|---|
| A | 7515 | 7515 | 2362 | 2362 | 31.43% | 31.43% | 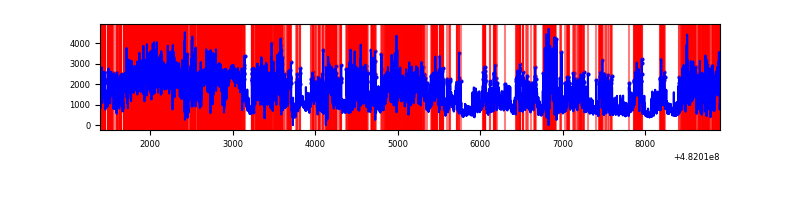 |
| B | 7516 | 7516 | 52 | 52 | 0.69% | 0.69% | 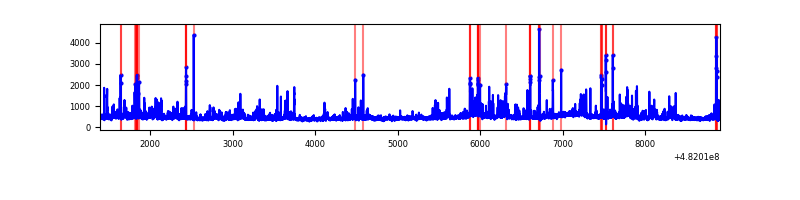 |
| C | 7516 | 7516 | 1382 | 1382 | 18.39% | 18.39% | 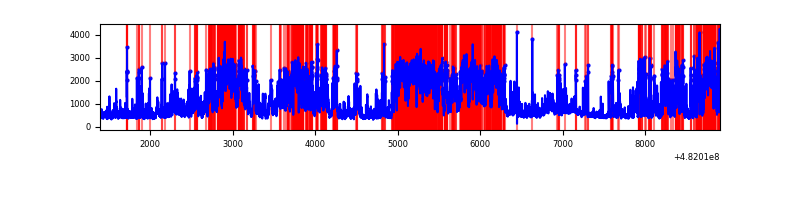 |
| D | 7516 | 7516 | 836 | 836 | 11.12% | 11.12% | 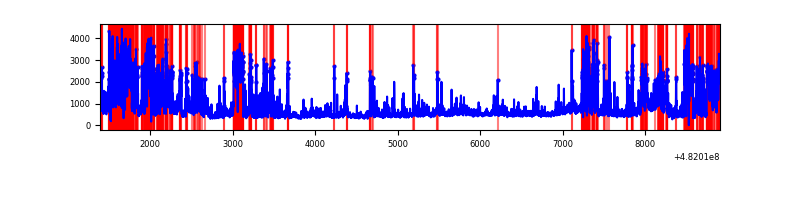 |
Top three noisy pixels from each quadrant. If the there are fewer than three noisy pixels in the level2.evt file, extra rows are filled as -1
| Pixel properties | Quadrant properties | ||||||
|---|---|---|---|---|---|---|---|
| Quadrant | DetID | PixID | Counts | Sigma | Mean | Median | Sigma |
| A | 7 | 64 | 3420762 | 20747.52 | 670 | 654 | 164.8 |
| A | 12 | 250 | 2454683 | 14886.96 | 670 | 654 | 164.8 |
| A | 12 | 3 | 2147868 | 13025.72 | 670 | 654 | 164.8 |
| B | 0 | 171 | 182265 | 1061.4 | 795 | 767 | 171.0 |
| B | 10 | 44 | 132295 | 769.17 | 795 | 767 | 171.0 |
| B | 4 | 174 | 112201 | 651.66 | 795 | 767 | 171.0 |
| C | 15 | 198 | 4923780 | 24158.03 | 731 | 726 | 203.8 |
| C | 13 | 3 | 383420 | 1877.93 | 731 | 726 | 203.8 |
| C | 0 | 177 | 192581 | 941.46 | 731 | 726 | 203.8 |
| D | 8 | 176 | 1327787 | 6414.88 | 737 | 709 | 206.9 |
| D | 12 | 6 | 1055263 | 5097.54 | 737 | 709 | 206.9 |
| D | 7 | 126 | 452493 | 2183.85 | 737 | 709 | 206.9 |
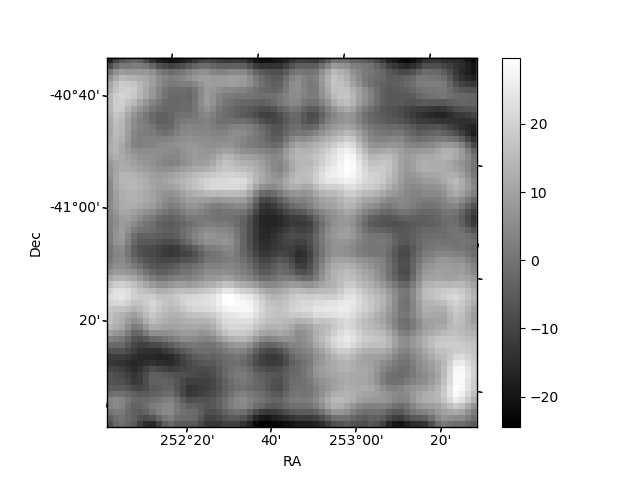
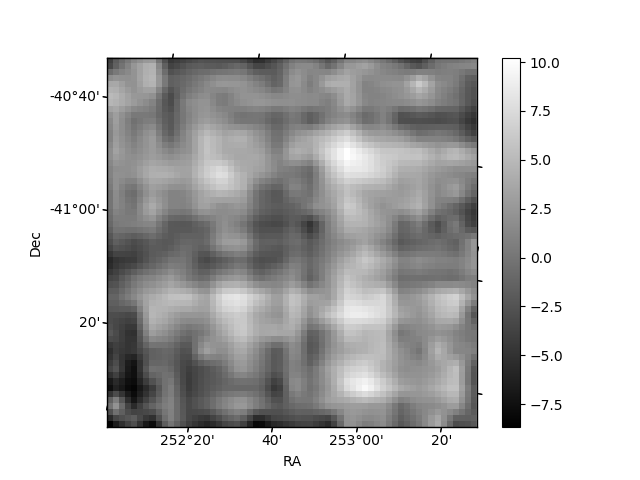
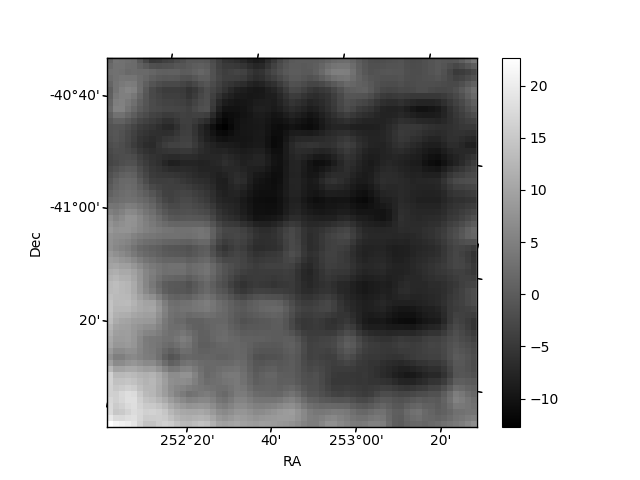
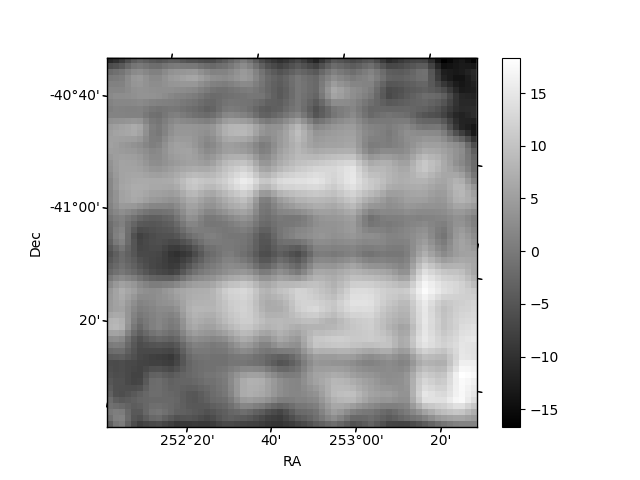
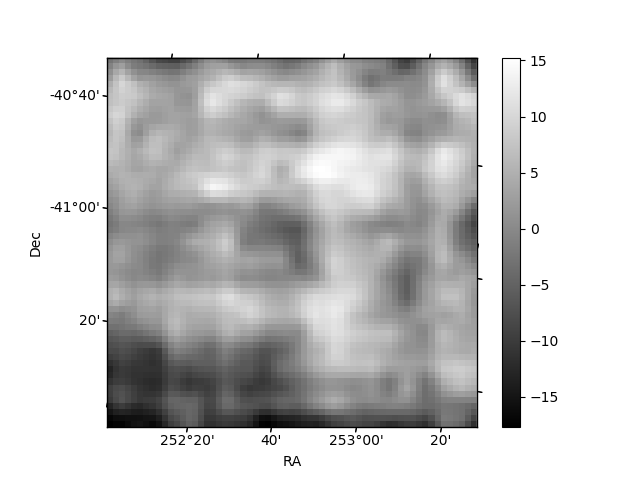
Histogram calculated using DETX and DETY for each event in the final _common_clean file
| Quadrant A | 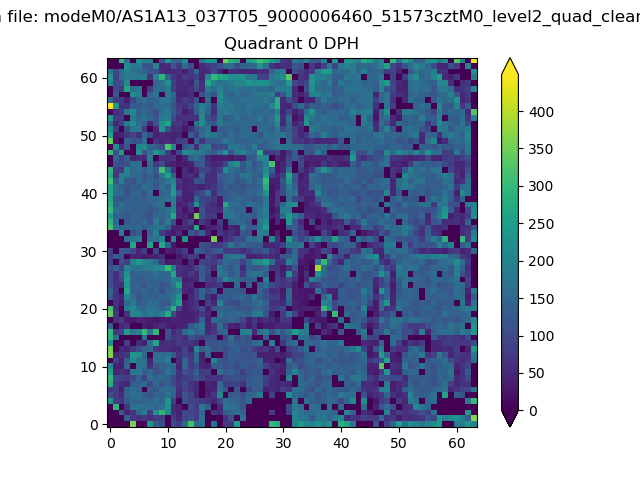 |
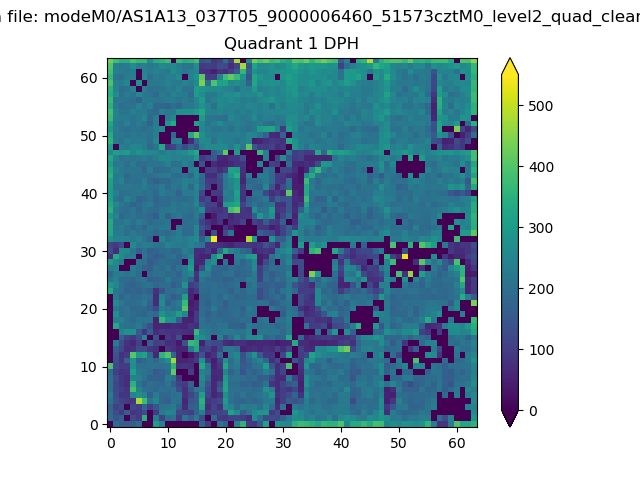 |
Quadrant B |
|---|---|---|---|
| Quadrant D | 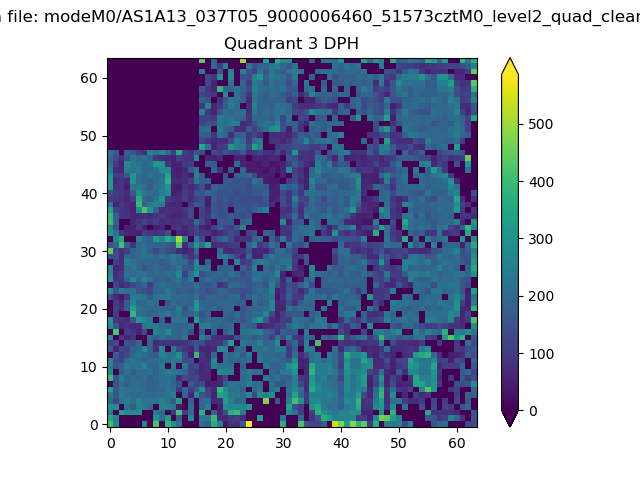 |
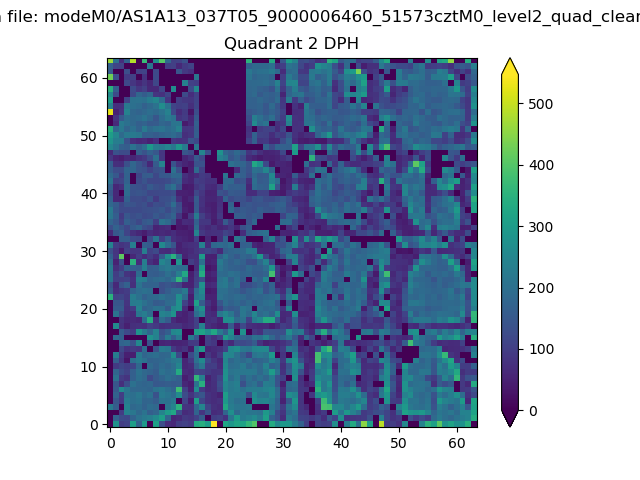 |
Quadrant C |
| Plot type | Count rate plots | Images |
|---|---|---|
| Comparison with Poisson distribution Blue bars denote a histogram of data divided into 1 sec bins. Red curve is a Poisson curve with rate = median count rate of data. |
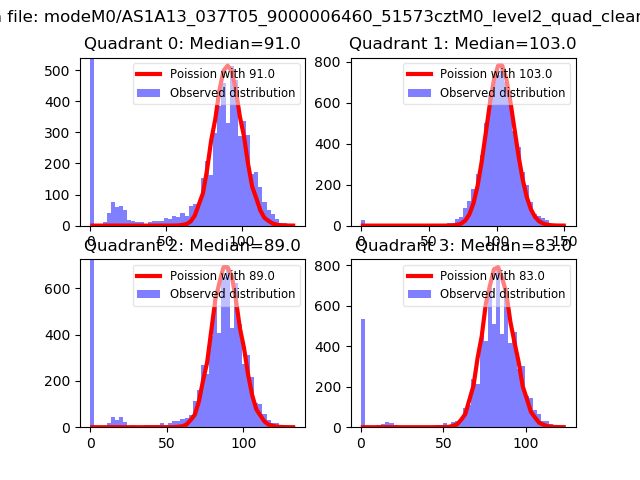 |
 |
| Quadrant-wise count rates Data is divided into 100 sec bins |
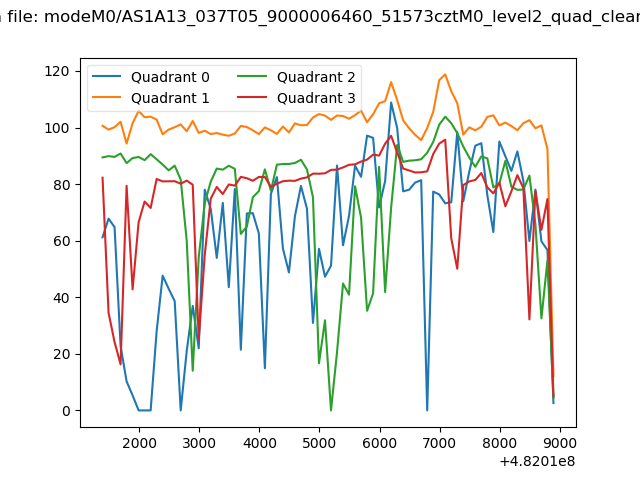 |
|
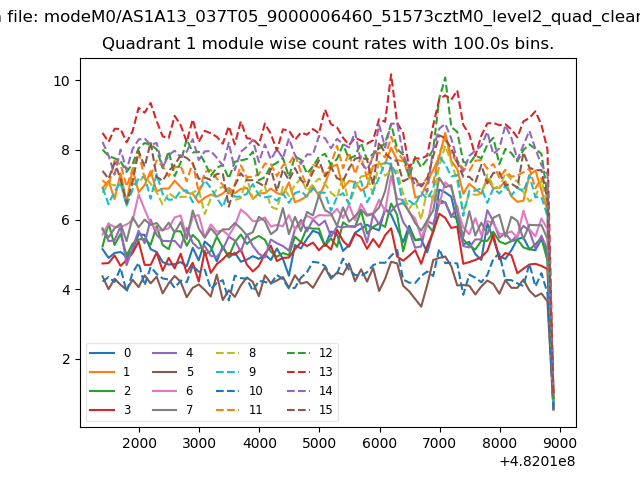
| Module-wise count rates for Quadrant A Data is divided into 100 sec bins |
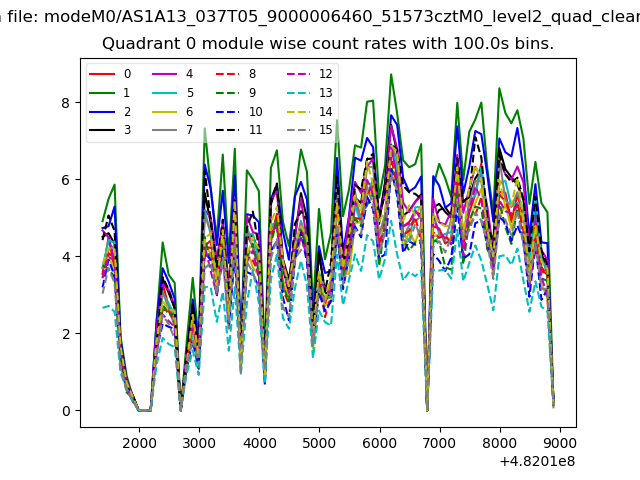 |
 |
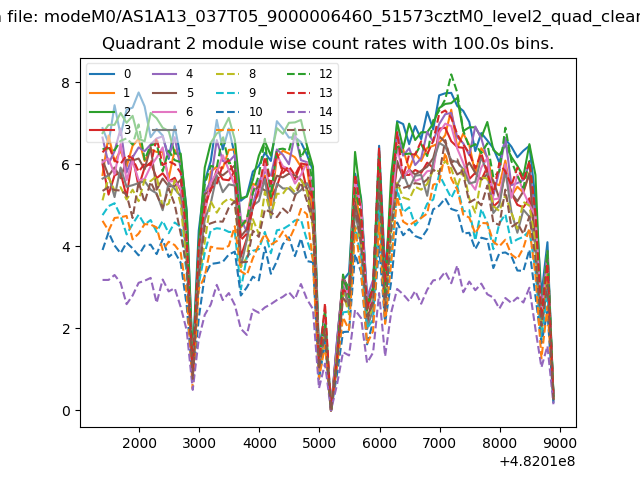
| Module-wise count rates for Quadrant B Data is divided into 100 sec bins |
 |
 |
| Module-wise count rates for Quadrant C Data is divided into 100 sec bins |
 |
 |
| Module-wise count rates for Quadrant D Data is divided into 100 sec bins |
 |
 |
| Parameter | Plot |
|---|---|
| CZT HV Monitor | 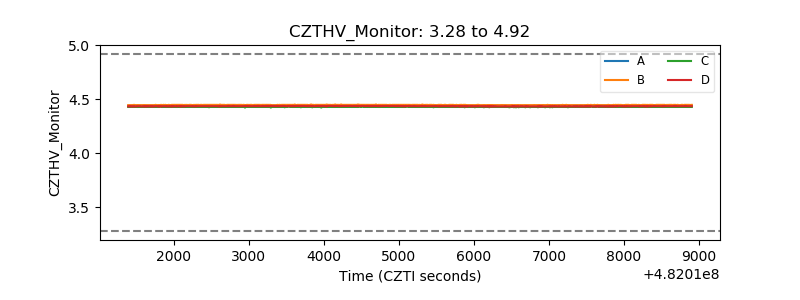 |
| D_VDD | 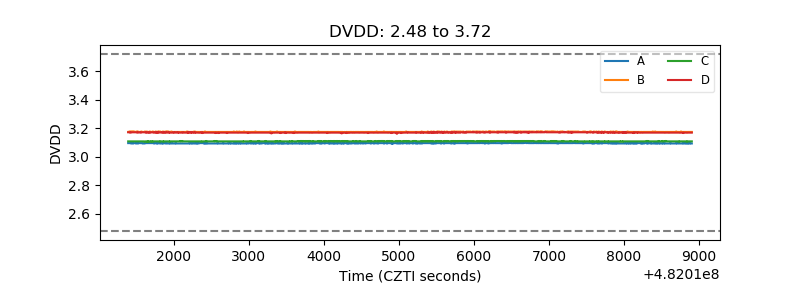 |
| Temperature 1 | 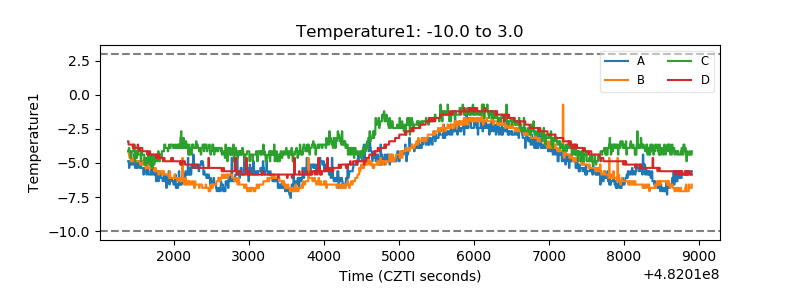 |
| Veto HV Monitor | 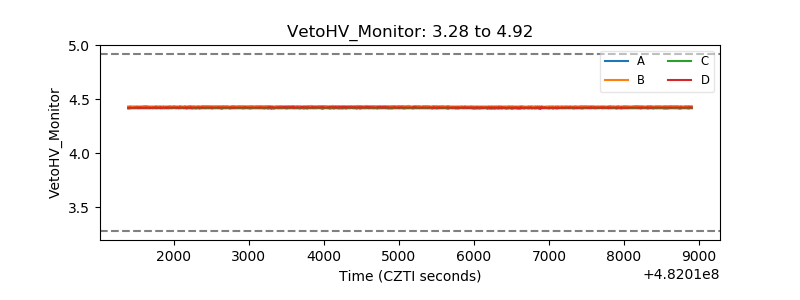 |
| Veto LLD | 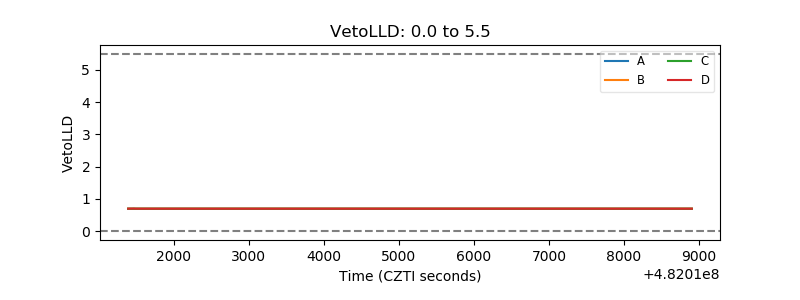 |
| Alpha Counter | 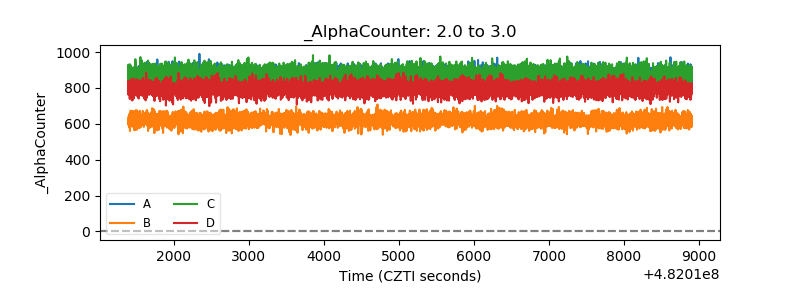 |
| _CPM_Rate | 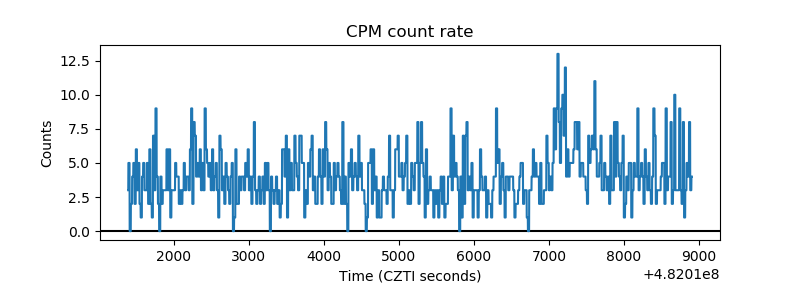 |
| CZT Counter | 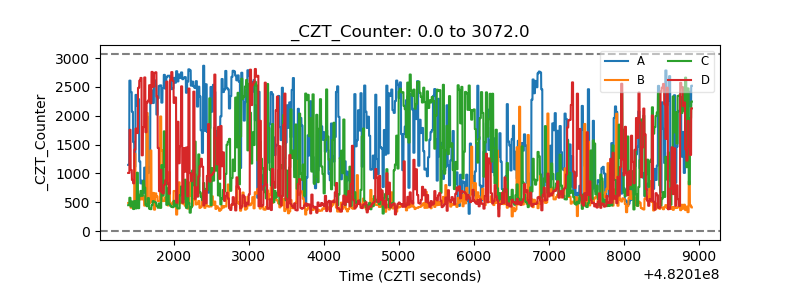 |
| +2.5 Volts monitor | 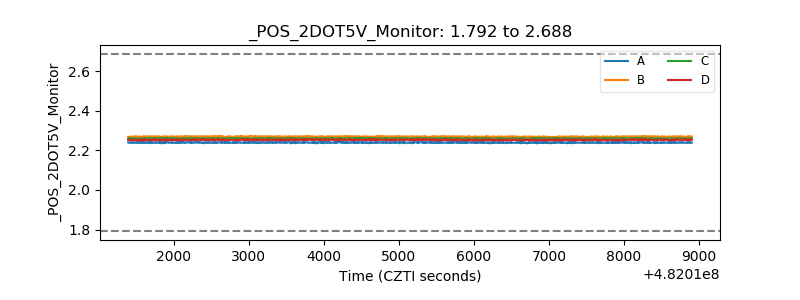 |
| +5 Volts monitor | 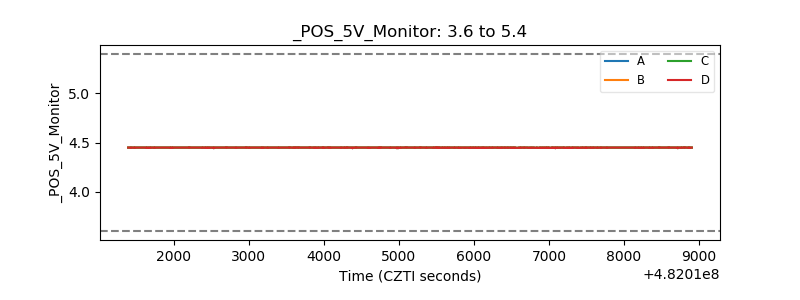 |
| _ROLL_ROT | 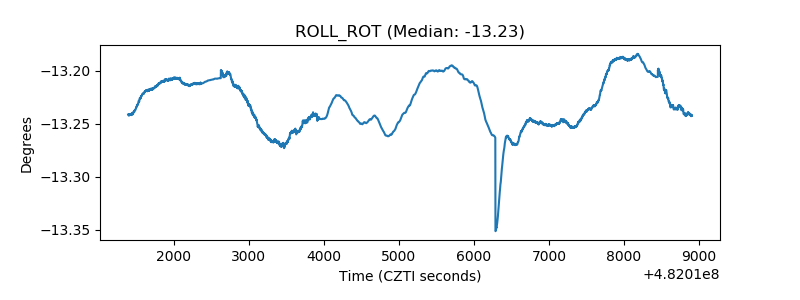 |
| _Roll_DEC | 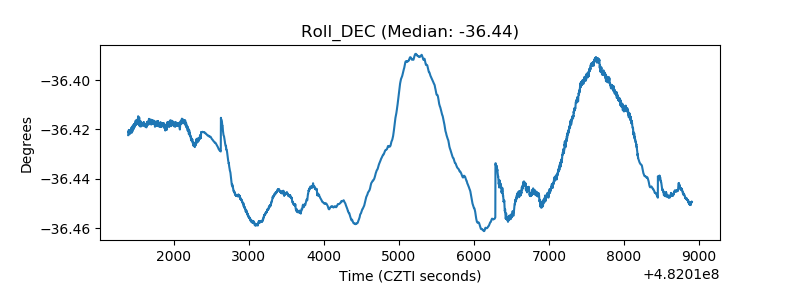 |
| _Roll_RA | 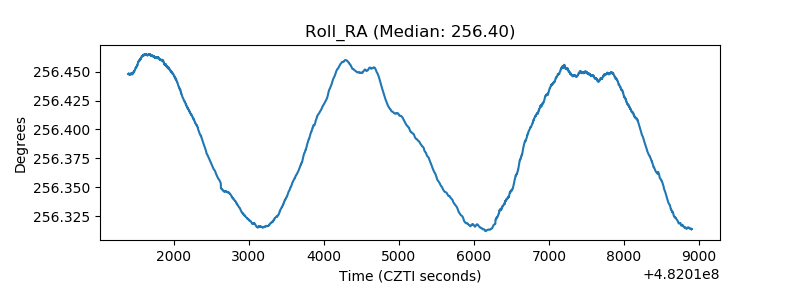 |
| Veto Counter | 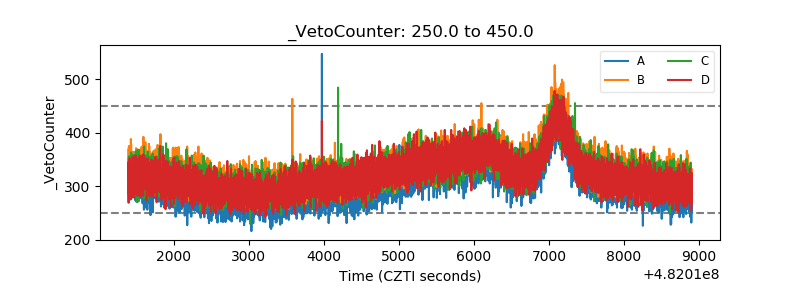 |