| Param | Original file | Final file |
|---|---|---|
| Filename | modeM0/AS1A13_037T05_9000006460_51579cztM0_level2.fits | modeM0/AS1A13_037T05_9000006460_51579cztM0_level2_quad_clean.evt |
| Size (bytes) | 904,979,520 | 122,558,400 |
| Size | 863.1 MB | 116.9 MB |
| Events in quadrant A | 12,322,932 | 657,453 |
| Events in quadrant B | 4,800,885 | 918,539 |
| Events in quadrant C | 8,201,217 | 776,758 |
| Events in quadrant D | 7,471,321 | 725,969 |
| Mode M0 | |||
|---|---|---|---|
| Quadrant | BADHDUFLAG | Total packets | Discarded packets |
| A | 0 | 44811 | 1852 |
| B | 0 | 21379 | 570 |
| C | 0 | 31526 | 804 |
| D | 0 | 29353 | 768 |
| Mode SS | |||
|---|---|---|---|
| Quadrant | BADHDUFLAG | Total packets | Discarded packets |
| A | 0 | 189 | 5 |
| B | 0 | 189 | 6 |
| C | 0 | 190 | 4 |
| D | 0 | 190 | 4 |
| Quadrant | Total seconds | Saturated seconds | Saturation percentage |
|---|---|---|---|
| A | 9041 | 2374 | 26.258157% |
| B | 9126 | 192 | 2.103879% |
| C | 9103 | 781 | 8.579589% |
| D | 9115 | 631 | 6.922655% |
Noise dominated data is calculated using 1-second bins in cleaned event files. If a bin has >2000 counts, and if more than 50% of those come from <1% of pixels, then it is considered to be noise-dominated and hence unusable.
| Quadrant | # 1 sec bins | Bins with >0 counts | Bins with >2000 counts | High rate bins dominated by noise | Noise dominated (total time) | Noise dominated (detector-on time) | Marked lightcurve |
|---|---|---|---|---|---|---|---|
| A | 9322 | 9112 | 1576 | 1576 | 16.91% | 17.30% | 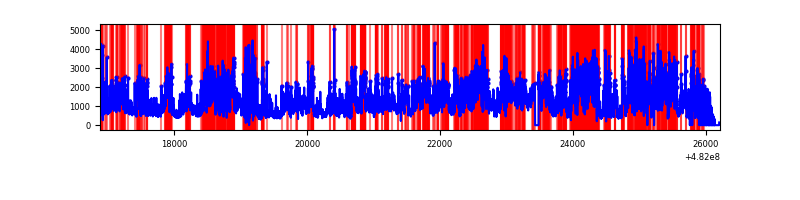 |
| B | 9329 | 9184 | 37 | 37 | 0.40% | 0.40% | 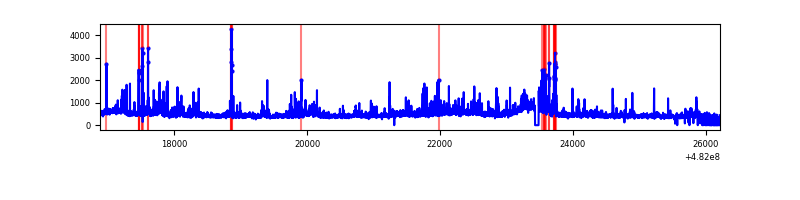 |
| C | 9333 | 9168 | 736 | 736 | 7.89% | 8.03% | 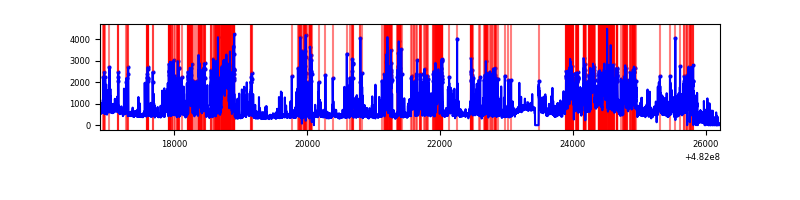 |
| D | 9310 | 9167 | 613 | 613 | 6.58% | 6.69% | 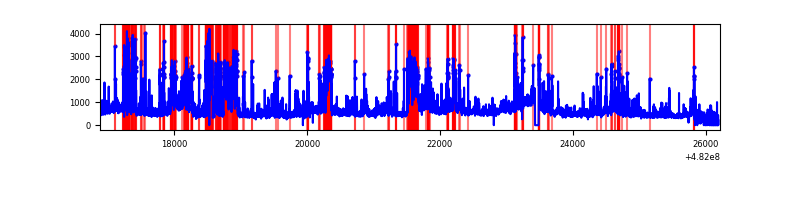 |
Top three noisy pixels from each quadrant. If the there are fewer than three noisy pixels in the level2.evt file, extra rows are filled as -1
| Pixel properties | Quadrant properties | ||||||
|---|---|---|---|---|---|---|---|
| Quadrant | DetID | PixID | Counts | Sigma | Mean | Median | Sigma |
| A | 12 | 3 | 2831893 | 12796.4 | 890 | 870 | 221.2 |
| A | 7 | 64 | 2308623 | 10431.19 | 890 | 870 | 221.2 |
| A | 12 | 250 | 1524717 | 6887.88 | 890 | 870 | 221.2 |
| B | 0 | 171 | 211403 | 1003.06 | 982 | 946 | 209.8 |
| B | 4 | 216 | 100562 | 474.78 | 982 | 946 | 209.8 |
| B | 0 | 213 | 91397 | 431.1 | 982 | 946 | 209.8 |
| C | 15 | 198 | 2505010 | 9591.18 | 947 | 939 | 261.1 |
| C | 13 | 3 | 940865 | 3600.14 | 947 | 939 | 261.1 |
| C | 9 | 38 | 255463 | 974.88 | 947 | 939 | 261.1 |
| D | 8 | 176 | 1012635 | 3885.87 | 932 | 900 | 260.4 |
| D | 7 | 60 | 681527 | 2614.15 | 932 | 900 | 260.4 |
| D | 12 | 6 | 536235 | 2056.12 | 932 | 900 | 260.4 |
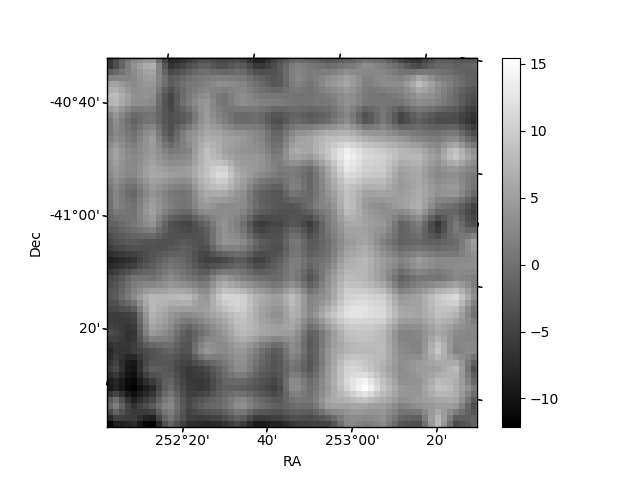
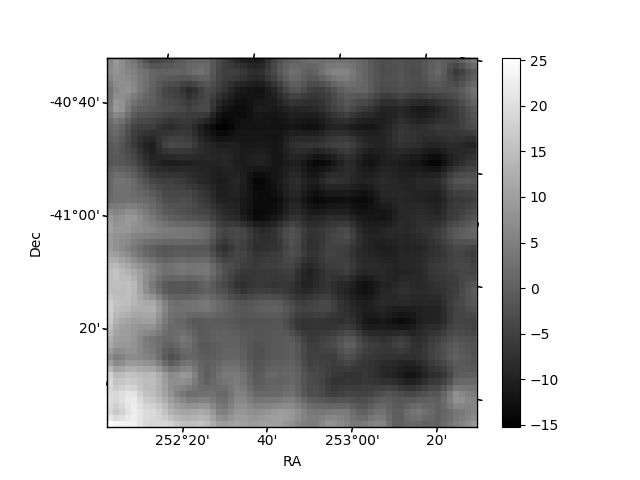
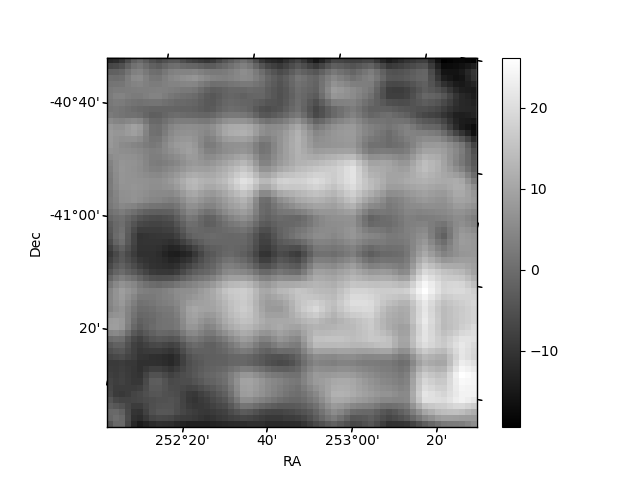
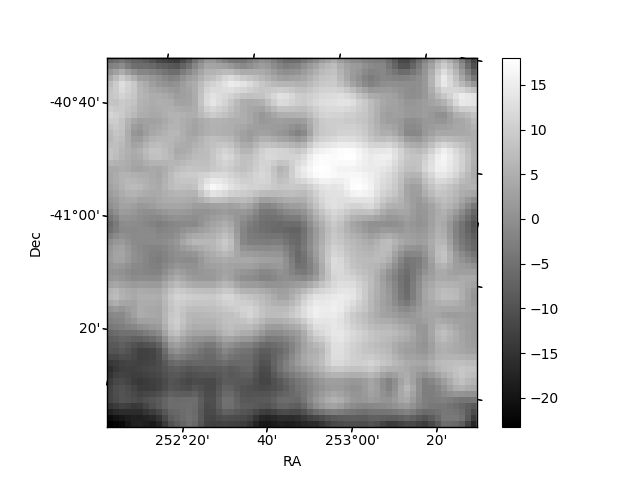
Histogram calculated using DETX and DETY for each event in the final _common_clean file
| Quadrant A | 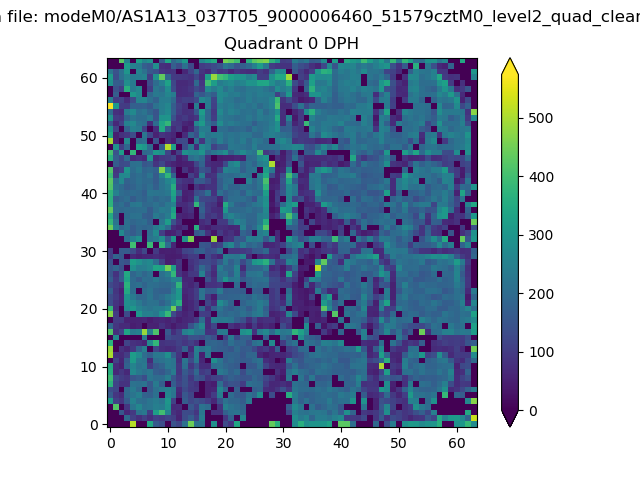 |
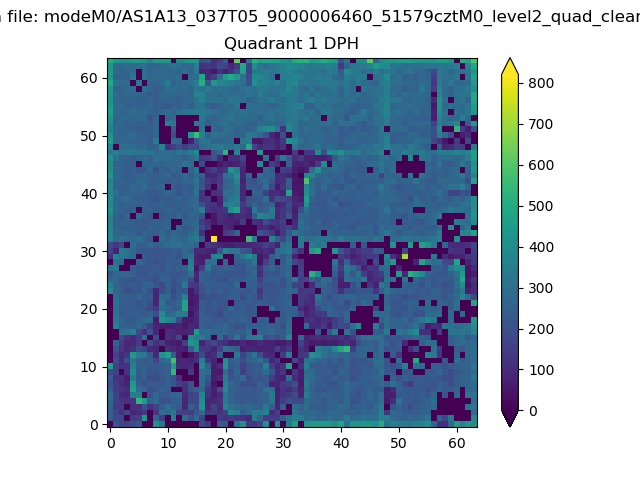 |
Quadrant B |
|---|---|---|---|
| Quadrant D | 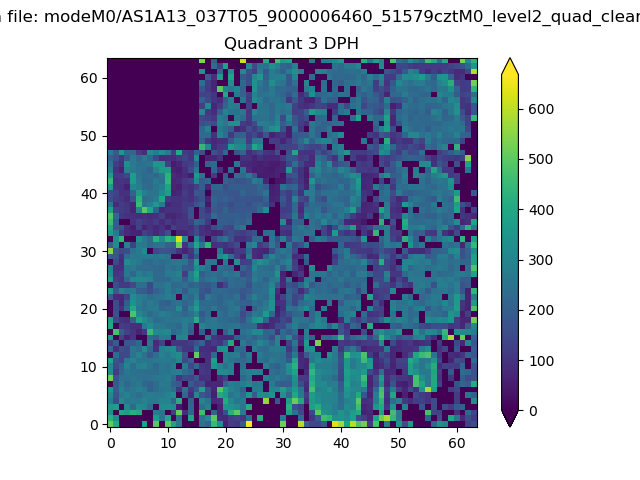 |
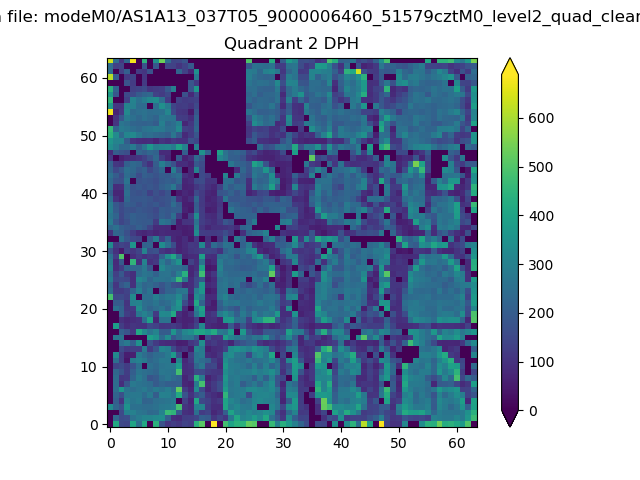 |
Quadrant C |
| Plot type | Count rate plots | Images |
|---|---|---|
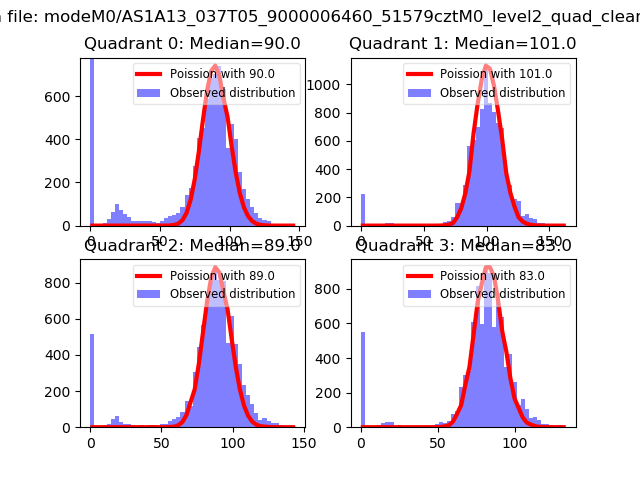
| Comparison with Poisson distribution Blue bars denote a histogram of data divided into 1 sec bins. Red curve is a Poisson curve with rate = median count rate of data. |
 |
 |
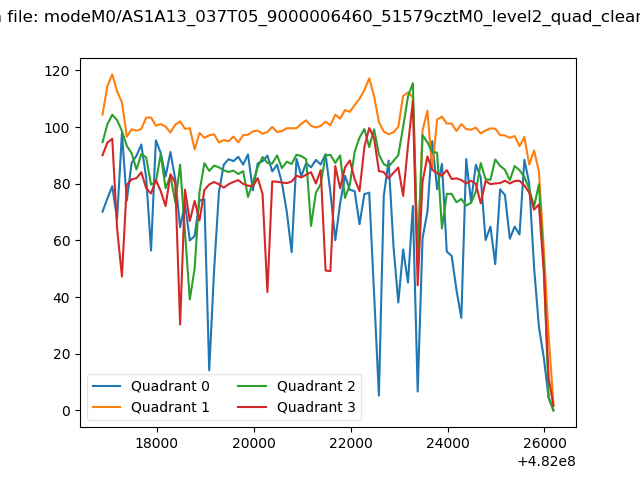
| Quadrant-wise count rates Data is divided into 100 sec bins |
 |
|
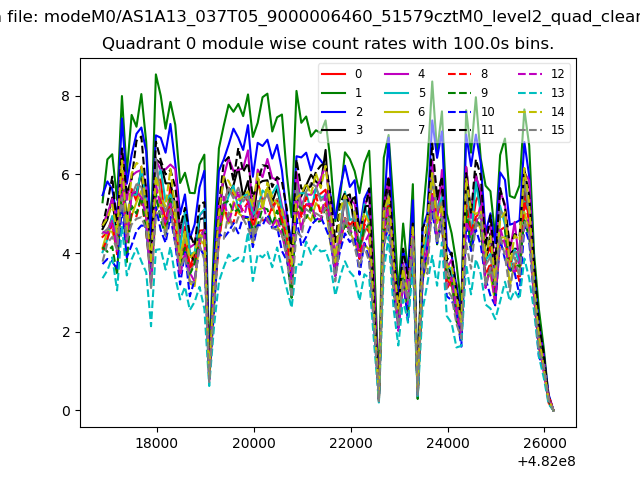
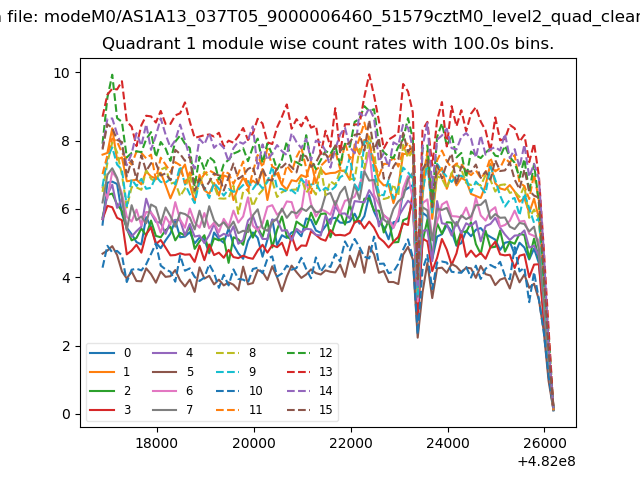
| Module-wise count rates for Quadrant A Data is divided into 100 sec bins |
 |
 |
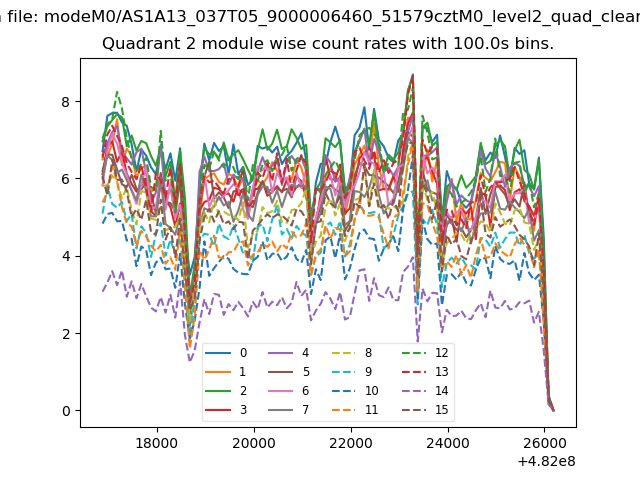
| Module-wise count rates for Quadrant B Data is divided into 100 sec bins |
 |
 |
| Module-wise count rates for Quadrant C Data is divided into 100 sec bins |
 |
 |
| Module-wise count rates for Quadrant D Data is divided into 100 sec bins |
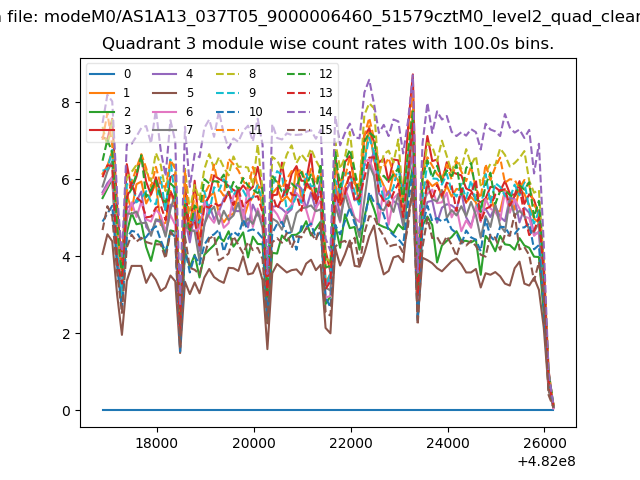 |
 |
| Parameter | Plot |
|---|---|
| CZT HV Monitor | 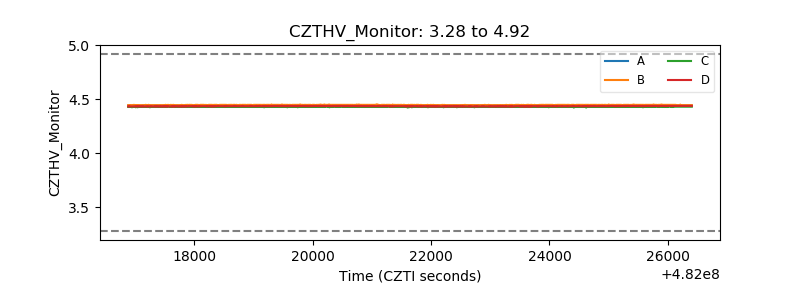 |
| D_VDD | 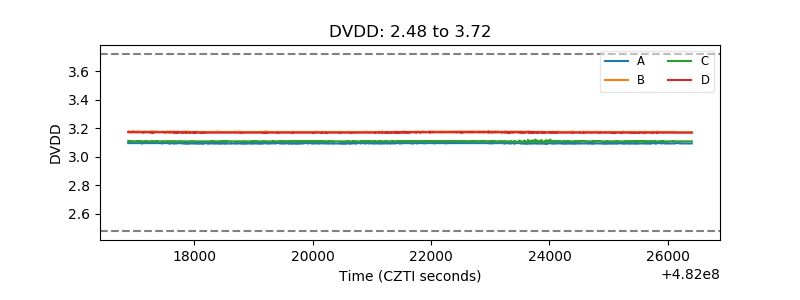 |
| Temperature 1 | 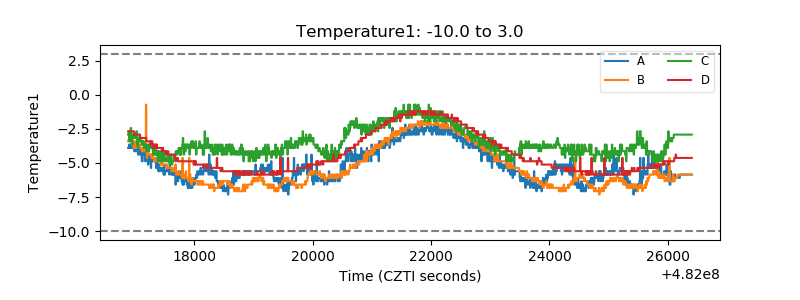 |
| Veto HV Monitor | 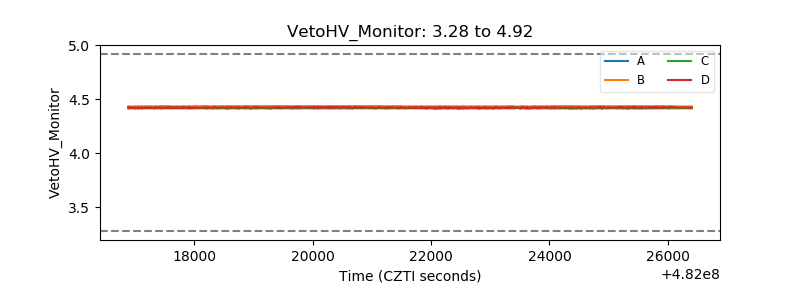 |
| Veto LLD | 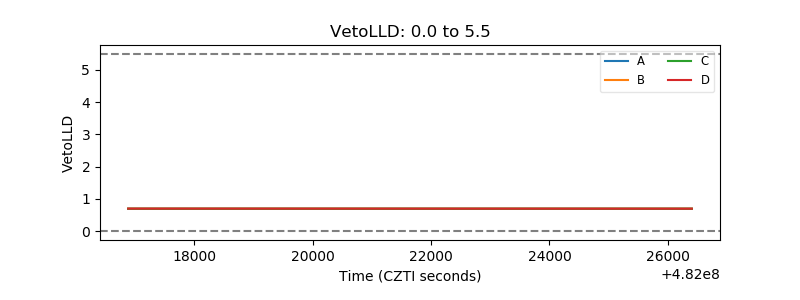 |
| Alpha Counter | 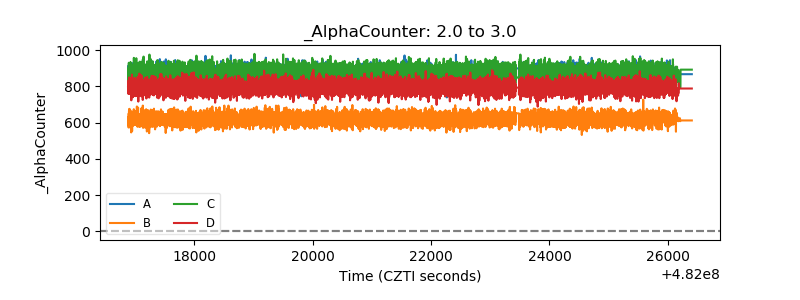 |
| _CPM_Rate |  |
| CZT Counter | 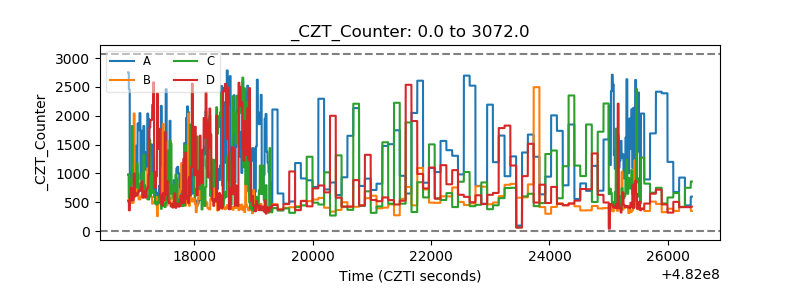 |
| +2.5 Volts monitor | 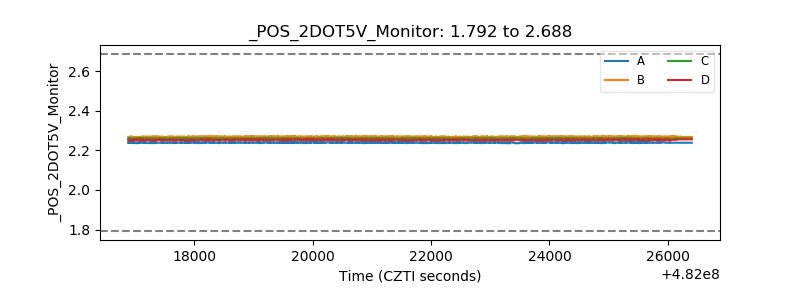 |
| +5 Volts monitor | 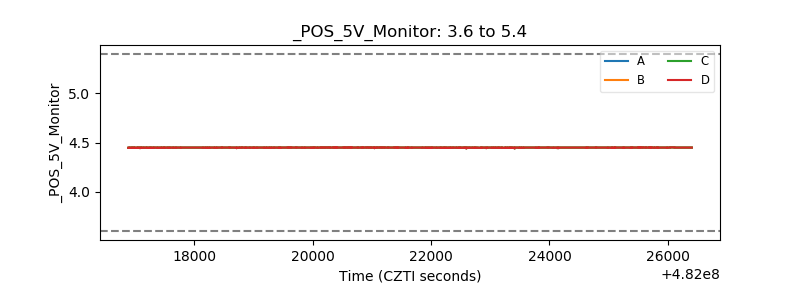 |
| _ROLL_ROT | 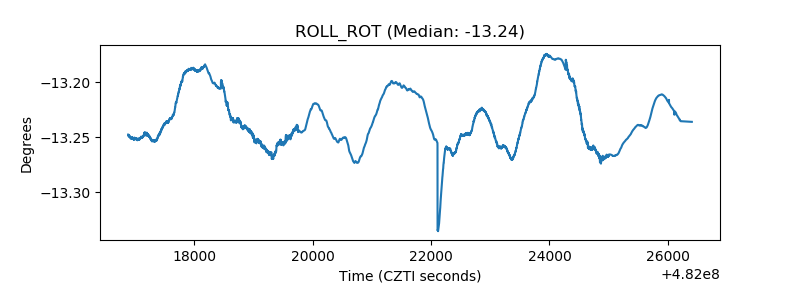 |
| _Roll_DEC | 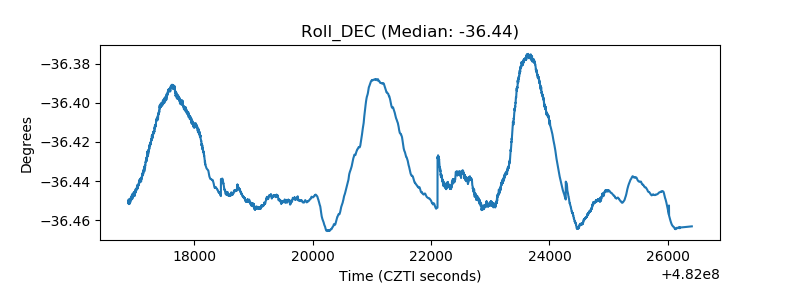 |
| _Roll_RA | 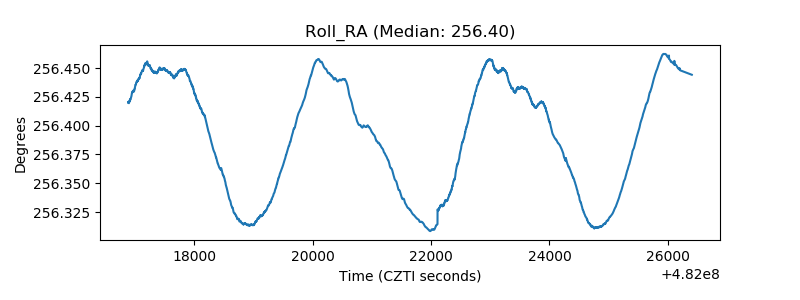 |
| Veto Counter | 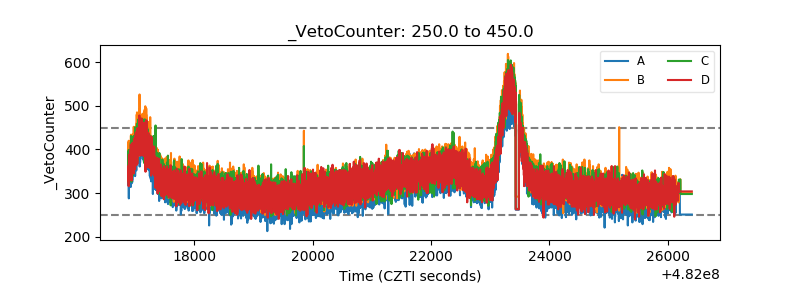 |