| Param | Original file | Final file |
|---|---|---|
| Filename | modeM0/AS1A13_037T05_9000006460_51580cztM0_level2.fits | modeM0/AS1A13_037T05_9000006460_51580cztM0_level2_quad_clean.evt |
| Size (bytes) | 978,177,600 | 117,840,960 |
| Size | 932.9 MB | 112.4 MB |
| Events in quadrant A | 10,276,384 | 848,016 |
| Events in quadrant B | 5,040,804 | 1,010,193 |
| Events in quadrant C | 10,724,031 | 250,362 |
| Events in quadrant D | 9,411,889 | 785,596 |
| Mode M9 | |||
|---|---|---|---|
| Quadrant | BADHDUFLAG | Total packets | Discarded packets |
| A | 0 | 20 | 0 |
| B | 0 | 20 | 0 |
| C | 0 | 20 | 0 |
| D | 0 | 20 | 0 |
| Mode M0 | |||
|---|---|---|---|
| Quadrant | BADHDUFLAG | Total packets | Discarded packets |
| A | 0 | 37261 | 2 |
| B | 0 | 21649 | 2 |
| C | 0 | 38870 | 2 |
| D | 0 | 34499 | 2 |
| Mode SS | |||
|---|---|---|---|
| Quadrant | BADHDUFLAG | Total packets | Discarded packets |
| A | 0 | 198 | 0 |
| B | 0 | 198 | 0 |
| C | 0 | 198 | 0 |
| D | 0 | 198 | 0 |
| Quadrant | Total seconds | Saturated seconds | Saturation percentage |
|---|---|---|---|
| A | 9718 | 1164 | 11.977773% |
| B | 9718 | 178 | 1.831653% |
| C | 9718 | 7097 | 73.029430% |
| D | 9718 | 985 | 10.135830% |
Noise dominated data is calculated using 1-second bins in cleaned event files. If a bin has >2000 counts, and if more than 50% of those come from <1% of pixels, then it is considered to be noise-dominated and hence unusable.
| Quadrant | # 1 sec bins | Bins with >0 counts | Bins with >2000 counts | High rate bins dominated by noise | Noise dominated (total time) | Noise dominated (detector-on time) | Marked lightcurve |
|---|---|---|---|---|---|---|---|
| A | 11663 | 9720 | 782 | 782 | 6.70% | 8.05% | 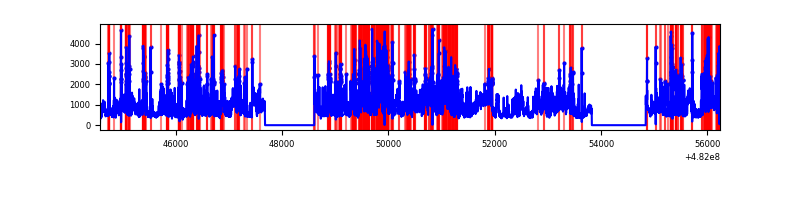 |
| B | 11663 | 9720 | 32 | 32 | 0.27% | 0.33% | 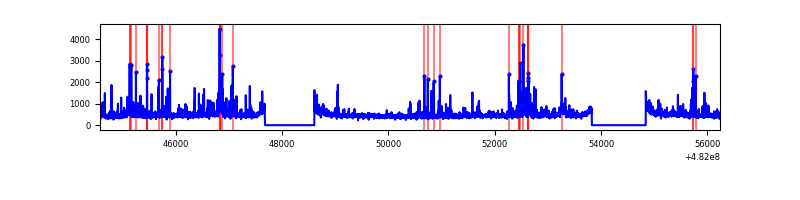 |
| C | 11662 | 9714 | 940 | 940 | 8.06% | 9.68% | 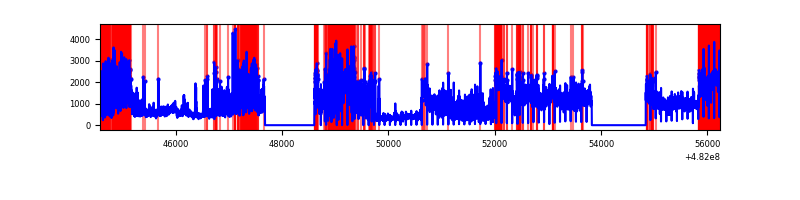 |
| D | 11663 | 9720 | 892 | 892 | 7.65% | 9.18% | 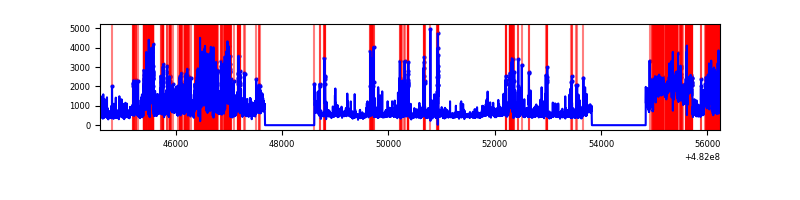 |
Top three noisy pixels from each quadrant. If the there are fewer than three noisy pixels in the level2.evt file, extra rows are filled as -1
| Pixel properties | Quadrant properties | ||||||
|---|---|---|---|---|---|---|---|
| Quadrant | DetID | PixID | Counts | Sigma | Mean | Median | Sigma |
| A | 7 | 64 | 2597519 | 10369.17 | 1030 | 1006 | 250.4 |
| A | 12 | 3 | 1811922 | 7231.89 | 1030 | 1006 | 250.4 |
| A | 12 | 250 | 544674 | 2171.14 | 1030 | 1006 | 250.4 |
| B | 7 | 252 | 145089 | 628.27 | 1060 | 1021 | 229.3 |
| B | 10 | 44 | 115775 | 500.43 | 1060 | 1021 | 229.3 |
| B | 0 | 216 | 82181 | 353.93 | 1060 | 1021 | 229.3 |
| C | 15 | 198 | 7937066 | 79171.03 | 363 | 360 | 100.2 |
| C | 3 | 233 | 205417 | 2045.51 | 363 | 360 | 100.2 |
| C | 13 | 3 | 159228 | 1584.76 | 363 | 360 | 100.2 |
| D | 8 | 176 | 1869027 | 6564.84 | 1014 | 976 | 284.6 |
| D | 2 | 120 | 881525 | 3094.49 | 1014 | 976 | 284.6 |
| D | 12 | 6 | 741833 | 2603.57 | 1014 | 976 | 284.6 |
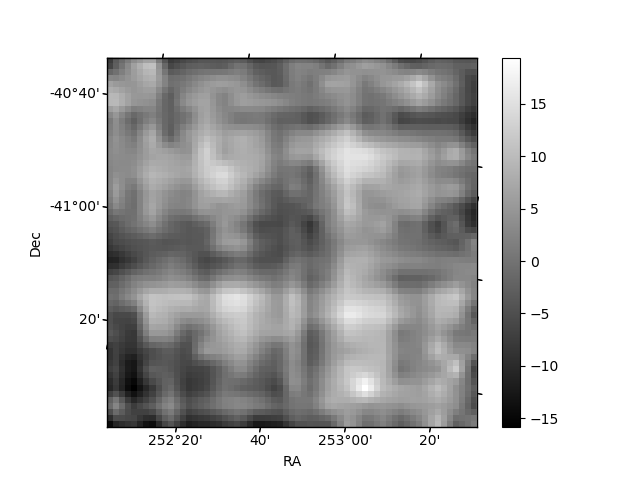
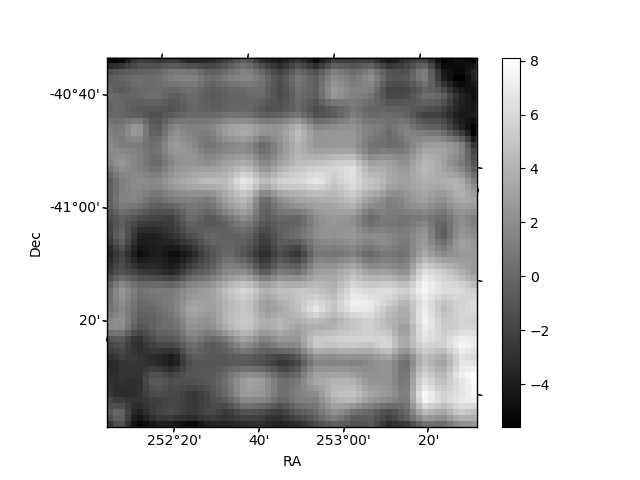
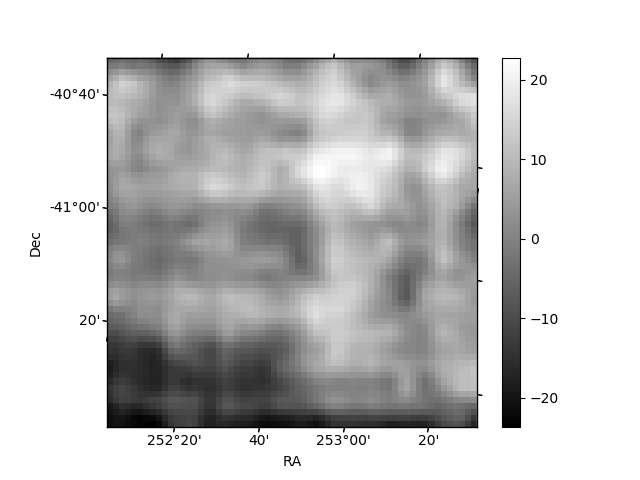
Histogram calculated using DETX and DETY for each event in the final _common_clean file
| Quadrant A | 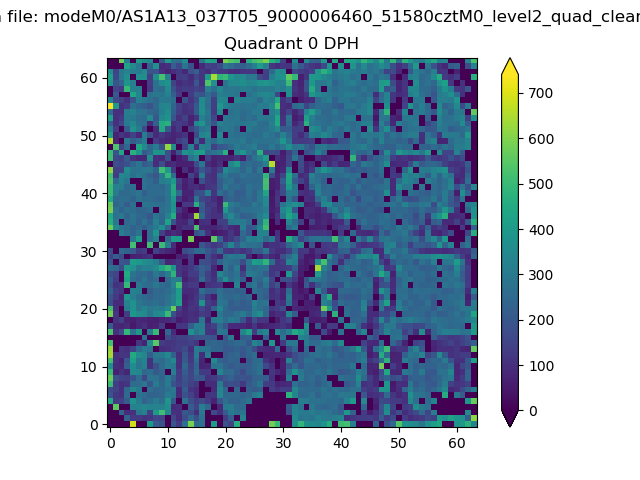 |
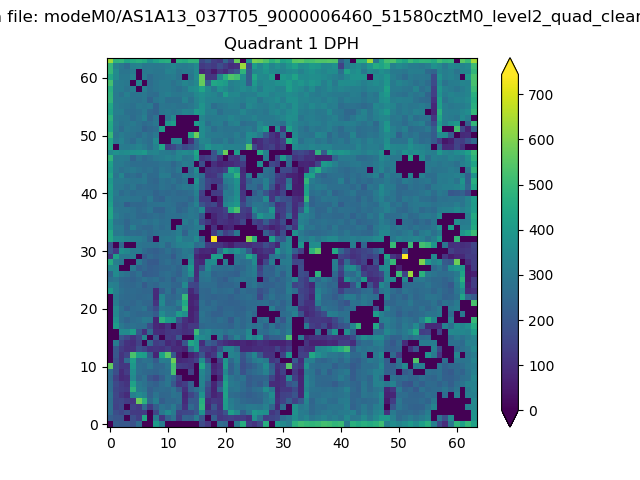 |
Quadrant B |
|---|---|---|---|
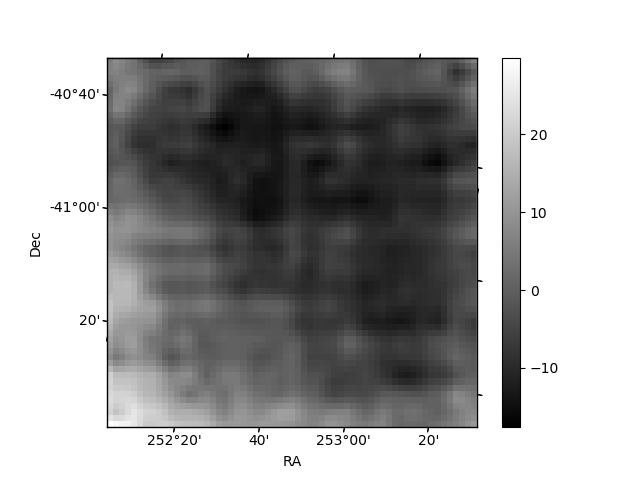
| Quadrant D | 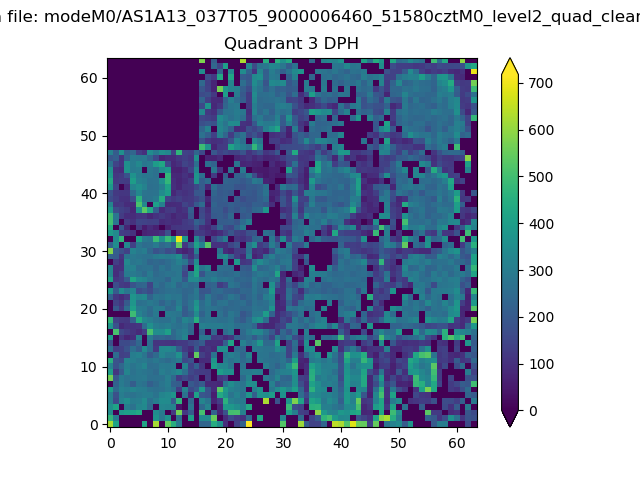 |
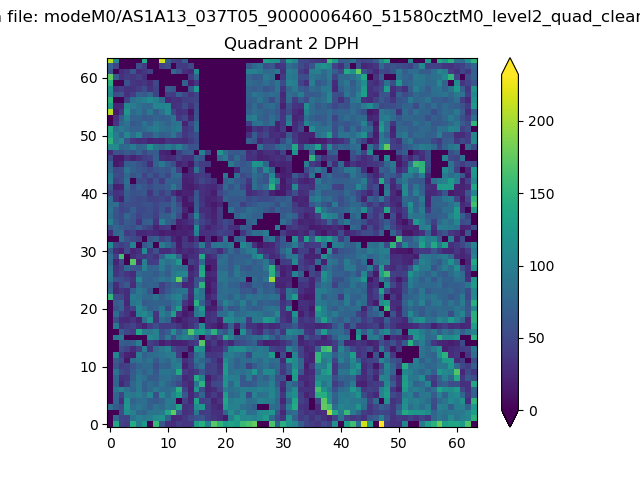 |
Quadrant C |
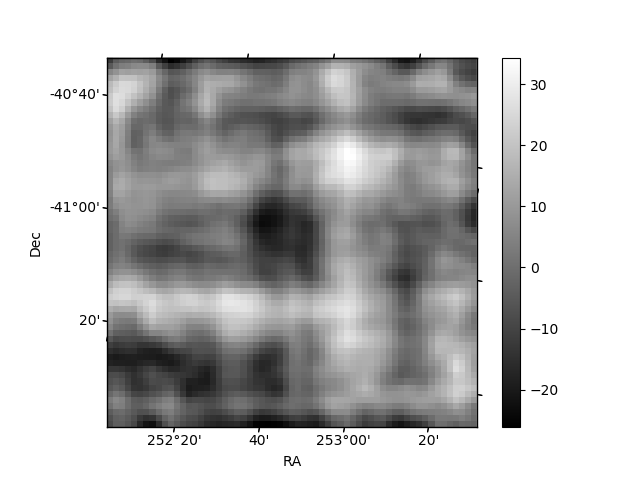
| Plot type | Count rate plots | Images |
|---|---|---|
| Comparison with Poisson distribution Blue bars denote a histogram of data divided into 1 sec bins. Red curve is a Poisson curve with rate = median count rate of data. |
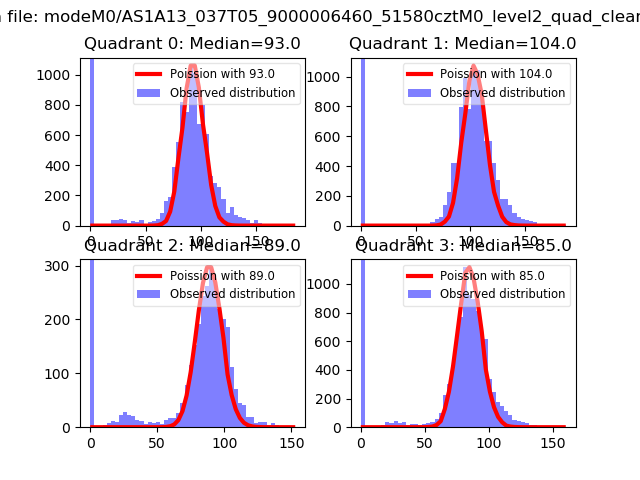 |
 |
| Quadrant-wise count rates Data is divided into 100 sec bins |
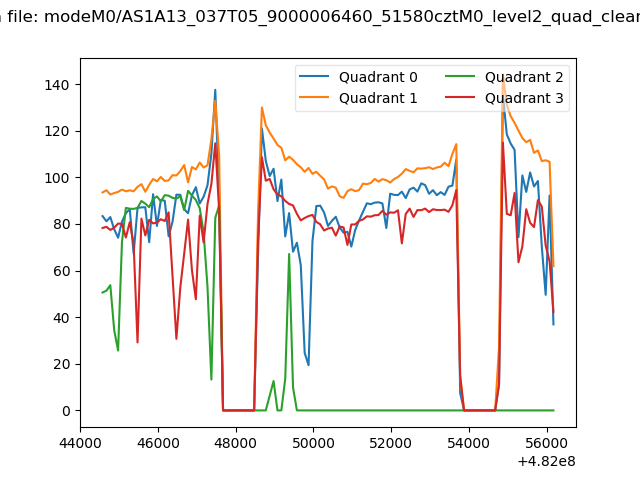 |
|
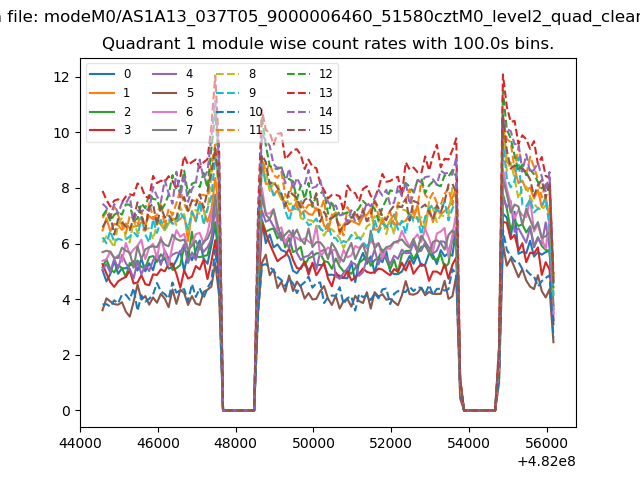
| Module-wise count rates for Quadrant A Data is divided into 100 sec bins |
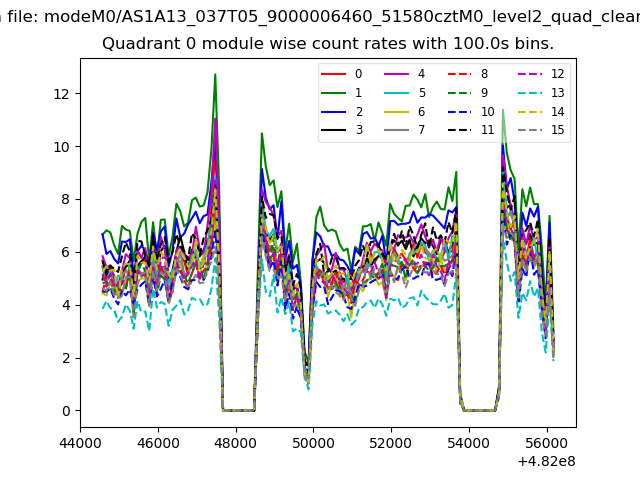 |
 |
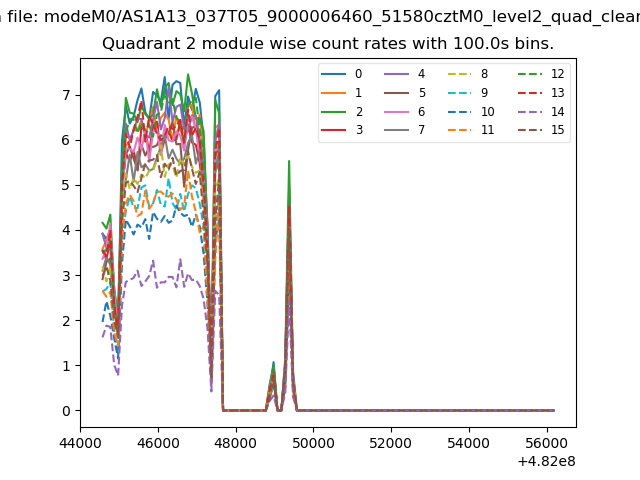
| Module-wise count rates for Quadrant B Data is divided into 100 sec bins |
 |
 |
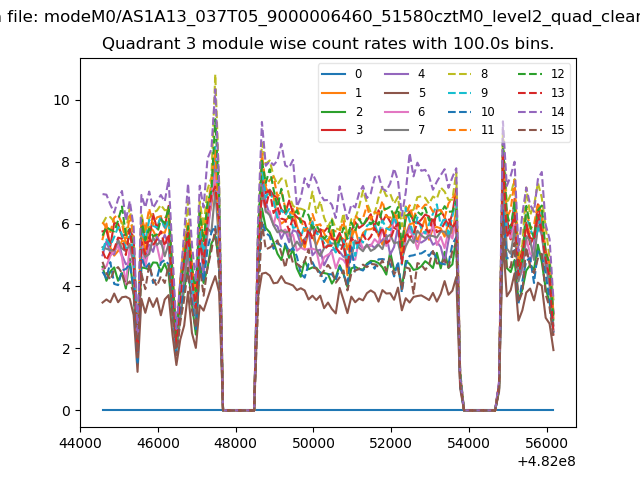
| Module-wise count rates for Quadrant C Data is divided into 100 sec bins |
 |
 |
| Module-wise count rates for Quadrant D Data is divided into 100 sec bins |
 |
 |
| Parameter | Plot |
|---|---|
| CZT HV Monitor | 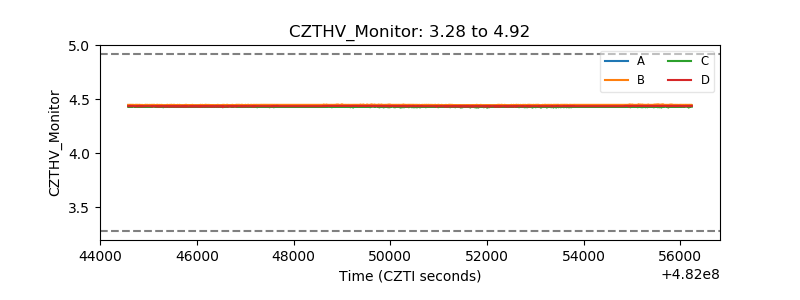 |
| D_VDD | 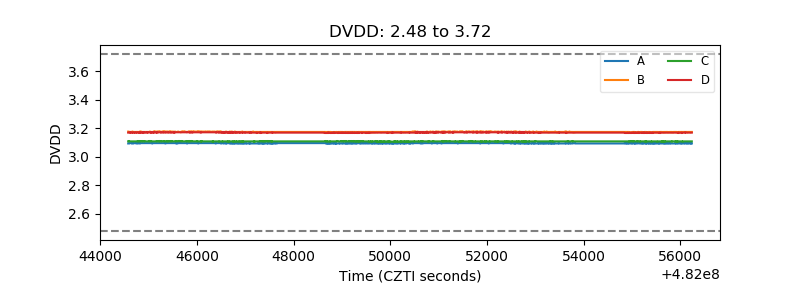 |
| Temperature 1 | 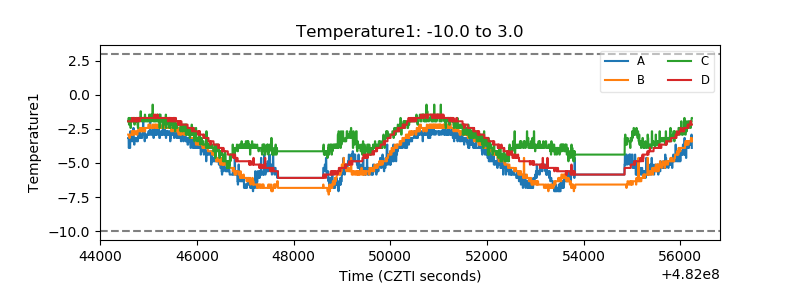 |
| Veto HV Monitor | 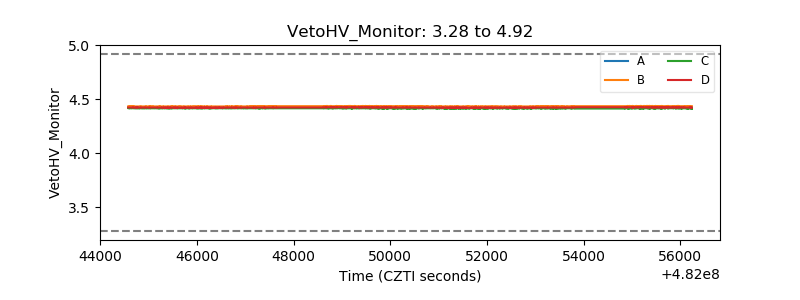 |
| Veto LLD | 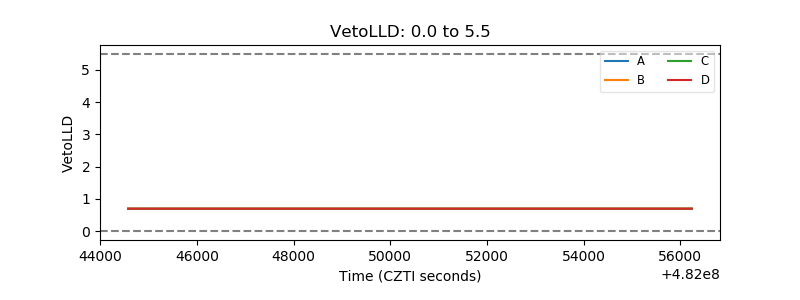 |
| Alpha Counter |  |
| _CPM_Rate | 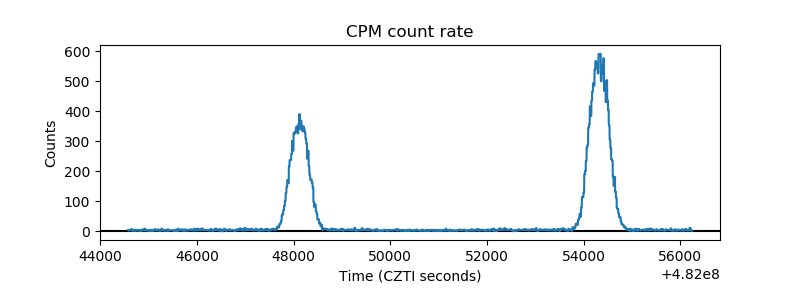 |
| CZT Counter | 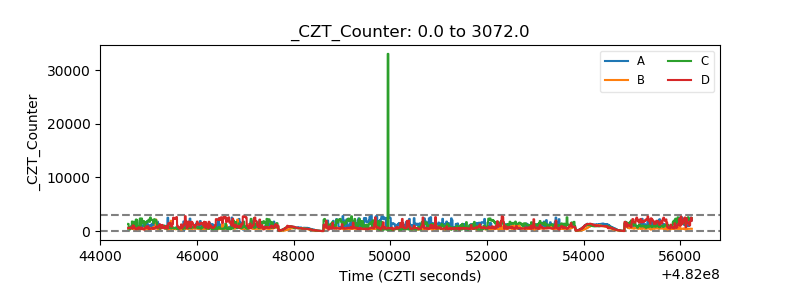 |
| +2.5 Volts monitor | 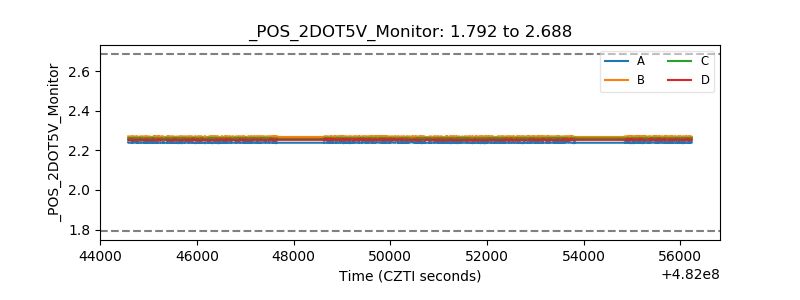 |
| +5 Volts monitor | 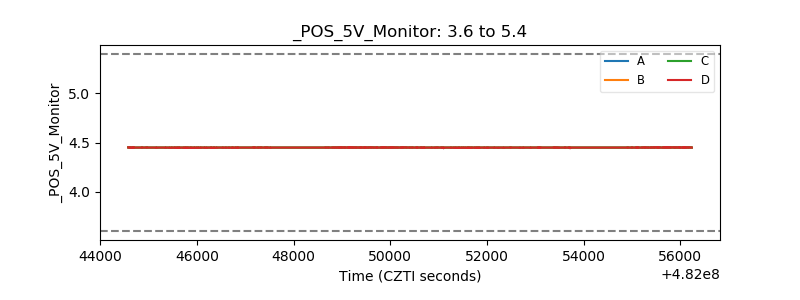 |
| _ROLL_ROT | 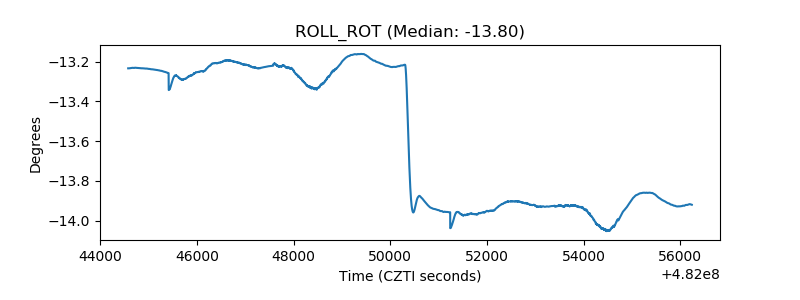 |
| _Roll_DEC | 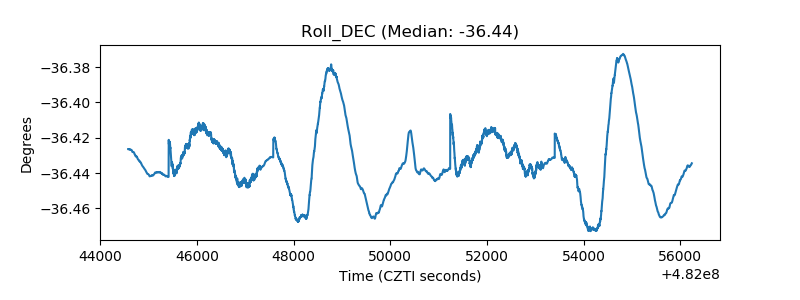 |
| _Roll_RA | 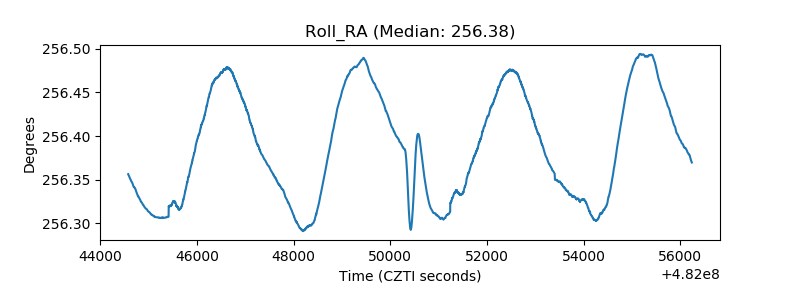 |
| Veto Counter | 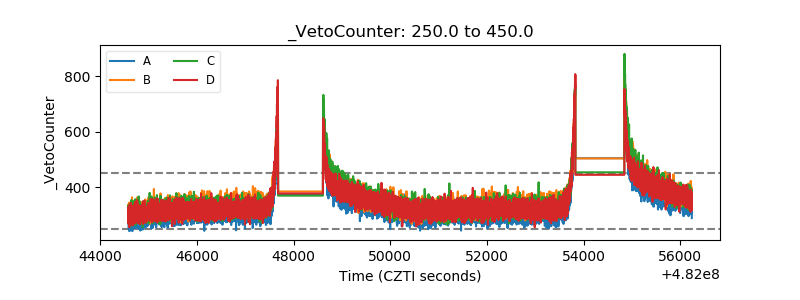 |