| Param | Original file | Final file |
|---|---|---|
| Filename | modeM0/AS1A13_037T05_9000006460_51581cztM0_level2.fits | modeM0/AS1A13_037T05_9000006460_51581cztM0_level2_quad_clean.evt |
| Size (bytes) | 3,992,368,320 | 504,241,920 |
| Size | 3.7 GB | 480.9 MB |
| Events in quadrant A | 45,093,311 | 3,209,408 |
| Events in quadrant B | 20,292,645 | 4,050,024 |
| Events in quadrant C | 44,862,480 | 2,095,511 |
| Events in quadrant D | 34,474,784 | 3,188,163 |
| Mode M9 | |||
|---|---|---|---|
| Quadrant | BADHDUFLAG | Total packets | Discarded packets |
| A | 0 | 49 | 0 |
| B | 0 | 49 | 0 |
| C | 0 | 49 | 0 |
| D | 0 | 49 | 0 |
| Mode M0 | |||
|---|---|---|---|
| Quadrant | BADHDUFLAG | Total packets | Discarded packets |
| A | 0 | 161680 | 11 |
| B | 0 | 87976 | 7 |
| C | 0 | 161059 | 9 |
| D | 0 | 129693 | 7 |
| Mode SS | |||
|---|---|---|---|
| Quadrant | BADHDUFLAG | Total packets | Discarded packets |
| A | 0 | 804 | 0 |
| B | 0 | 804 | 0 |
| C | 0 | 804 | 0 |
| D | 0 | 804 | 0 |
| Quadrant | Total seconds | Saturated seconds | Saturation percentage |
|---|---|---|---|
| A | 39644 | 7120 | 17.959843% |
| B | 39646 | 753 | 1.899309% |
| C | 39645 | 17372 | 43.818893% |
| D | 39645 | 3237 | 8.164964% |
Noise dominated data is calculated using 1-second bins in cleaned event files. If a bin has >2000 counts, and if more than 50% of those come from <1% of pixels, then it is considered to be noise-dominated and hence unusable.
| Quadrant | # 1 sec bins | Bins with >0 counts | Bins with >2000 counts | High rate bins dominated by noise | Noise dominated (total time) | Noise dominated (detector-on time) | Marked lightcurve |
|---|---|---|---|---|---|---|---|
| A | 44510 | 39652 | 4863 | 4863 | 10.93% | 12.26% | 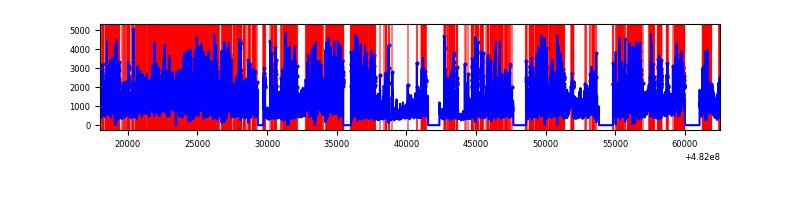 |
| B | 44511 | 39653 | 148 | 148 | 0.33% | 0.37% | 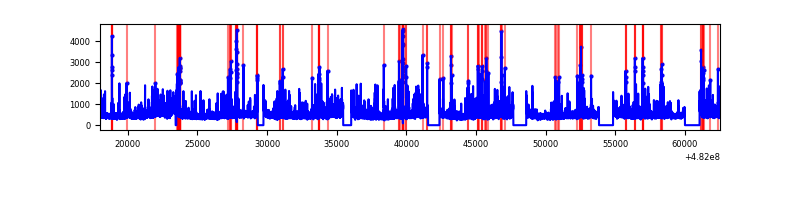 |
| C | 44509 | 39643 | 5433 | 5433 | 12.21% | 13.70% | 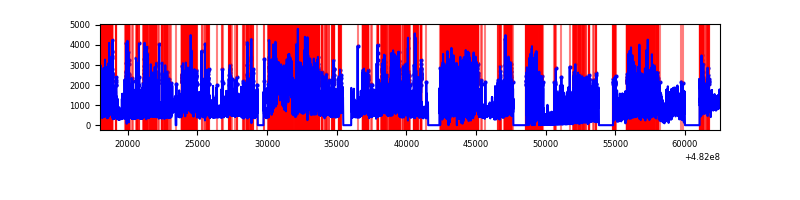 |
| D | 44510 | 39652 | 2963 | 2963 | 6.66% | 7.47% | 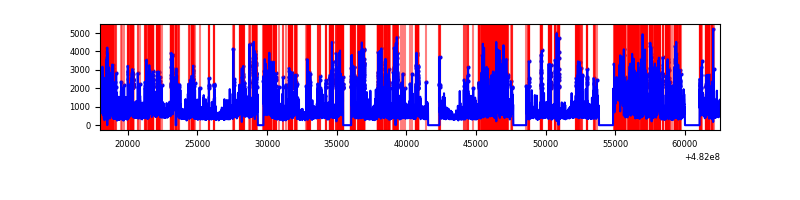 |
Top three noisy pixels from each quadrant. If the there are fewer than three noisy pixels in the level2.evt file, extra rows are filled as -1
| Pixel properties | Quadrant properties | ||||||
|---|---|---|---|---|---|---|---|
| Quadrant | DetID | PixID | Counts | Sigma | Mean | Median | Sigma |
| A | 7 | 64 | 11063101 | 11223.29 | 4015 | 3912 | 985.4 |
| A | 12 | 3 | 7800559 | 7912.34 | 4015 | 3912 | 985.4 |
| A | 12 | 250 | 3636782 | 3686.78 | 4015 | 3912 | 985.4 |
| B | 0 | 171 | 422400 | 461.59 | 4264 | 4108 | 906.2 |
| B | 10 | 247 | 313590 | 341.51 | 4264 | 4108 | 906.2 |
| B | 7 | 252 | 313328 | 341.23 | 4264 | 4108 | 906.2 |
| C | 15 | 198 | 25778556 | 32972.34 | 2808 | 2785 | 781.7 |
| C | 13 | 3 | 1714353 | 2189.44 | 2808 | 2785 | 781.7 |
| C | 9 | 38 | 1646193 | 2102.25 | 2808 | 2785 | 781.7 |
| D | 8 | 176 | 6983176 | 6183.48 | 4074 | 3929 | 1128.7 |
| D | 3 | 12 | 1928495 | 1705.13 | 4074 | 3929 | 1128.7 |
| D | 12 | 6 | 1819601 | 1608.65 | 4074 | 3929 | 1128.7 |
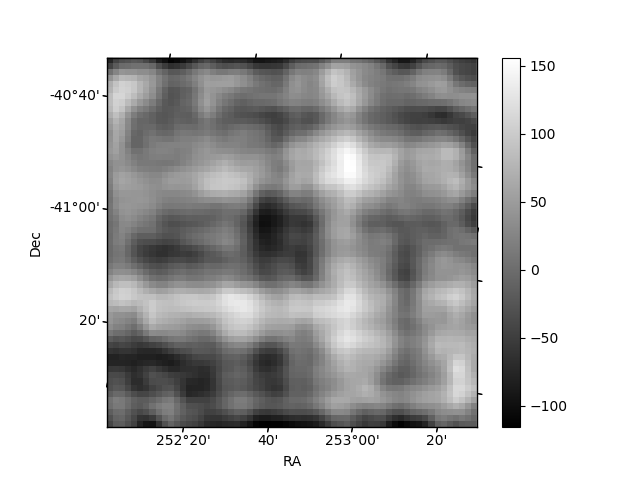
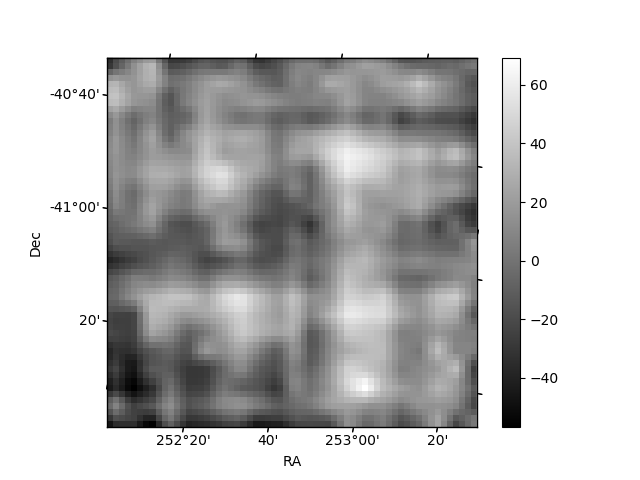
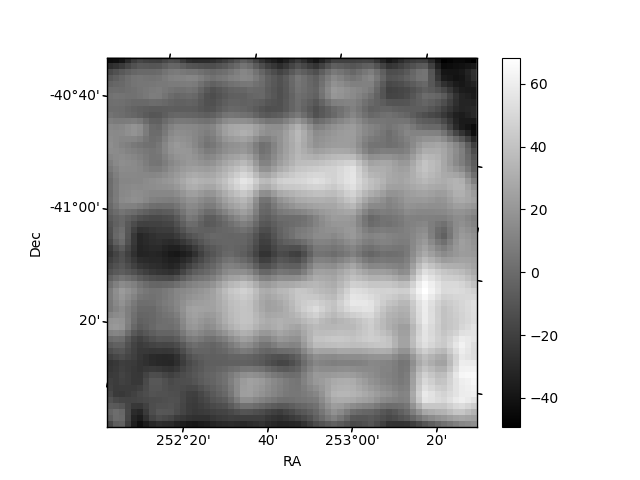
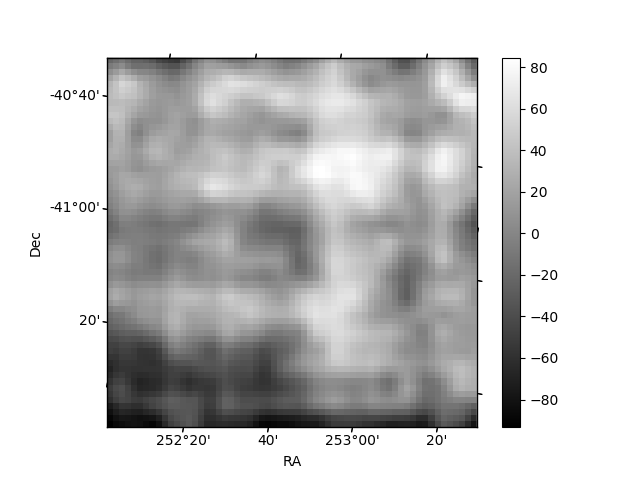
Histogram calculated using DETX and DETY for each event in the final _common_clean file
| Quadrant A | 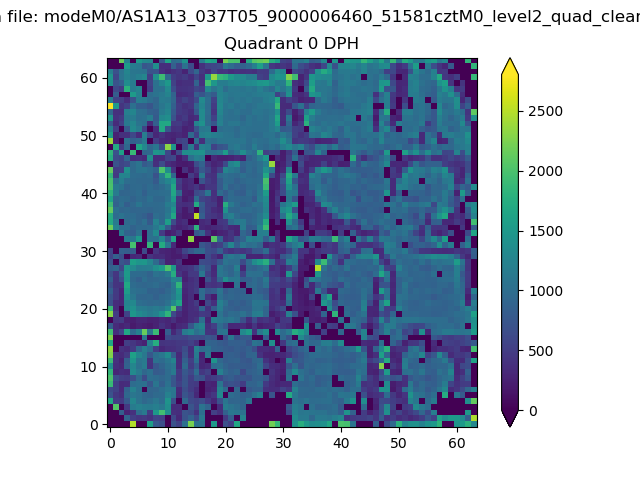 |
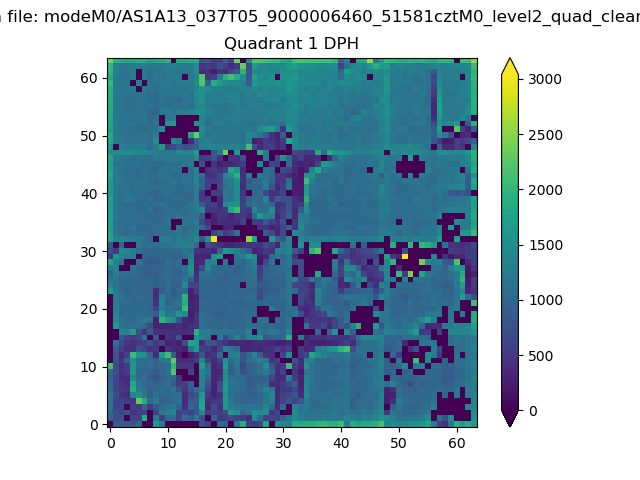 |
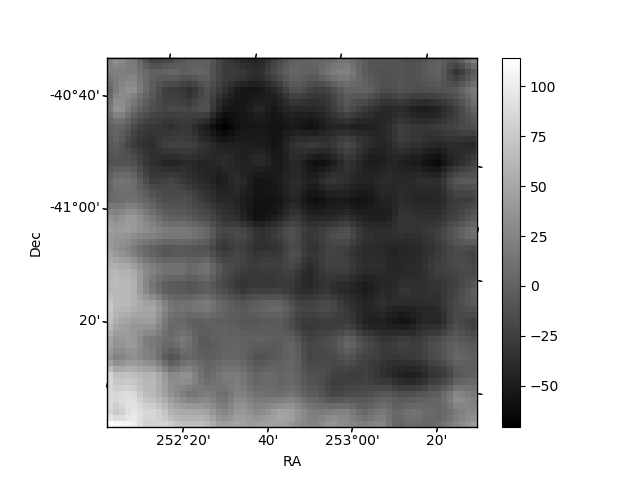
Quadrant B |
|---|---|---|---|
| Quadrant D | 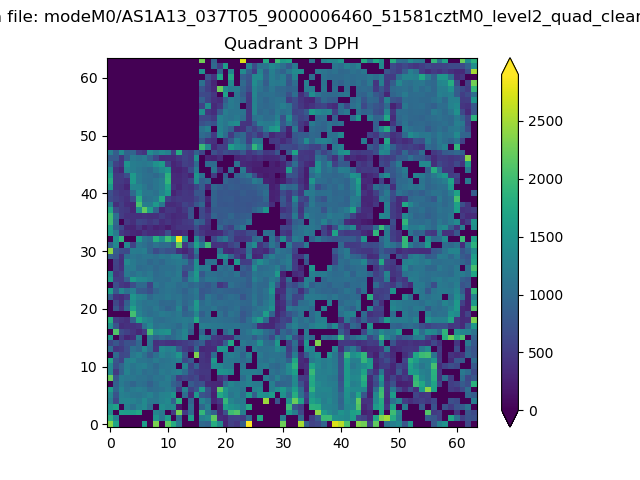 |
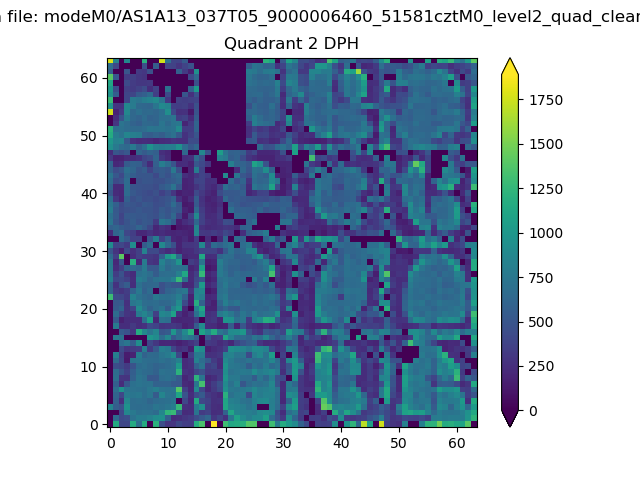 |
Quadrant C |
| Plot type | Count rate plots | Images |
|---|---|---|
| Comparison with Poisson distribution Blue bars denote a histogram of data divided into 1 sec bins. Red curve is a Poisson curve with rate = median count rate of data. |
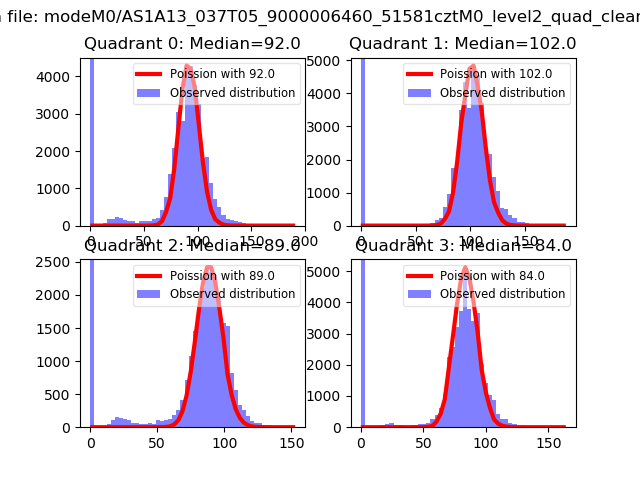 |
 |
| Quadrant-wise count rates Data is divided into 100 sec bins |
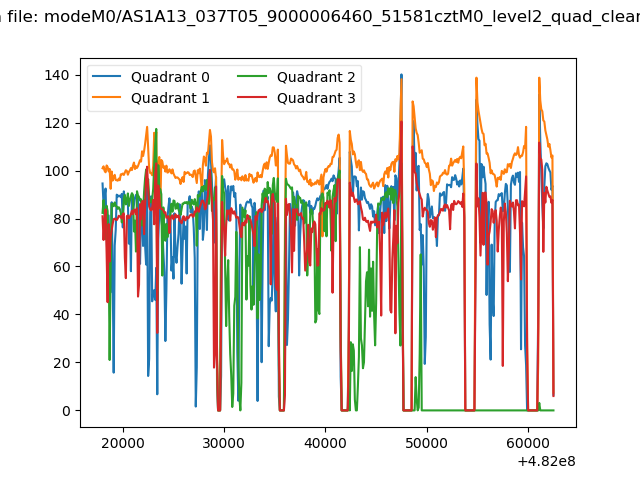 |
|
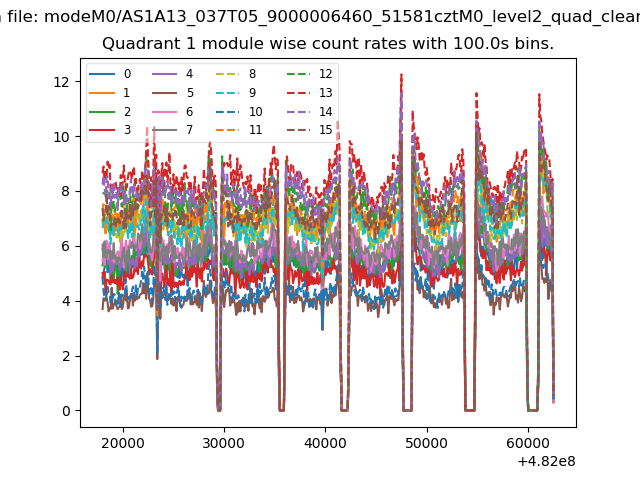
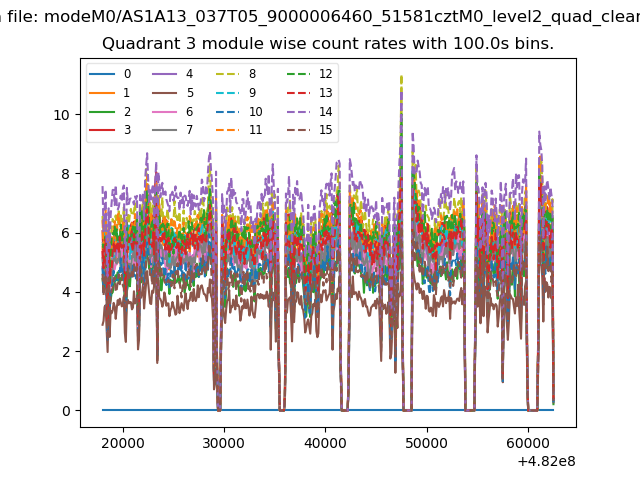
| Module-wise count rates for Quadrant A Data is divided into 100 sec bins |
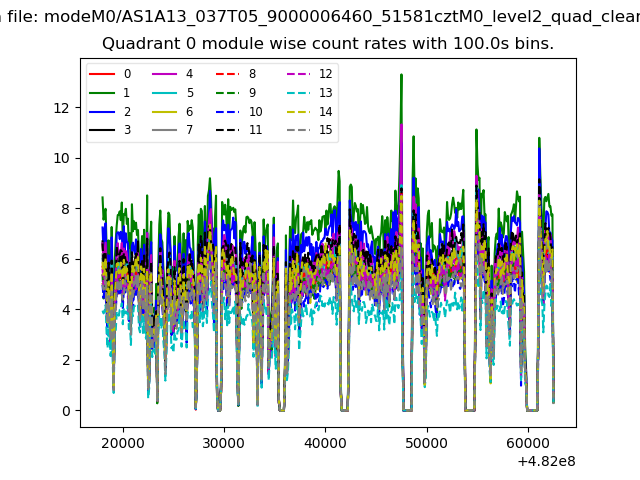 |
 |
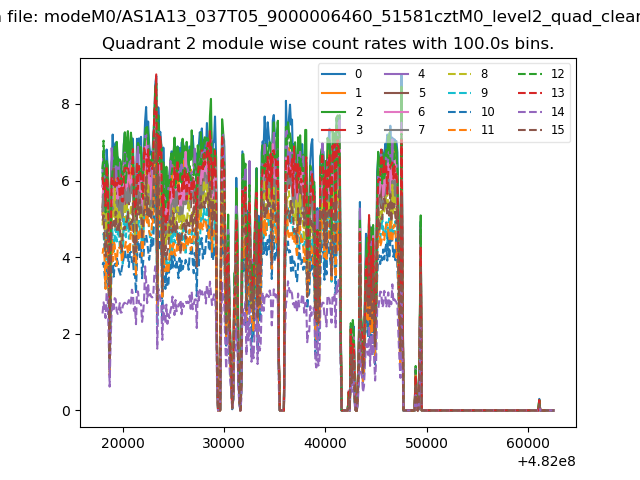
| Module-wise count rates for Quadrant B Data is divided into 100 sec bins |
 |
 |
| Module-wise count rates for Quadrant C Data is divided into 100 sec bins |
 |
 |
| Module-wise count rates for Quadrant D Data is divided into 100 sec bins |
 |
 |
| Parameter | Plot |
|---|---|
| CZT HV Monitor | 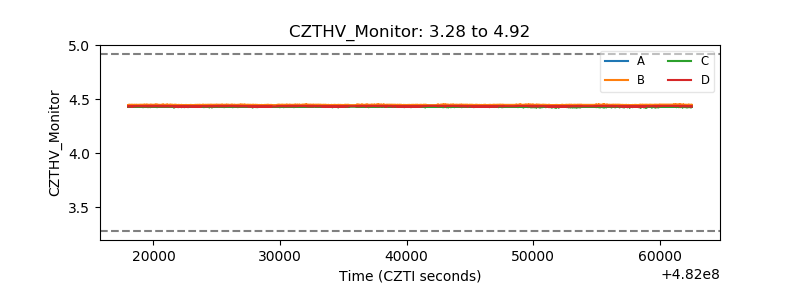 |
| D_VDD | 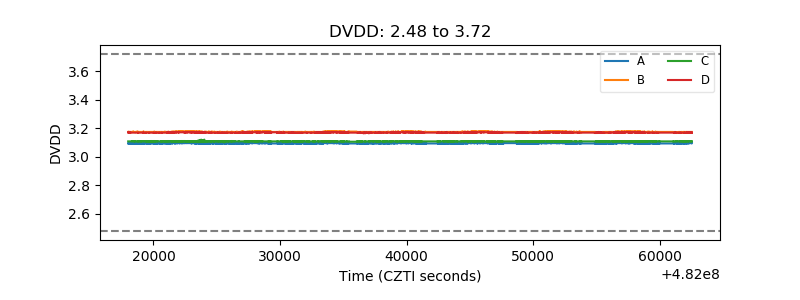 |
| Temperature 1 | 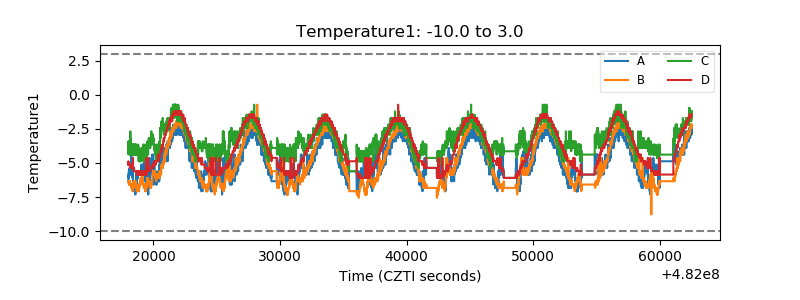 |
| Veto HV Monitor | 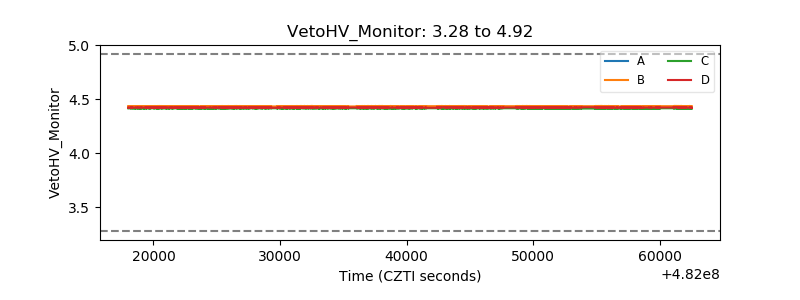 |
| Veto LLD | 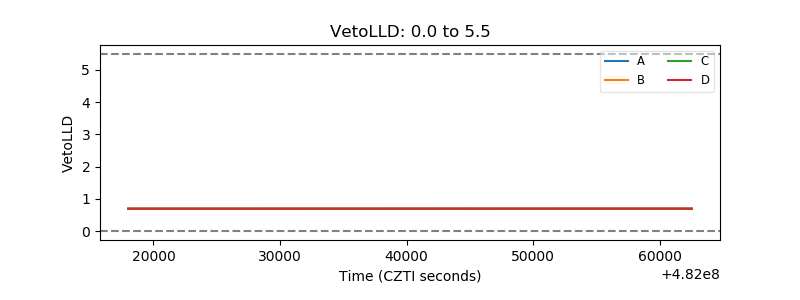 |
| Alpha Counter | 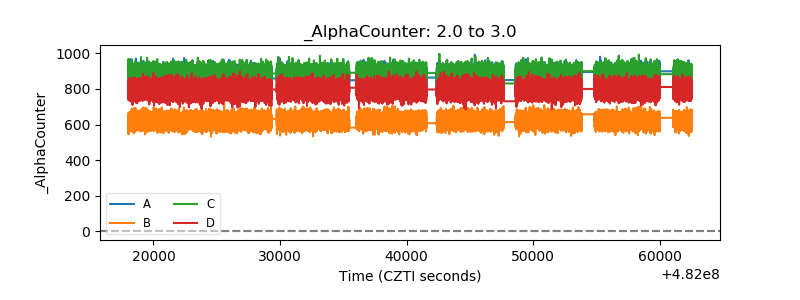 |
| _CPM_Rate | 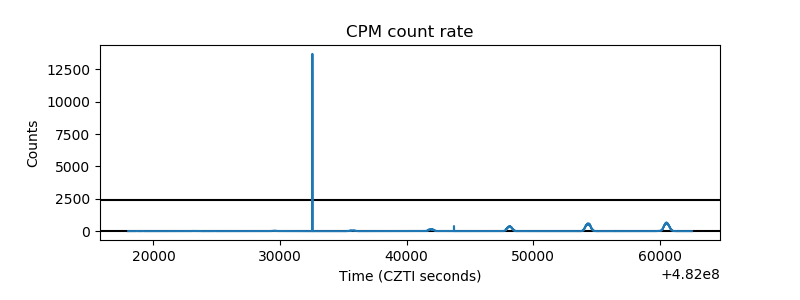 |
| CZT Counter | 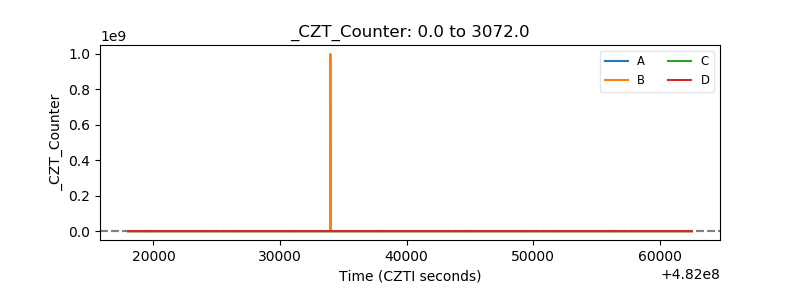 |
| +2.5 Volts monitor | 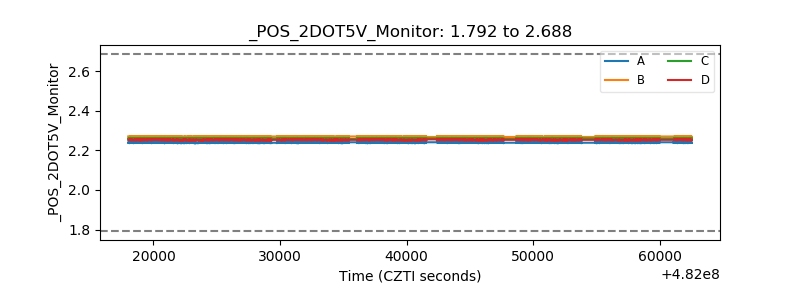 |
| +5 Volts monitor | 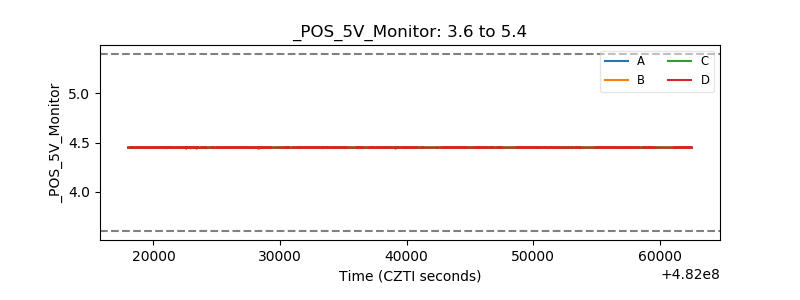 |
| _ROLL_ROT | 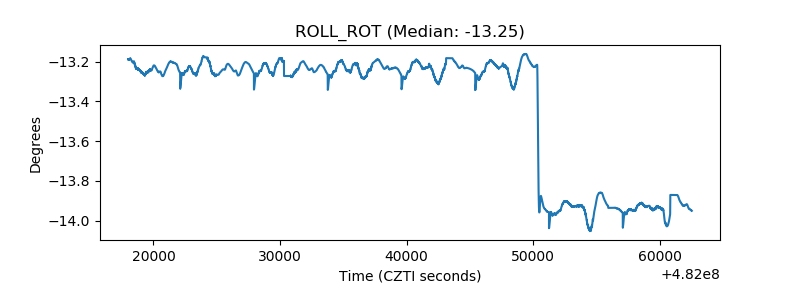 |
| _Roll_DEC | 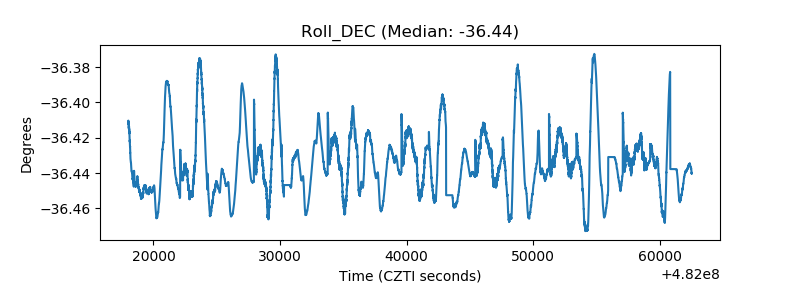 |
| _Roll_RA | 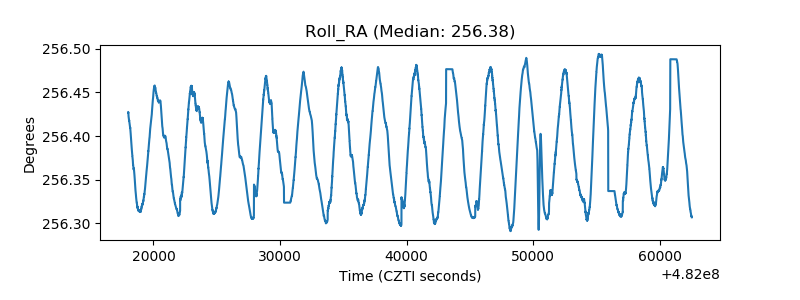 |
| Veto Counter | 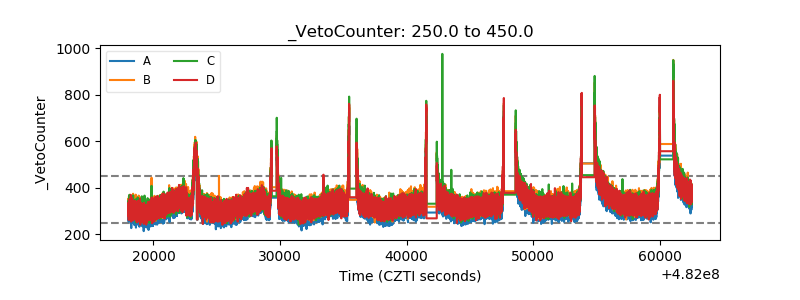 |